What Is a Good Churn Rate? 2026 Benchmarks by Segment, Stage, and Pricing Model
A founder posted on r/SaaS with a simple question: "Our churn rate is 15%. We're profitable and growing. Is that bad?" Their CAC was $50, LTV was $400, the average customer stayed 8 months, and they were growing 25% month-over-month. Every SaaS article says a good churn rate should be under 5%. That founder was doing fine.
The answer depends on your segment, stage, pricing model, and whether you're measuring customers or revenue. Let's break down where you actually stand.
What Churn Rate Actually Measures
Customer (logo) churn and revenue churn tell different stories. Logo churn counts every lost customer equally - the $29/mo startup and the $29,000/mo enterprise contract both register as one. Revenue churn weights by dollars lost.
Why this matters: 5% logo churn can equal 0% net revenue churn if remaining customers expand their spend by 5% in the same period. As Maxio notes, "All SaaS investors will ask about logo churn," but sophisticated investors pass right through to customer lifetime value. Logo churn is an input. It's not the answer.
Two definitions to keep straight: Gross Revenue Retention (GRR) can never exceed 100% - it only measures what you kept. Net Revenue Retention (NRR) includes expansion and can exceed 100%. What counts as a strong retention rate depends on the same segment and stage factors that define acceptable churn.
Benchmarks by Segment and Stage
A ProfitWell analysis of 13,000 SaaS companies gives us the clearest segment benchmarks available:
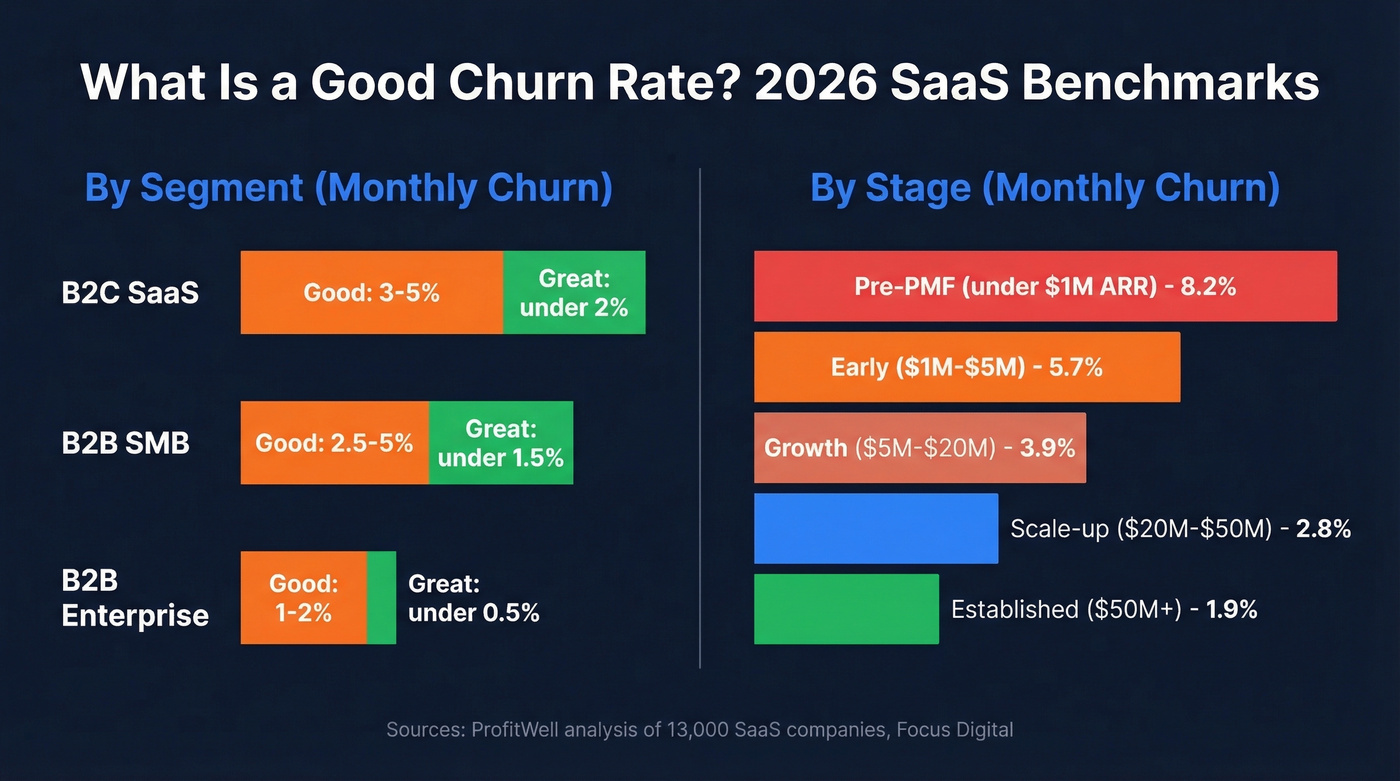
| Segment | Good (Monthly) | Great (Monthly) |
|---|---|---|
| B2C SaaS | 3-5% | < 2% |
| B2B SMB | 2.5-5% | < 1.5% |
| B2B Enterprise | 1-2% | < 0.5% |
Stage matters just as much. A Focus Digital analysis across 15 SaaS verticals shows how dramatically churn drops as companies mature:
| Company Stage | Monthly Churn | Annual Churn |
|---|---|---|
| Pre-PMF (< $1M ARR) | 8.2% | 67.8% |
| Early ($1M-$5M ARR) | 5.7% | 52.3% |
| Growth ($5M-$20M ARR) | 3.9% | 39.1% |
| Scale-up ($20M-$50M) | 2.8% | 29.4% |
| Established ($50M+) | 1.9% | 21.0% |
A pre-PMF startup with 8% monthly churn isn't in crisis - it's finding product-market fit. A $50M ARR company with 8% monthly churn is on fire. Knowing the average churn rate for your stage prevents you from benchmarking against companies in a completely different phase of growth.
Churn Rate by Industry
SaaS isn't the only world where churn matters. Here's how annual rates compare across industries:
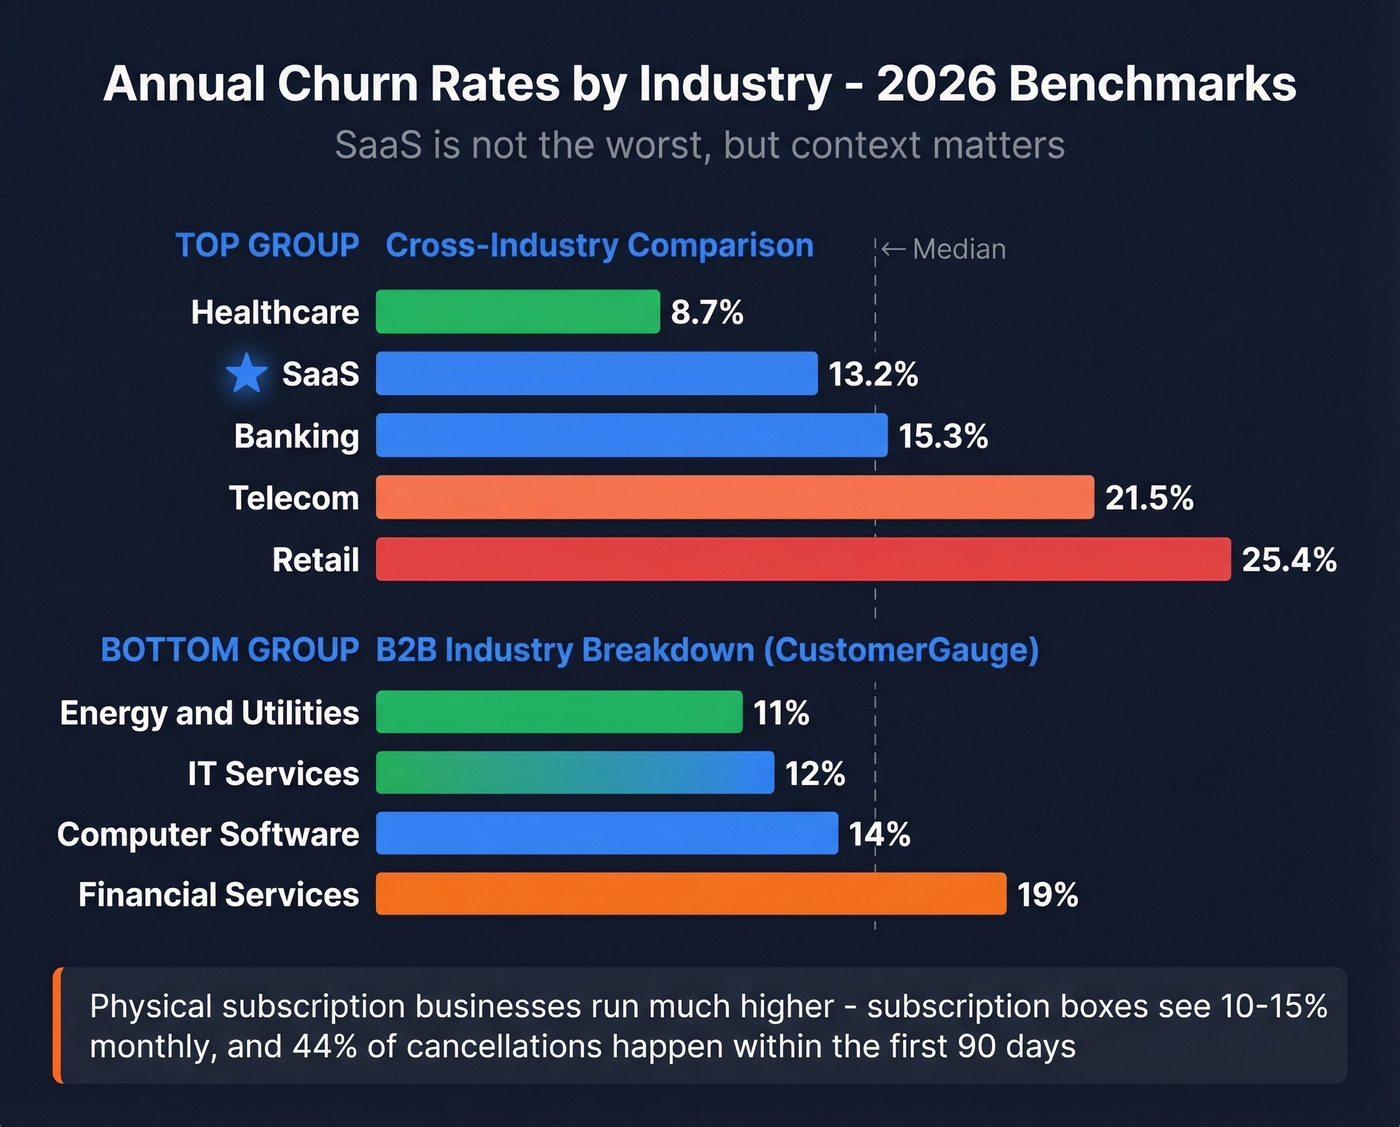
| Industry | Annual Churn |
|---|---|
| Healthcare | 8.7% |
| SaaS | 13.2% |
| Banking | 15.3% |
| Telecom | 21.5% |
| Retail | 25.4% |
And here are B2B industry averages from CustomerGauge's benchmarks:
| Industry | Annual Churn |
|---|---|
| Energy / Utilities | 11% |
| IT Services | 12% |
| Computer Software | 14% |
| Financial Services | 19% |
For physical subscription businesses, monthly churn runs significantly higher: subscription boxes see 10-15%, health & wellness 8-12%, and DTC blended lands around 6-10%. Here's the thing - 44% of subscription box cancellations happen within the first 90 days. If you're in physical subscriptions, your onboarding experience is your retention strategy.
44% of subscription cancellations happen in the first 90 days. That's not a product problem - it's a targeting problem. When outbound hits the wrong people, you acquire poor-fit customers who churn fast. Prospeo's 300M+ profiles with 30+ filters (intent data, technographics, headcount growth) let you target buyers who actually need what you sell.
Better data in means lower churn out. Start free, no contracts.
Why Monthly and Annual Churn Aren't the Same
Most benchmark articles don't specify whether they're talking about monthly or annual churn. That tells you how much of this content is written by people who've never managed a P&L.
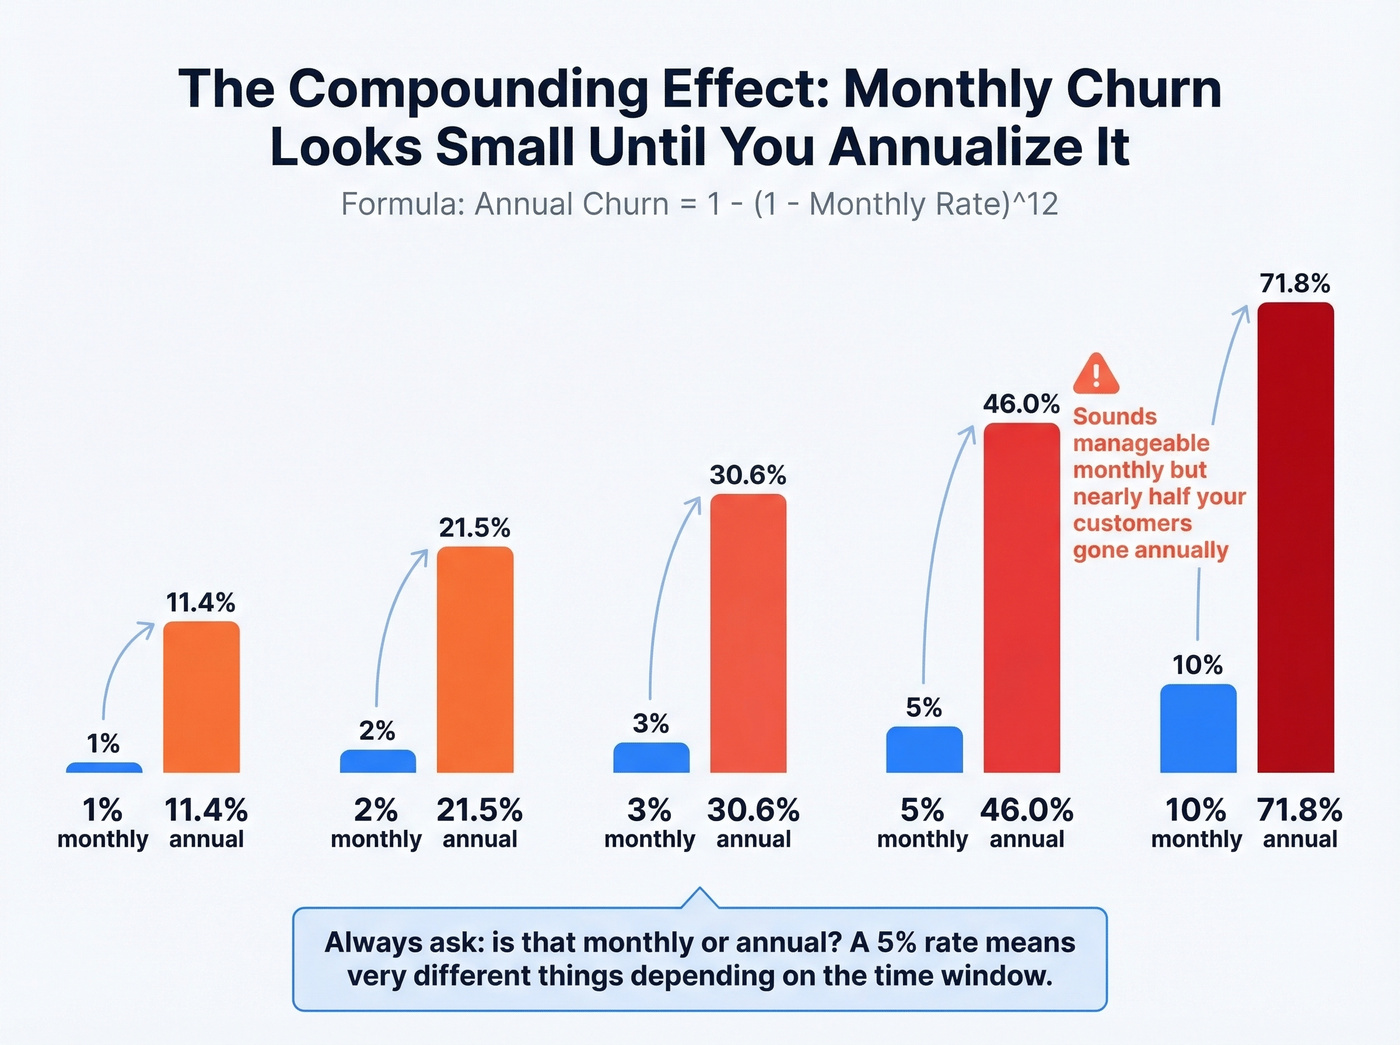
The math is brutal because of compounding. Start with 1,000 customers and 5% monthly churn. You don't lose 600 in a year (5% x 12). You lose 460, ending at roughly 540 customers. The formula: Annual churn = 1 - (1 - M)^12.
| Monthly Churn | Annual Churn |
|---|---|
| 1% | 11.4% |
| 2% | 21.5% |
| 3% | 30.6% |
| 5% | 46.0% |
| 10% | 71.8% |
That 5% monthly rate that sounds manageable? It's 46% annual churn. This is why defining an acceptable rate requires specifying the time window - a number that looks fine monthly can be catastrophic annually.
Net Revenue Retention Matters More
If you're only tracking one retention metric, make it NRR. We've seen too many teams obsess over logo churn when NRR is the number that actually determines whether you compound or die. Benchmarks by ARR band tell a clear story:
| ARR Band | NRR | GRR |
|---|---|---|
| $1M-$10M | 98% | 85% |
| $10M-$50M | 105% | 88% |
| $50M-$100M | 110% | 92% |
| $100M+ | 115% | 94% |
Median NRR across B2B SaaS sits at 106%, with top quartile companies exceeding 120%. The average retention rate for SaaS companies at scale ($50M+ ARR) lands around 92% GRR, meaning even the best operators lose some revenue to contraction and cancellations.
If you're below 100% NRR, you're shrinking inside your own customer base - new sales are just refilling a leaking bucket. Above 110%? Your logo churn rate matters a lot less than you think.
A company with 5% monthly logo churn and 120% NRR will outgrow a company with 1% logo churn and 95% NRR every single time. That's not theory. It's arithmetic.
What Drives Churn (and What to Fix First)
Involuntary churn - failed payments, expired cards - accounts for 26% of total churn. That's the easiest slice to fix. Basic dunning alone can cut it in half.
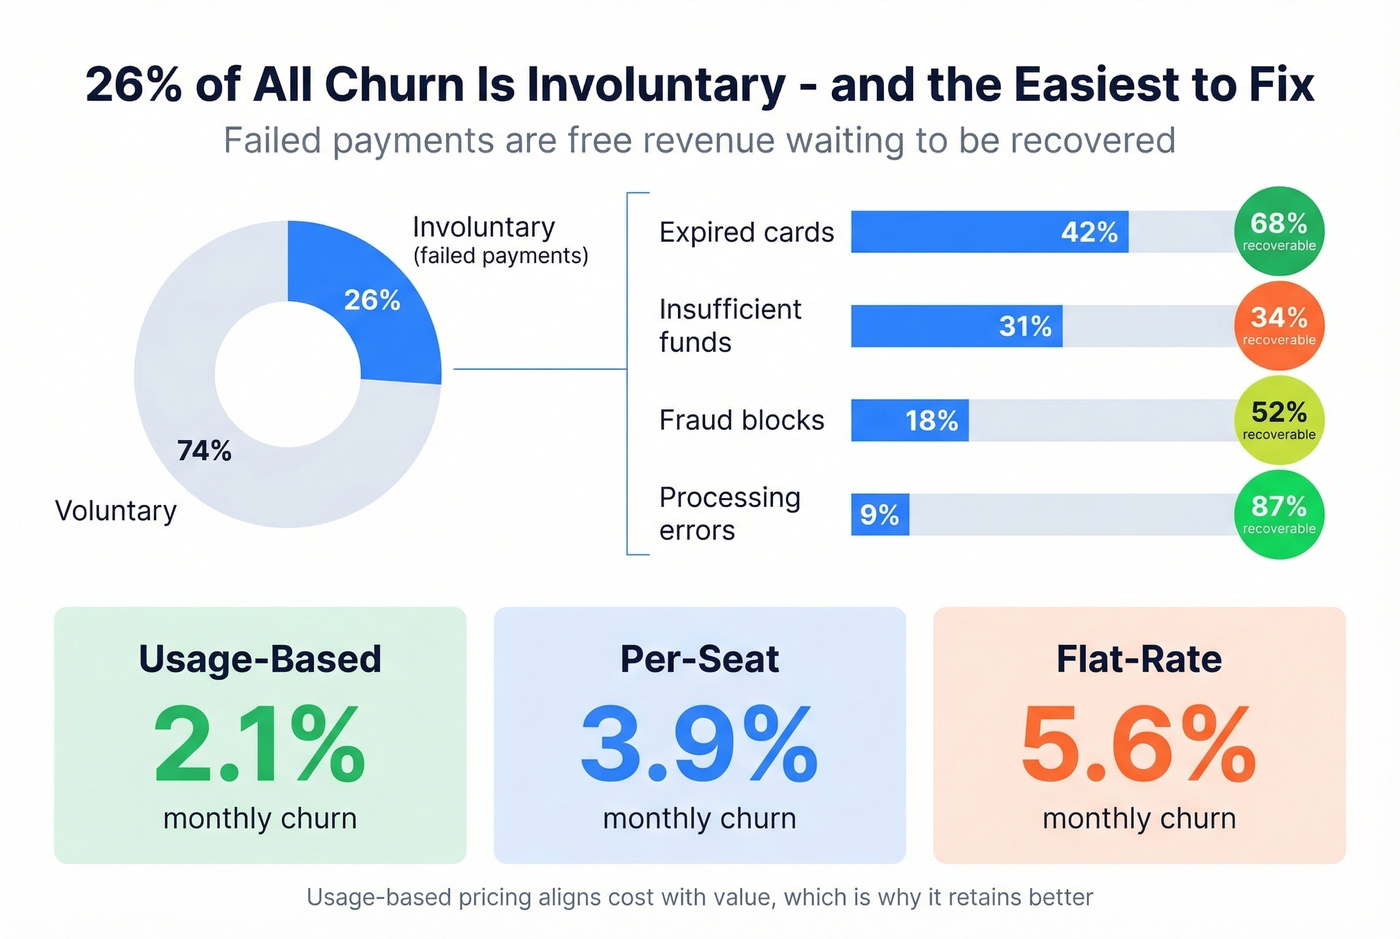
| Cause | Share of Involuntary | Recovery Rate |
|---|---|---|
| Expired cards | 42% | 68% |
| Insufficient funds | 31% | 34% |
| Fraud blocks | 18% | 52% |
| Processing errors | 9% | 87% |
Pricing model also drives churn in predictable ways. Usage-based pricing sees 2.1% monthly churn, per-seat runs 3.9%, and flat-rate hits 5.6%. Usage-based models naturally align cost with value, which is why they retain better.
Another signal worth watching: customers who use 70%+ of core features are twice as likely to stay. Non-usage of key features is a stronger churn predictor than raw login counts. Watch for silence, not complaints.
The Overlooked Upstream Problem
The most underrated churn driver sits upstream of your product entirely. Bad prospect data means outbound reaches the wrong people, producing poor-fit signups that churn within 90 days. In our experience, teams that clean up their top-of-funnel targeting see churn improvements within one quarter - not because the product changed, but because the customers got better. Tools like Prospeo verify emails in real time on a 7-day refresh cycle, so outbound reaches actual decision-makers instead of dead inboxes that produce ghost signups.
Skip this section if your churn is primarily voluntary and product-driven. But if you're seeing heavy 30-60-90 day dropoff, look at who's signing up before you look at what they're canceling.
Your NRR won't hit 110% if your pipeline is full of ghost signups from dead inboxes. Prospeo verifies emails on a 7-day refresh cycle - not the 6-week industry average - so your outbound reaches real decision-makers at ~$0.01/email. Teams using Prospeo see bounce rates drop below 4%.
Stop refilling a leaky bucket. Start filling it with the right customers.
FAQ
Is 10% monthly churn bad?
For a pre-PMF startup under $1M ARR, 10% monthly is high but not unusual - the benchmark is around 8.2%. For a growth-stage company above $5M ARR, 10% monthly compounds to roughly 72% annual churn, which signals a serious retention problem that needs immediate attention.
How do I calculate churn rate?
Customer churn = customers lost during a period / customers at the start of that period. To convert monthly to annual: Annual churn = 1 - (1 - monthly rate)^12. A 5% monthly rate equals 46% annual churn, not 60%.
What is negative churn?
Negative churn means expansion revenue from existing customers exceeds revenue lost from cancellations and downgrades. If your NRR is above 100%, you have negative net revenue churn. Top-quartile B2B SaaS companies hit 120%+ NRR, meaning their existing base grows 20% annually before a single new deal closes.
Can bad prospect data increase churn?
Yes. Poor-fit signups from inaccurate outbound lists churn 3-4x faster than well-targeted accounts. Cleaning up your data at the source - verifying emails, confirming job titles, filtering for ICP fit - reduces the ghost signups that inflate early-stage churn numbers.