Click Rate Calculator: Find Your CTR and Know If It's Good
Your dashboard says 3.2% CTR. Five sources give you five different "average" numbers ranging from 0.35% to 6.66%. That spread isn't helpful - it's noise.
This click rate calculator gives you the number AND tells you what it means.
What You Need (Quick Version)
- CTR formula: (Clicks / Impressions) x 100 - use the calculator below.
- "Good" CTR depends on channel: 6.66% for Google Search Ads, 1.7% for Facebook Ads, 2.6-6.2% for email.
- If your CTR is below benchmark, check three things first: your denominator definition, your data quality, and your targeting - not your copy.
CTR Calculator
Enter your numbers to get your click-through rate instantly. Whether you're calculating click-through rate for email campaigns or paid ads, both modes below work.
Standard mode: Plug in your clicks and impressions to get CTR.
Reverse mode: Enter your target CTR and impressions to find how many clicks you need.
Worked example: 150 clicks / 5,000 impressions = 3.0% CTR. Running Google Search Ads? That's below the 6.66% average - time to dig into ad copy and targeting. Running display ads? 3.0% is outstanding.
What Is Click-Through Rate?
Click-through rate measures how often people click after seeing your ad, email, or search listing:
CTR = (Clicks / Impressions) x 100
The tricky part is that "impressions" means different things depending on the channel. In Google Ads, it's ad impressions. In email, it's emails delivered - not sent. In organic search, it's search appearances. Same formula, different denominators, wildly different benchmarks.
Here's the thing: CTR without conversion rate context is a vanity metric. A 10% CTR that converts at 0.1% is worse than a 2% CTR that converts at 5%. Always pair CTR with what happens after the click.
CTR Benchmarks by Channel (2026 Data)
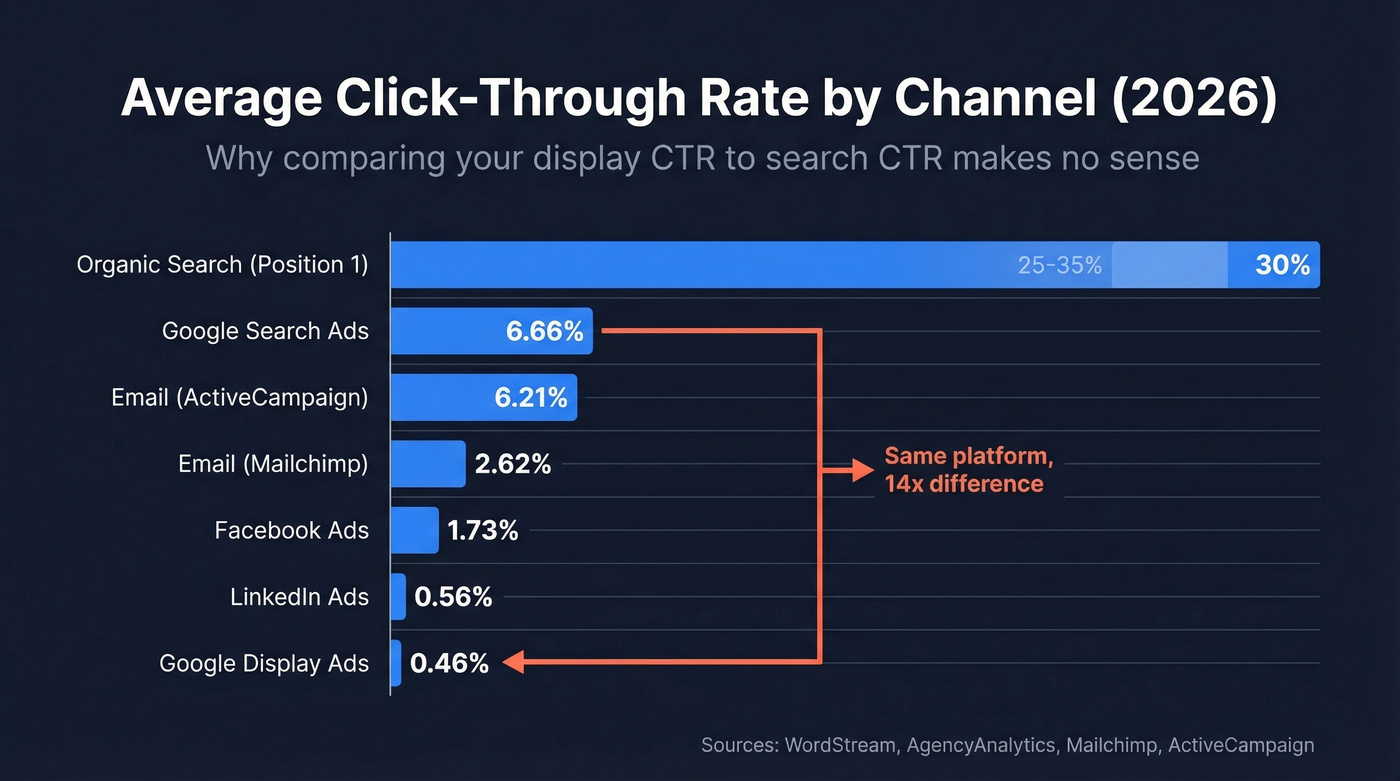
Comparing your display ad CTR to a search ad benchmark is like comparing your 5K time to Usain Bolt's 100m - technically both involve running, but the comparison is meaningless. Here are the numbers that actually matter, drawn from the most recent benchmark studies.
| Channel | Average CTR | Source |
|---|---|---|
| Google Search Ads | 6.66% | WordStream |
| Google Display Ads | 0.46% | StoreGrowers |
| Facebook Ads | 1.73% | AgencyAnalytics |
| LinkedIn Ads | 0.56% | AgencyAnalytics |
| Email (Mailchimp) | 2.62% | Mailchimp |
| Email (ActiveCampaign) | 6.21% | ActiveCampaign |
| Organic Search (#1) | 25-35% | Typical CTR curve |
For organic search, position #1 earns roughly 25-35% CTR, dropping to 15-20% for position #2 and under 10% for positions 3+. Those position-one numbers are the prize worth chasing if you're investing in SEO.
Google Ads CTR by Industry
WordStream's benchmark report - covering 16,000+ campaigns from April 2024 through March 2025 - remains the gold standard for Google Ads CTR data. The top performers:
| Industry | Search CTR |
|---|---|
| Arts & Entertainment | 13.10% |
| Shopping / Gifts | 8.92% |
| Travel | 8.73% |
| Finance & Insurance | 8.33% |
| Dentists & Dental | 5.44% |
Overall CTR increased 3.74% year-over-year across the dataset. That's a meaningful shift - responsive search ads and improved audience targeting are lifting the floor for everyone. The sample size and methodology in this report are transparent, which is more than most recycled benchmark posts can claim.
Facebook Ads CTR
Facebook CTR varies dramatically based on industry, campaign objective, and placement. Focus Digital's dataset across 16 industries breaks all three down.
| Industry | Facebook CTR |
|---|---|
| Arts & Entertainment | 2.64% |
| Real Estate | 2.60% |
| eCommerce | 1.75% |
| SaaS | 1.12% |
| Finance & Insurance | 0.85% |
Campaign objective matters even more than industry. Lead Generation campaigns average 2.53% CTR - nearly 3x Brand Awareness at 0.94%. Traffic campaigns land at 1.57%, Conversions at 1.38%. On placement, Facebook Feed sits at 1.11% and Instagram Stories hit 1.34%. The right column sits at 0.41%. Skip it unless you're optimizing for reach on a shoestring.
Email Click Rate Benchmarks
Email benchmarks are the messiest because platforms define and measure CTR differently. Use an email CTR calculator alongside these benchmarks to see where your campaigns land.
| Industry | Mailchimp CTR | ActiveCampaign CTR |
|---|---|---|
| Overall | 2.62% | 6.21% |
| Business & Finance | 2.78% | 4.40% |
| eCommerce / Retail | 1.74% | 5.07% |
| Software | - | 6.67% |
Mailchimp's data, last refreshed in December 2023, comes from billions of emails across campaigns with 1,000+ subscribers. ActiveCampaign published their 2025 dataset in January 2026 and reports click rates across campaigns sent throughout 2025.
The gap between 2.62% and 6.21% isn't a typo. Different platforms attract different audiences and use different measurement approaches, so cross-reference both when setting targets and weight toward whichever customer profile matches yours.
Your email CTR benchmark is meaningless if half your emails bounce. Prospeo's 98% email accuracy and 5-step verification cut bounce rates below 4% - so every impression in your CTR denominator is a real person who received your message.
Stop calculating CTR on emails that never arrived.
CTR vs CTOR: The Metric Teams Confuse
This exact debate plays out regularly on r/Emailmarketing: one person says email CTR equals clicks divided by emails sent, another says it's clicks divided by opens. They're both right - they're just measuring different things, and the confusion causes real reporting problems. Understanding when to use a click-to-open rate calculator versus a standard CTR tool is the first step to fixing your reporting.
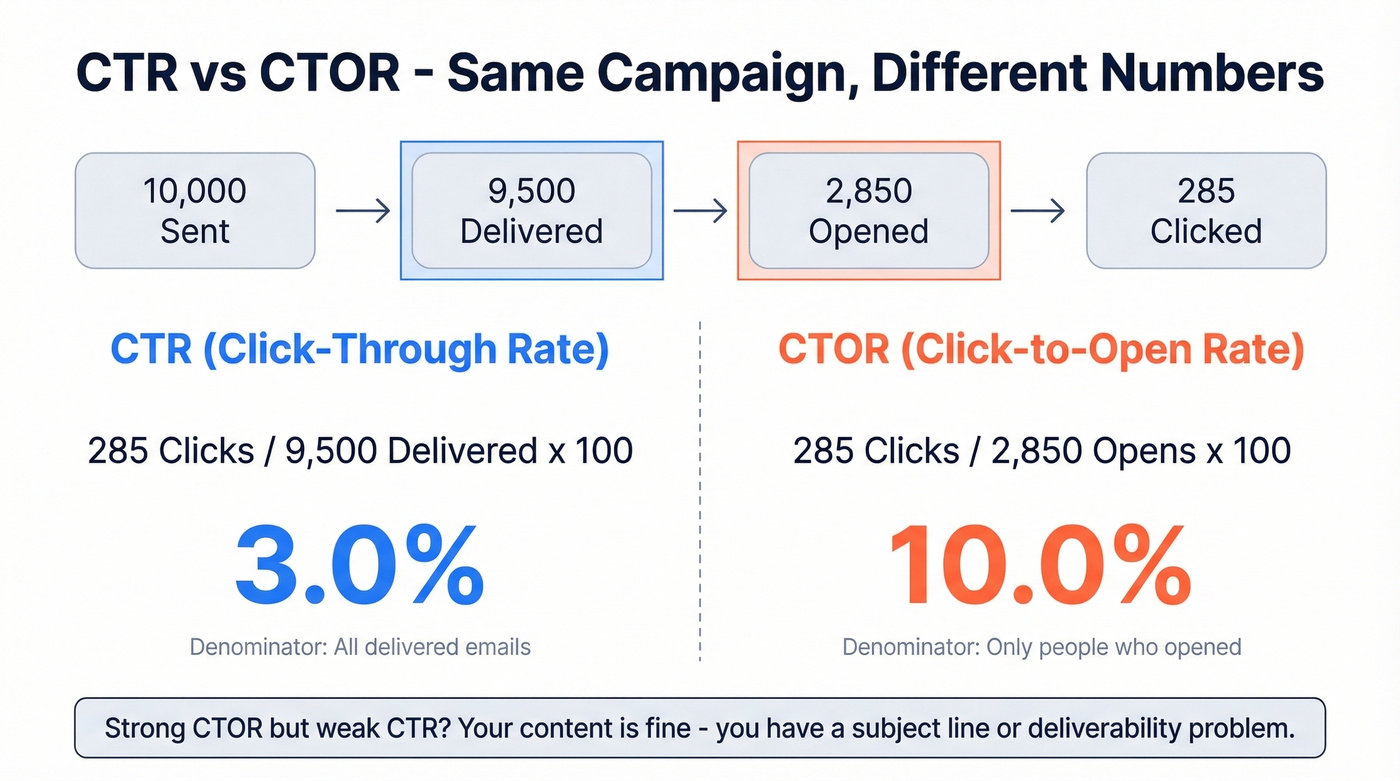
CTR = Unique Clicks / Emails Delivered x 100
CTOR (Click-to-Open Rate) = Unique Clicks / Unique Opens x 100
Say you send 10,000 emails. 9,500 get delivered. 2,850 get opened. 285 people click. Your CTR is 3.0% (285 / 9,500). Your CTOR is 10.0% (285 / 2,850). Same campaign, same clicks, very different numbers.
In our experience, the denominator confusion is the #1 reason teams misreport CTR. Always use "unique" clicks too - if one person clicks your link three times, that's one unique click, not three. Counting total clicks inflates your numbers and makes A/B comparisons unreliable.
Quick benchmarks to keep in your back pocket: cold email CTR runs 1-5%, marketing email CTR 2-10%. For CTOR, cold email lands at 10-20%, marketing email at 15-30%. Strong CTOR but weak CTR? You've got a subject line or deliverability problem - the content's fine, but not enough people are opening.
Common CTR Calculation Mistakes
Wrong denominator. An affiliate marketer on r/AffiliateMarket watched their CTR swing from 45% to 6% depending on whether they used reach or unique users as the denominator. That's not a rounding error - that's a completely different metric. Define your denominator before you calculate anything.
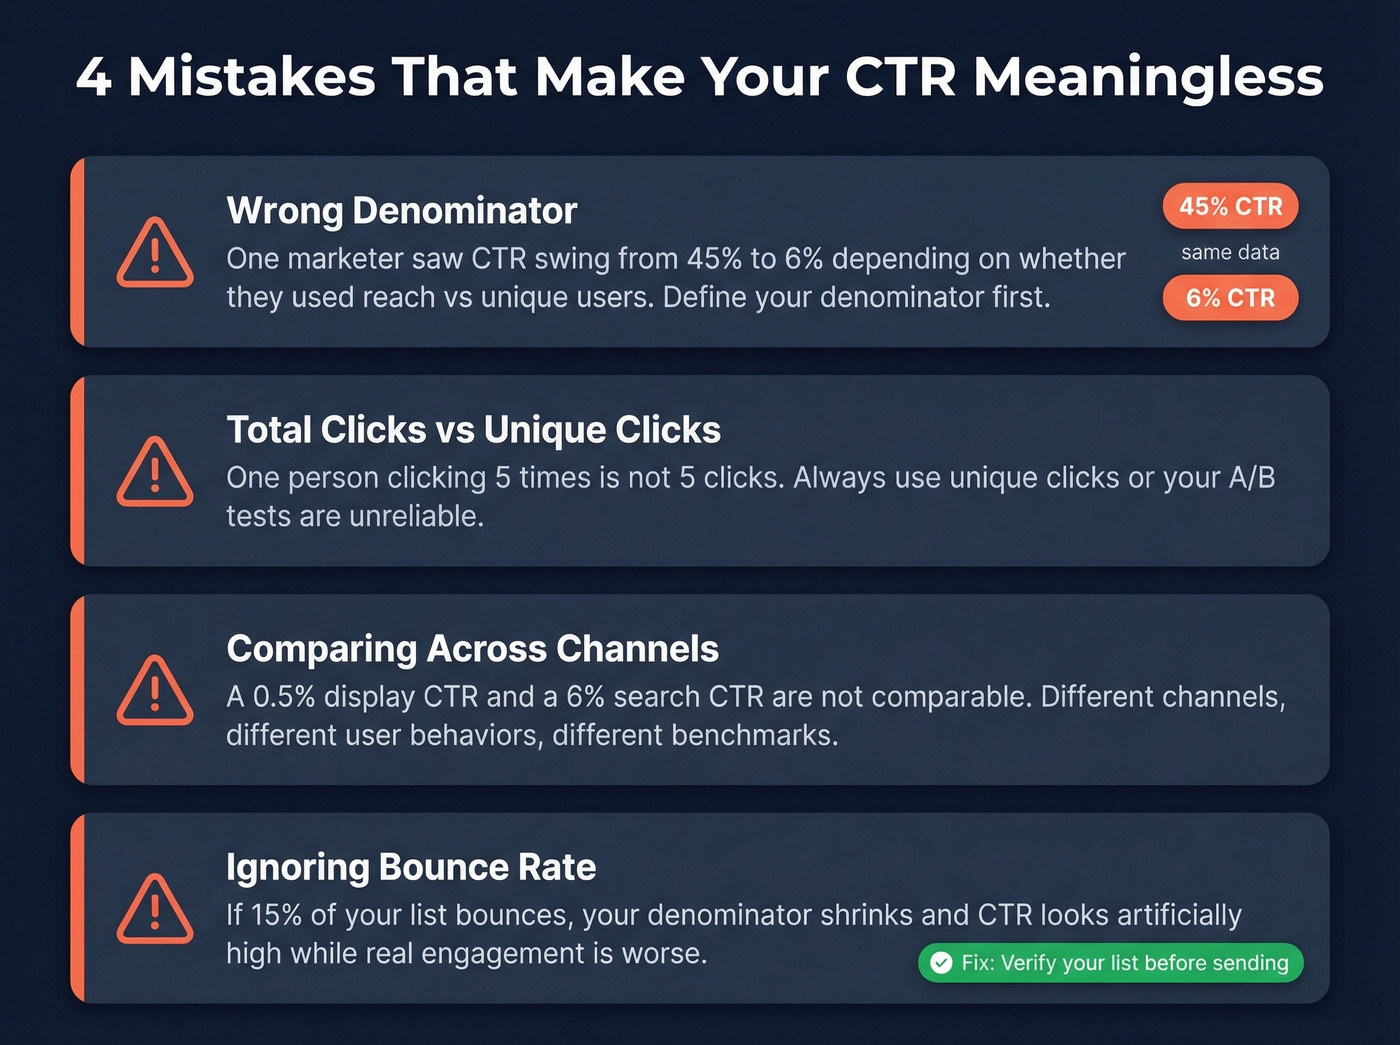
Total clicks vs unique clicks. Counting the same person twice or five times inflates your CTR and makes every comparison meaningless. Always use unique clicks unless you have a specific reason not to.
Comparing across channels. Display ads, search ads, and email operate in different universes. A 0.5% display CTR and a 6% search CTR aren't comparable - they're measuring fundamentally different user behaviors.
Ignoring bounce rate's effect on your denominator. If 15% of your email list bounces, your "delivered" count shrinks and your CTR looks artificially high while actual engagement is worse than you think. Verifying your list before sending - with a tool like Prospeo's email verification - catches invalid addresses before they inflate your bounce rate and distort your metrics.
Is Your CTR Change Real?
That A/B test showed Variant B winning by 0.3 percentage points. Worth celebrating? Probably not.
Three numbers determine whether a CTR test means anything: confidence level (use 95%), statistical power (use 80%), and minimum detectable effect - the smallest CTR change you actually care about. If your sample size is too small to detect the effect you're measuring, your "winner" is just noise.
Look, most marketers skip this step entirely. Two free tools make it painless: the CommonMind A/B test calculator (has a dedicated CTR mode with selectable confidence levels) and the CXL calculator (better for pre-test sample size planning). Run your numbers through one of these before making any decisions.
How to Improve Your CTR
Not all tactics move the needle equally. Here's what actually works, in rough order of impact.
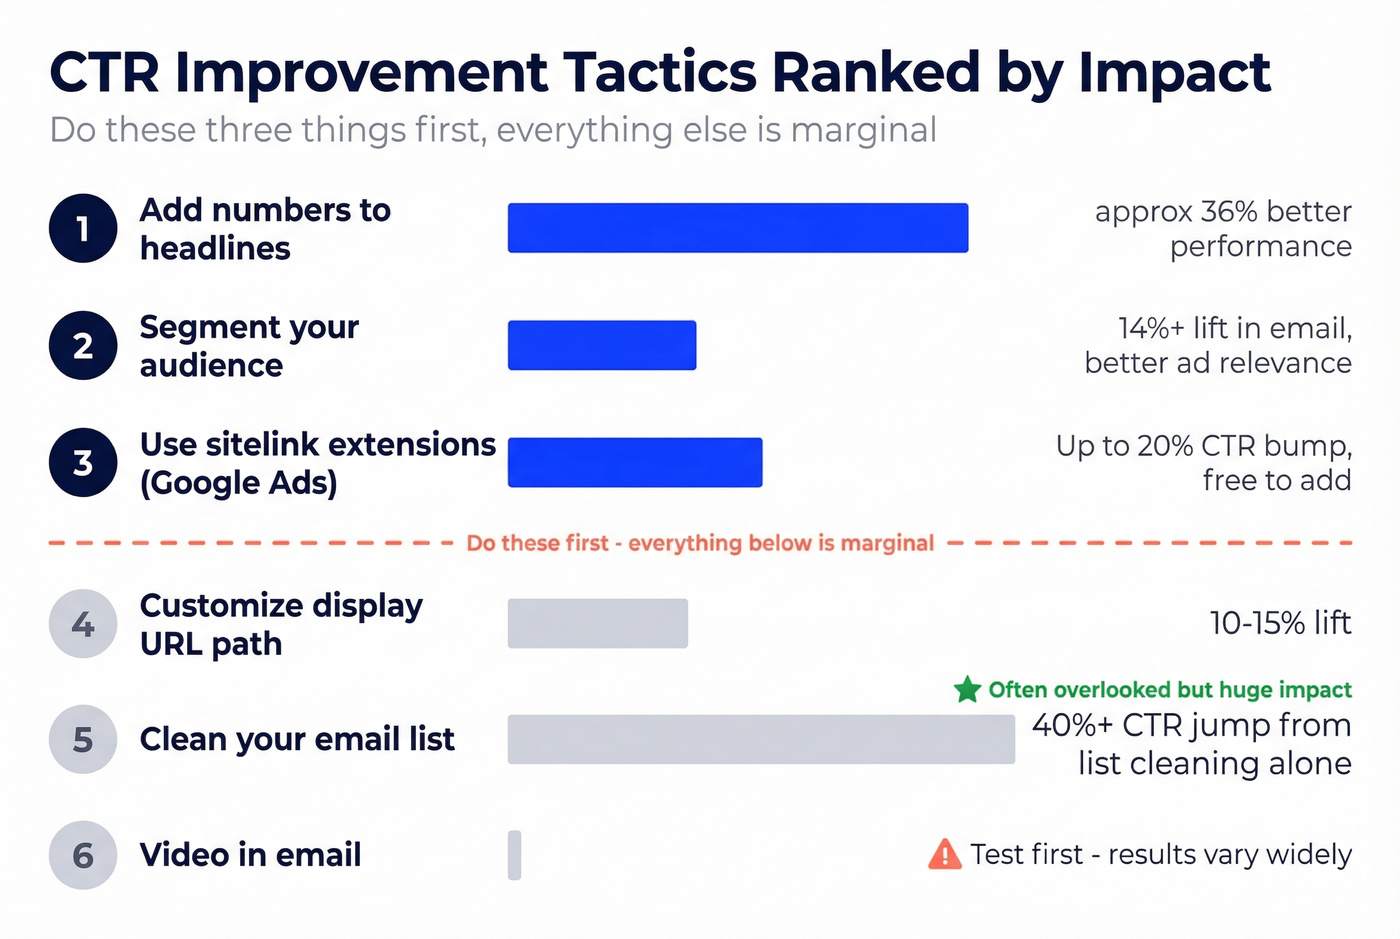
Add numbers to headlines. Headlines with numbers perform ~36% better than those without. This works across Google Ads, email subject lines, and organic titles. If you make one change today, make it this one.
Use sitelink extensions in Google Ads. I've seen sitelinks bump CTR by up to 20%. They're free, they take five minutes to set up, and if you're running search ads without them, you're leaving clicks on the table.
Segment your audience. Here's my hot take: most low CTRs aren't a creative problem - they're a targeting problem. Sending the same message to everyone is the fastest way to tank your numbers. Segmentation lifts CTR by 14%+ in email and improves ad relevance scores across paid channels. Before you rewrite a single headline, ask whether the right people are seeing it in the first place.
Skip video embeds in email unless you've tested them with your specific audience. The "200-300% CTR increase" stat gets thrown around a lot, but those results come from specific B2C contexts. For most B2B senders, a clean text email with one clear CTA outperforms a media-heavy design.
For Google Ads specifically, customizing the display URL path with relevant keywords can lift CTR 10-15%. Small change, strong signal of relevance.
If you only do three things: add numbers to your headlines, use sitelink extensions, and segment your audience. Everything else is marginal.
Fix Your Email Data First
The fastest way to improve email CTR isn't better copy - it's cleaner data. We've seen email CTR jump 40%+ just from list cleaning, before touching a single subject line. Stack Optimize built their agency to $1M ARR by keeping client deliverability at 94%+, bounce rates under 3%, and zero domain flags - all powered by verified contact data.

Strong CTOR but weak CTR usually means a deliverability problem. Teams using Prospeo's verified contact data see bounce rates drop from 35%+ to under 4% - which means more delivered emails, more opens, and a CTR that reflects your actual content quality.
Fix the denominator before you rewrite the subject line.
FAQ
What's a good CTR?
For Google Search Ads, a good CTR is 6%+. For Facebook Ads, aim for 1.5%+. For email, 3-6% is solid. These vary by industry - check the benchmark tables above for your specific channel and vertical.
How do I calculate email CTR?
Divide unique clicks by emails delivered (not sent), then multiply by 100. If you divide by unique opens instead, you're calculating CTOR (click-to-open rate) - a different metric that's typically 3-5x higher. The email click-through rate calculator at the top handles both.
What's the difference between CTR and CTOR?
CTR uses delivered emails as the denominator. CTOR uses unique opens. Same clicks, different denominators, very different numbers. Use CTR to measure overall campaign reach; use CTOR to measure content engagement among people who actually opened.
Does CTR affect Quality Score?
Yes. In Google Ads, expected CTR is one of three Quality Score components alongside ad relevance and landing page experience. Higher CTR typically improves Quality Score, which lowers your cost per click. Aim for "Above Average" expected CTR status.
How does cleaner data improve email CTR?
Invalid addresses inflate bounces and distort every downstream metric. Verifying your list before sending - removing catch-alls, spam traps, and honeypots - typically cuts bounce rates below 3%. Cleaner denominators mean your CTR reflects real engagement, and deliverability improvements alone can lift click rates 40%+.