CRM Reporting: What to Track, What "Good" Looks Like, and Why Your Reports Are Probably Wrong
It's Monday morning. The VP of Sales asks for the pipeline number. You pull it up - $2.1M. Except $500K of that vanished over the weekend because three reps finally updated deals they'd been ignoring for weeks. The real number is $1.6M, and the forecast deck you sent to the board on Friday is wrong.
This is CRM reporting for most teams. Not a decision engine - a data graveyard that occasionally produces a number everyone pretends to trust. One Reddit user nailed it: the data is "everywhere and nowhere at the same time," and spreadsheets stop scaling the moment your team hits double digits. The downstream cost is real: 69% of B2B sales reps missed quota in 2025, and a big chunk of that traces back to teams making decisions on data that doesn't reflect reality.
CRM reporting is the practice of extracting structured data from your CRM - deals, activities, contacts, outcomes - and turning it into reports and dashboards that help revenue teams forecast accurately, coach effectively, and spot problems before they become quarterly misses. The practical definition is simpler: it's the difference between knowing your pipeline and guessing at it.
What You Need (Quick Version)
Three things separate a useful reporting system from expensive noise:
Track 10-12 reports, not 34. Zendesk lists 34 CRM report types and ideas. You don't need all of them. Most teams need a curated set that covers pipeline health, rep performance, forecasting, and customer retention.
Know your benchmarks. Win rate should sit at 20-30% (35-40% for best-in-class). Pipeline coverage needs to be 3x minimum. Lead response under 5 minutes converts 8-21x higher. If you don't know these numbers for your team, your reports are decoration.
Fix your data before you fix your dashboards. 76% of CRM users say less than half their data is accurate and complete. No dashboard design can compensate for garbage inputs. Only 20% of small business owners even look at reporting weekly - and bad data is a big reason why.
Reports vs. Dashboards
These terms get used interchangeably, but they serve different purposes. Getting this wrong means building the wrong thing for the wrong audience.
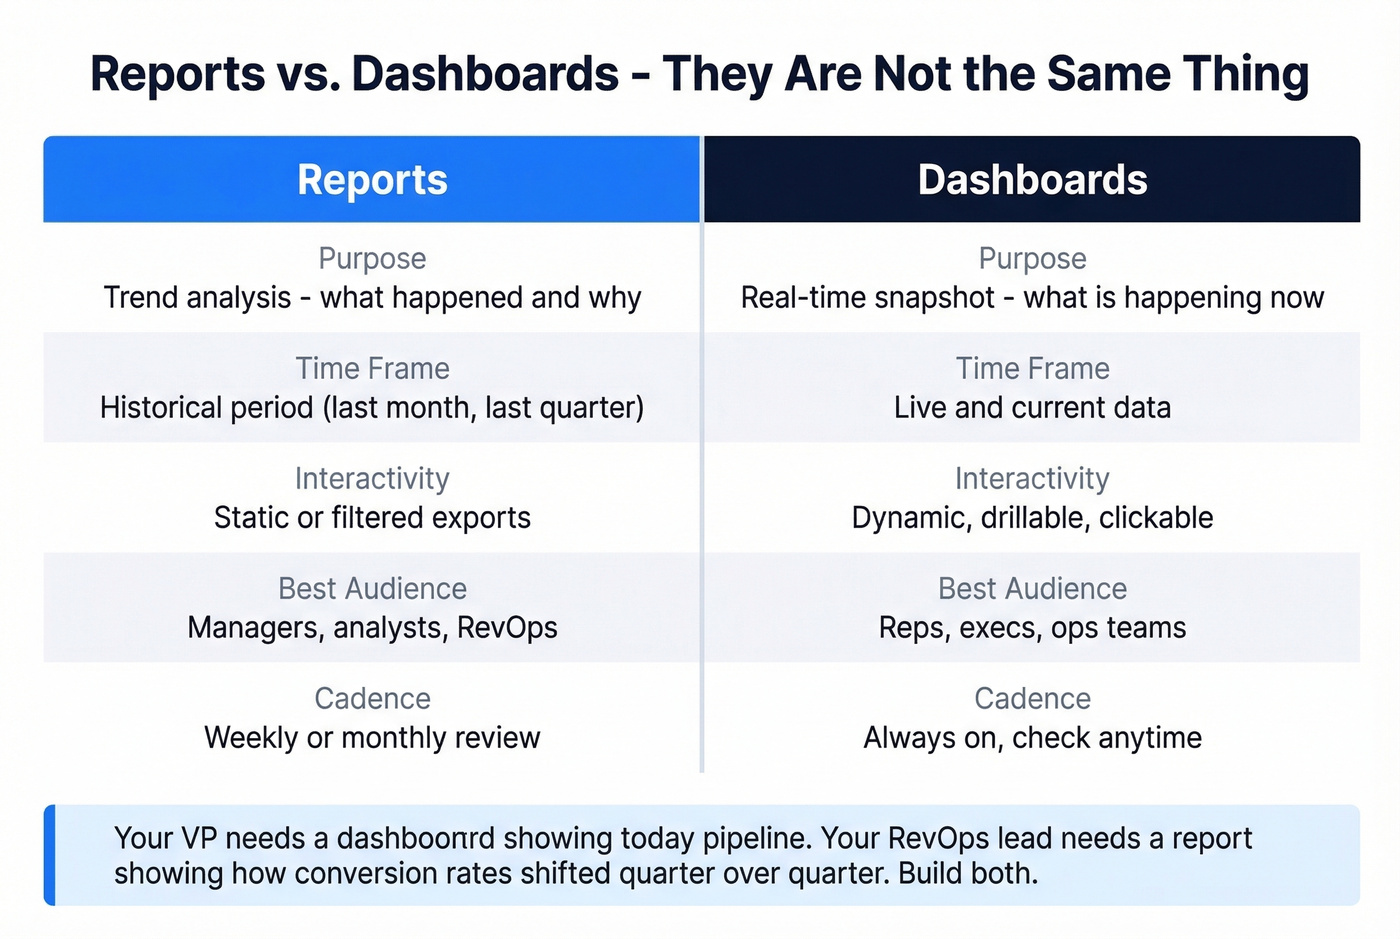
| Feature | Report | Dashboard |
|---|---|---|
| Purpose | Trend analysis | Real-time snapshot |
| Time frame | Historical period | Live / current |
| Interactivity | Static or filtered | Dynamic, drillable |
| Audience | Managers, analysts | Reps, execs, ops |
| Cadence | Weekly / monthly | Always on |
Reports answer "what happened and why." Dashboards answer "what's happening right now." Your VP needs a dashboard showing today's pipeline. Your RevOps lead needs a report showing how stage conversion rates shifted quarter over quarter. Build both, but don't confuse them.
10 Essential CRM Reports
You could build dozens of reports. Don't. Start with these ten, organized by function, and add complexity only when you've mastered the basics.
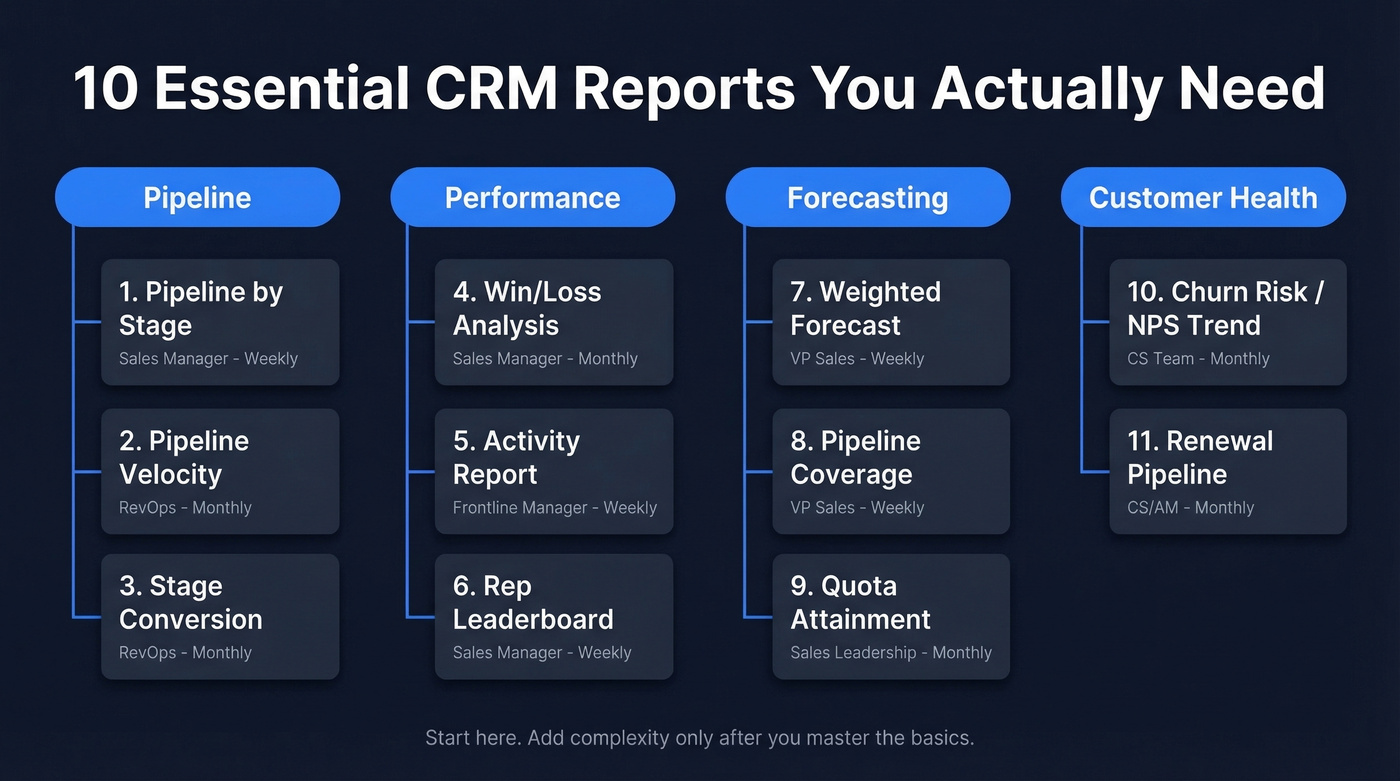
Pipeline Reports
Pipeline by Stage answers the most basic question: how much is in each stage right now, and is it enough? Owned by the sales manager, reviewed weekly. If your mid-funnel stages are bloated with stale deals, this report shows it immediately.
Pipeline Velocity measures how fast deals move through stages. It combines deal count, average deal size, win rate, and sales cycle length into a single speed metric. Owned by RevOps, reviewed monthly. Slowing velocity is an early warning signal that something's broken - pricing objections, competitive pressure, or reps sandbagging. We've seen teams ignore this metric for an entire quarter and then scramble when the forecast collapses in month three.
Stage Conversion tracks drop-off between stages. Zendesk's example data shows 53.85% of deals reaching contract negotiations - meaning nearly half fall out before the finish line. If your conversion craters at a specific stage, that's where coaching and process fixes should focus.
Performance Reports
Win/Loss Analysis breaks down closed deals by reason, competitor, segment, and rep. Owned by the sales manager, reviewed monthly. This is where you learn whether you're losing on price, product gaps, or poor discovery - and which reps consistently win against specific competitors.
Activity Report tracks calls, emails, meetings, and demos per rep. Weekly cadence, owned by frontline managers. It's not about micromanagement - it's about correlating activity volume with outcomes. If a rep books 40 meetings and closes nothing, the problem isn't effort.
Rep Leaderboard ranks reps by revenue, win rate, or pipeline generated. Use it for coaching, not public shaming. The best managers use leaderboards to identify what top performers do differently, then replicate it across the team.
Forecasting Reports
Weighted Forecast multiplies deal value by stage probability to produce a realistic revenue projection. Owned by the VP of Sales, reviewed weekly during the quarter. Without this, you're guessing at the board meeting.
Pipeline Coverage compares total pipeline to quota target. The benchmark is 3x minimum - if you need to close $1M, you need $3M in pipe. Below 3x and you're in trouble. Below 2x and the quarter is already lost.
Quota Attainment tracks each rep's progress against target. Monthly cadence, owned by sales leadership. This is the report that triggers mid-quarter interventions - territory reassignments, deal support, or uncomfortable conversations.
Customer Health Reports
Churn Risk / NPS Trend tracks satisfaction scores and usage patterns for existing customers. A declining NPS score three months before renewal is a signal you can act on. A declining NPS score the week of renewal is a postmortem.
Renewal Pipeline tracks upcoming renewals by value, risk score, and owner. Renewal pipeline is revenue too - often the majority of it for mature SaaS companies - and most teams don't report on it with anywhere near the rigor they apply to new business. If your reports ignore renewals, you're ignoring half the revenue equation.
Benchmarks That Matter
Numbers without context are useless. Here's what "good" actually looks like, based on aggregated industry benchmarks from Ebsta & Pavilion's B2B Sales Benchmarks research.
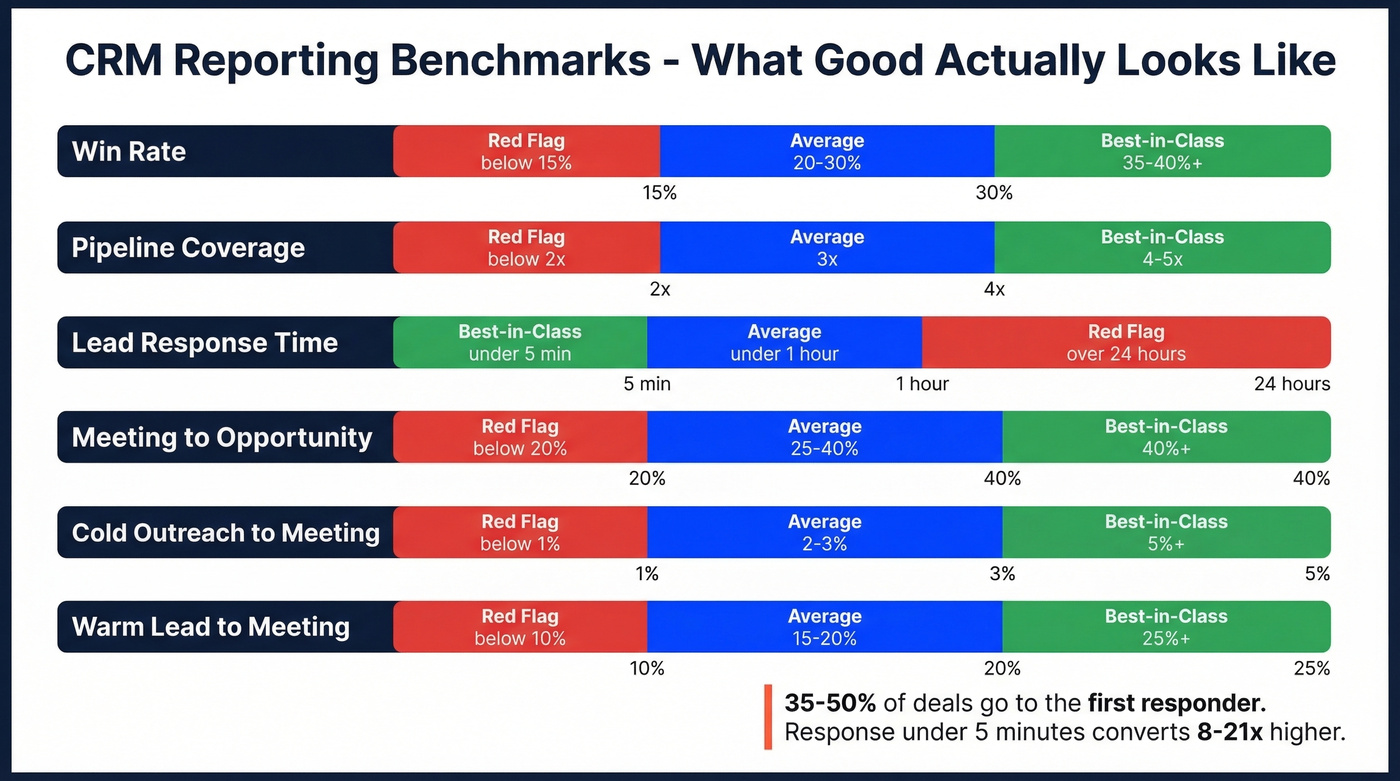
| Metric | Average | Best-in-Class | Red Flag |
|---|---|---|---|
| Win rate | 20-30% | 35-40%+ | Below 15% |
| Pipeline coverage | 3x | 4-5x | Below 2x |
| Lead response | < 1 hour | < 5 minutes | > 24 hours |
| Meeting to opp | 25-40% | 40%+ | Below 20% |
| Cold to meeting | 2-3% | 5%+ | Below 1% |
| Warm to meeting | 15-20% | 25%+ | Below 10% |
The lead response number deserves special attention. 35-50% of deals go to the first responder, and conversion rates are 8-21x higher when response time drops below five minutes. If your report shows average lead response above an hour, that's not a reporting problem - it's a revenue leak.
Pipeline coverage below 3x means you don't have enough deals to absorb normal attrition. If your win rate is also below 20%, you need 5x coverage just to hit target. I've watched teams build beautiful forecast dashboards that mask this fundamental math problem. The dashboard looks green, but the quarter ends red.
Let's be honest: most teams don't track these CRM metrics at all. They track revenue and activity, skip the conversion metrics in between, and then wonder why forecasts are off by 30%. Start with win rate and pipeline coverage. Everything else is refinement.
76% of CRM users say less than half their data is accurate. That's not a reporting problem - it's a data problem. Prospeo enriches your CRM with 50+ data points per contact at a 92% match rate, refreshed every 7 days. Clean inputs, reliable reports.
Stop building dashboards on top of bad data.
Why Your CRM Reports Lie
The reports aren't the problem. The data is.
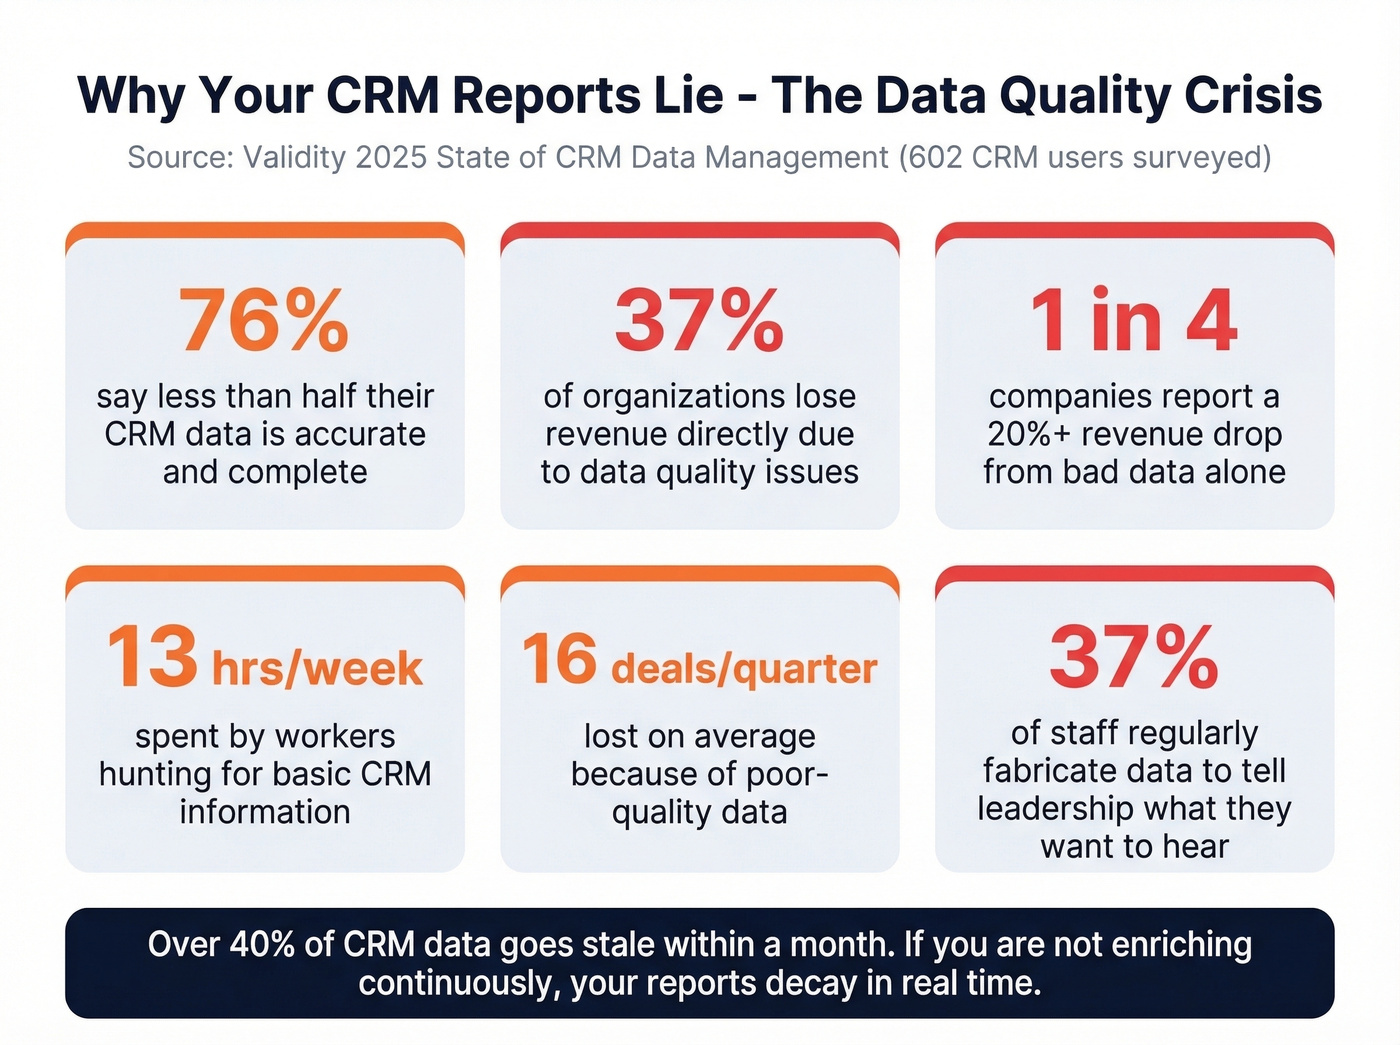
Validity's 2025 State of CRM Data Management report surveyed 602 CRM users and admins across the U.S., U.K., and Australia. The findings are brutal: 76% of CRM users say less than half their data is accurate and complete. 37% of organizations lose revenue directly due to data quality issues. One in four companies report a 20%+ drop in annual revenue from bad data alone.
Workers spend 13 hours per week hunting for basic CRM information. Companies lose an average of 16 deals per quarter because of poor-quality data. And here's the stat that should terrify every sales leader: 37% of staff regularly fabricate data to tell leadership what they want to hear. Your pipeline report isn't just inaccurate - parts of it are fiction.
The problem is getting worse. Only 18% of organizations without a dedicated CRM data quality owner plan to hire one in the next 12 months - a 56% drop from 2024.
The consensus on r/CRM mirrors this perfectly. Duplicate records, inconsistent contact details, inactive clients mixed with active ones - "reports that no longer reflect reality." As one practitioner put it: "tools themselves are solid - the challenge is ongoing data discipline."
Over 40% of CRM data goes stale within a month. Contacts change jobs, companies get acquired, phone numbers rotate. If you're not actively enriching and verifying your data, your reports decay in real time.
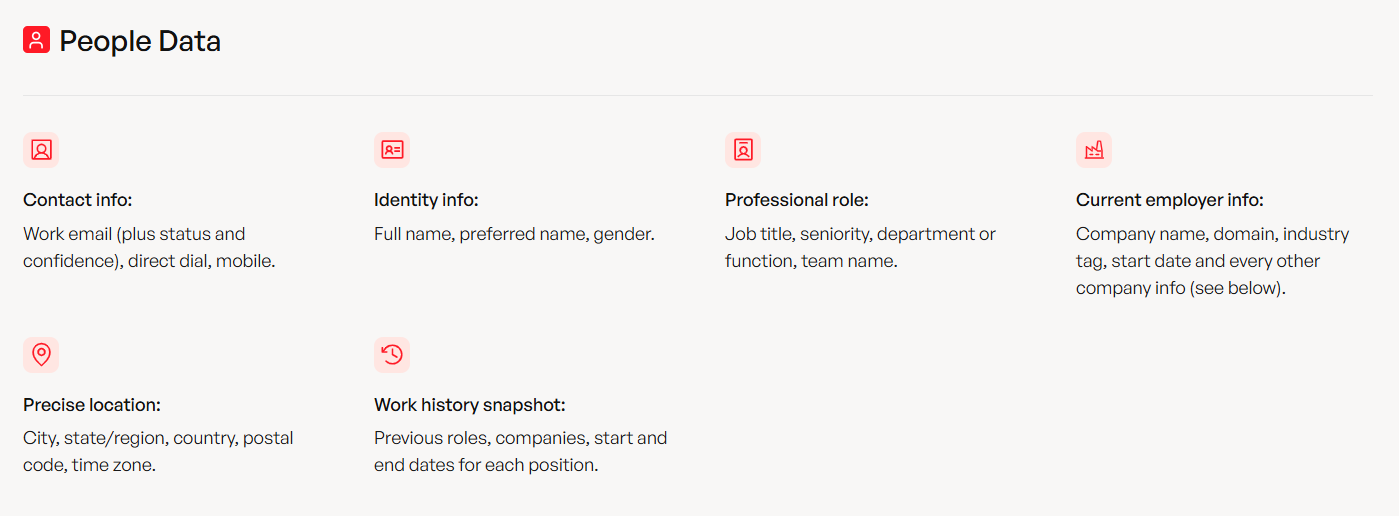
This is where automated enrichment changes the equation. Prospeo plugs directly into Salesforce and HubSpot, enriching CRM records with 50+ verified data points per contact - emails verified to 98% accuracy on a 7-day refresh cycle, versus the 6-week industry average. Instead of running a manual cleanup twice a year and hoping for the best, you get continuous data hygiene that keeps reports honest between audits.
Role-Based Dashboards
Not everyone needs the same reports. A rep drowning in executive-level forecast data is just as unproductive as a CRO squinting at individual activity logs. The cognitive load limit for dashboards is 5-7 reports - beyond that, people stop processing the information.
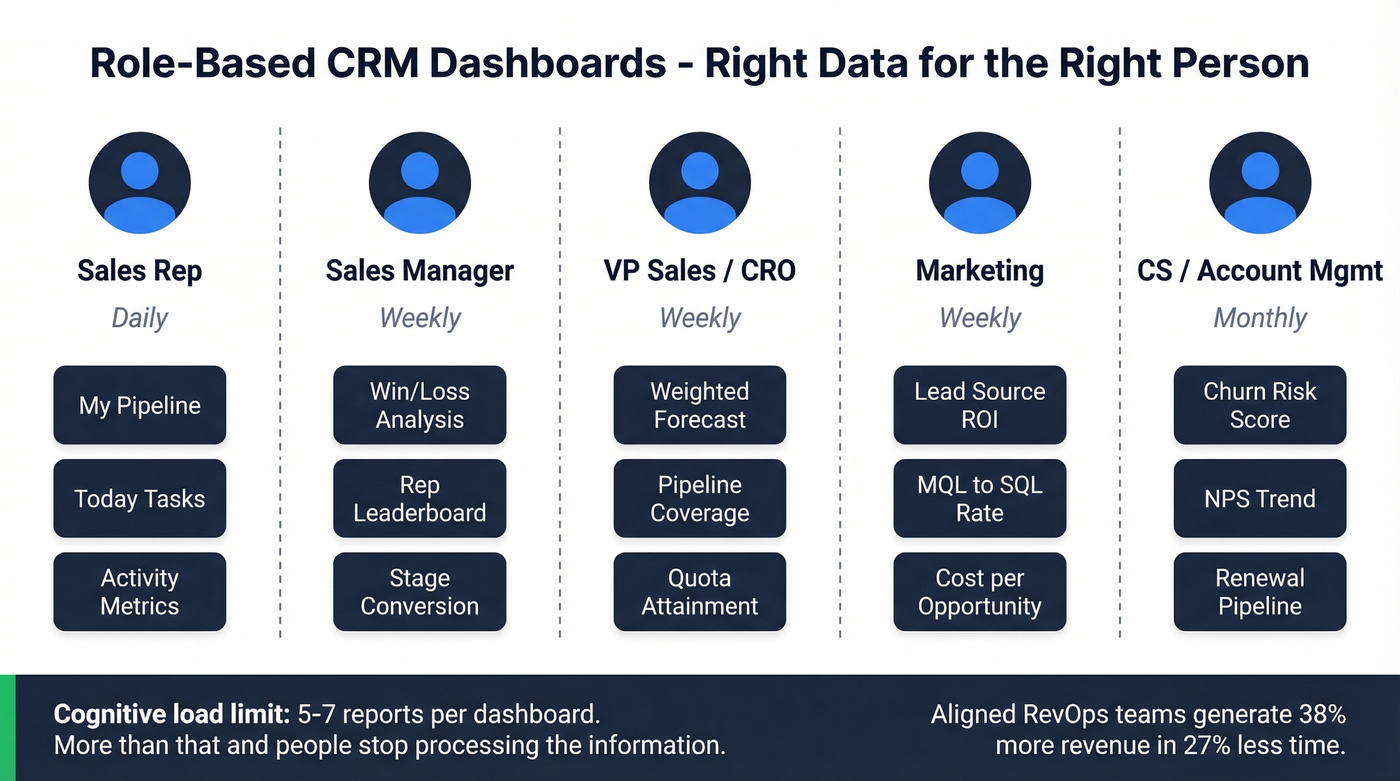
Companies with aligned RevOps functions generate 38% more revenue in 27% less time. Structured reporting is the connective tissue that makes alignment possible, but only if each role sees the right data.
| Role | Key Reports | Cadence | Primary Metrics |
|---|---|---|---|
| Sales Rep | Activity, pipeline | Daily | Calls, meetings, opp created |
| Sales Manager | Win/loss, leaderboard | Weekly | Win rate, conversion, quota |
| VP Sales / CRO | Forecast, coverage | Weekly | Revenue, coverage, velocity |
| Marketing | Lead source, conversion | Weekly | MQL to SQL, cost per opp |
| CS / AM | Churn risk, NPS, renewal | Monthly | NRR, CSAT, expansion |
Build separate dashboards per role. A rep's daily view should show their pipeline, today's tasks, and activity metrics - nothing else. A CRO's weekly view should show weighted forecast, pipeline coverage, and quota attainment across the team. When you try to build one dashboard for everyone, you end up with something nobody uses.
AI-Powered Reports in 2026
Every CRM vendor is shipping AI features. Some are genuinely useful. Most are still early.
Salesforce Einstein is the most mature. It scores leads, predicts deal outcomes, flags at-risk opportunities, and generates forecast models. The catch: advanced Einstein add-ons often start around $75/user/month, and the predictions are only as good as your historical data. If your CRM has two years of clean, consistently logged deal data, Einstein is powerful. If your data is messy, it'll confidently predict garbage.
Zoho Zia offers anomaly detection that flags unusual spikes or drops in metrics, best-time-to-contact recommendations, and workflow suggestions. Zoho CRM's Enterprise plan runs $40/user/month billed annually and includes Zia AI features. It's more practical than Einstein for mid-market teams - less configuration overhead, faster time to value.
Pipedrive's AI assistant focuses on deal recommendations and activity prioritization. monday CRM leans into AI-powered automation - auto-generating reports and triggering workflows based on deal stage changes. Both offer no-code report builders that let ops teams ship dashboards without developer time.
Look, here's the contrarian take everyone's dancing around: AI reporting is real and useful, but garbage in, garbage out still applies. Validity's data shows 45% of organizations say their CRM data isn't prepared for AI, yet 54% are already deploying generative AI tools. That's a recipe for confidently wrong predictions at scale. Fix the data first. Then turn on the AI.
Best Tools for Sales Reporting
The global CRM market was estimated at $73.4B as of 2024 and is growing at 14.6% annually through 2030, per Grand View Research. There's no shortage of options. Here are the six that matter most for reporting.
| Tool | Best For | Reporting Edge | Limitation | Starting Price |
|---|---|---|---|---|
| Salesforce | Enterprise | Einstein AI + Tableau | Needs dedicated admin | $25/user/mo |
| HubSpot | SMB / mid-market | Custom reports, attribution | Depth plateaus at scale | Free; custom reports from $100/seat/mo |
| Zoho CRM | Value + flexibility | Zia AI, deep customization | UI learning curve | Free; Enterprise $40/user/mo |
| monday CRM | Automated reporting | Drag-and-drop dashboards | Limited advanced analytics | $12/user/mo |
| Pipedrive | Small sales teams | Visual pipeline reports | No cross-object reporting | $24/user/mo |
| Dynamics 365 | Microsoft ecosystem | Power BI integration | Requires Power BI skills | $65/user/mo |
Salesforce
If you have the budget and the headcount to administer it, Salesforce is the reporting gold standard. Between native reports, Einstein AI, and embedded Tableau analytics, there's virtually nothing you can't build. The tradeoff is complexity - you'll need a dedicated admin or a consultant to build and maintain reports, and pricing scales fast once you move beyond the $25/user/month entry point to Enterprise ($150/user/month) or Unlimited ($300/user/month) where the real reporting power lives.
HubSpot
The best on-ramp for SMBs. The free CRM includes basic reporting that's genuinely usable, and custom reports, multi-touch attribution, and revenue analytics unlock at Professional tier ($100/seat/month and above). The limitation: reporting depth plateaus for complex, multi-entity orgs. If you're running a 200-person sales team with multiple business units, you'll outgrow it.
Zoho CRM
Here's a scenario: you want 80% of Salesforce's reporting power at 20% of the cost. That's Zoho. It offers near-total customizability, and Zia AI features are included at the Enterprise tier ($40/user/month billed annually) with anomaly detection and predictions. The UI takes some getting used to compared to HubSpot's polish, but the depth-to-price ratio is unmatched.
monday CRM
Reddit users in r/CRMSoftware specifically call out monday for solving the "I spend hours building the Monday morning deck" problem. Drag-and-drop dashboard builder, automated report distribution, and solid pipeline visibility starting at $12/user/month. It won't match Salesforce's analytical depth, but if your main pain is report creation time rather than report sophistication, monday solves the right problem.
Skip Pipedrive If You Need Depth
Built for small sales teams that want visual pipeline reporting without complexity. Starts at $24/user/month. The AI assistant helps prioritize deals, but don't expect multi-touch attribution or cross-object reporting. This is the right tool for a 5-person team that needs clean pipeline visibility and nothing more.
Dynamics 365
The obvious choice if you're already in the Microsoft ecosystem - and a poor one if you're not. Power BI integration gives you reporting capabilities that rival Salesforce, but only if your team knows Power BI. In our experience, teams that adopt Dynamics without existing Microsoft fluency spend more time learning the tooling than building reports.
Fix Your Reports in 7 Steps
Knowing the problem is step one. Here's the playbook for actually fixing it.
1. Define goals before building reports. The number one CRM implementation mistake is building before you know what you're solving. "Better reporting" isn't a goal. "Reduce forecast variance to under 15%" is. Without that clarity, you'll build a data dumpster - a place where information goes to die.
2. Audit and clean existing data. Schedule cleanups twice a year at minimum. Deduplicate records, remove inactive contacts, and standardize company names. If your CRM has three entries for "Microsoft" (Microsoft, Microsoft Corp, MSFT), your reports are already wrong.
3. Enrich stale records with automated tools. Manual cleanup catches what's broken. Automated enrichment prevents the next round of decay. Prospeo can bulk-verify emails and append direct dials across your entire CRM database, catching decay before it corrupts your next forecast.
4. Standardize field definitions and picklists. If "Discovery" means something different to every rep, your stage conversion report is meaningless. Lock down picklist values, define stage entry/exit criteria, and document them somewhere reps can actually find.
5. Build role-based dashboards with 5-7 reports max. Resist the urge to build one mega-dashboard. Each role gets their own view with only the reports that drive their decisions.
6. Automate recurring report distribution. If someone's manually building a pipeline deck every Monday, you've already lost. Every modern CRM can schedule and email reports automatically. Set it up once and reclaim those hours.
7. Review and iterate quarterly. Reports that made sense in Q1 might be irrelevant by Q3. Kill reports nobody opens, add reports for new priorities, and adjust benchmarks as your team matures.
Pipeline coverage below 3x? Your reports won't save a quarter that's already lost. Prospeo's 300M+ verified profiles with 30+ filters - buyer intent, funding, headcount growth - fill your pipeline with real prospects, not phantom deals.
Build the pipeline your forecast actually needs.
FAQ
What is CRM reporting?
CRM reporting is the process of pulling structured data from your CRM - deals, activities, contacts, and outcomes - and turning it into reports and dashboards that help revenue teams forecast, coach, and identify problems. Good reports turn raw sales data into decisions. Bad ones turn it into noise nobody trusts.
What's the difference between a report and a dashboard?
Reports analyze trends over defined time periods - think quarterly win rate analysis or monthly pipeline velocity. Dashboards show real-time snapshots of current metrics. Reports are for deep analysis and pattern recognition; dashboards are for daily monitoring. Most teams need both.
How often should I review CRM reports?
Reps should check activity reports daily. Managers should review pipeline and performance weekly. Executives should focus on forecasting and revenue reports monthly or quarterly. Schedule data cleanups twice a year minimum to keep the underlying data trustworthy.
What are the most important CRM metrics?
Start with four: win rate (20-30% average, 35-40% best-in-class), pipeline coverage (3x target minimum), lead response time (under 5 minutes for best results), and quota attainment. Master these before adding complexity - every other metric is a refinement of these fundamentals.
How do I fix inaccurate CRM data?
Audit for duplicates and stale records first. Standardize field definitions so "Discovery" means the same thing to everyone. Then layer in automated enrichment tools that verify emails and refresh data on a regular cycle, catching decay before it corrupts your next forecast. Manual cleanups alone aren't enough when 40%+ of data goes stale monthly.