Data Normalization: Database, ML, and ETL - One Term, Three Meanings
Your Q3 revenue dashboard says $2.4M. Finance says $2.1M. You spend two hours on a call before someone realizes the CRM stores revenue in USD while the ERP logs it in EUR, and neither system converts at the same rate.
That's a data normalization problem - but which kind?
The term means three completely different things depending on who you're talking to. A Reddit thread on r/dataengineering had a user begging for someone to "explain normalization like I'm a child" because they couldn't tell which meaning their textbook was using. Let's clear this up once.
What You Need (Quick Version)
| If you're a... | "Data normalization" means... | Jump to |
|---|---|---|
| Database developer / DBA | Structuring tables to kill redundancy (1NF - 3NF) | Database Normalization |
| Data scientist / ML engineer | Feature scaling so algorithms treat features equally | ML Feature Scaling |
| Data / analytics engineer | Standardizing formats across sources (dates, emails, addresses) | ETL Normalization |
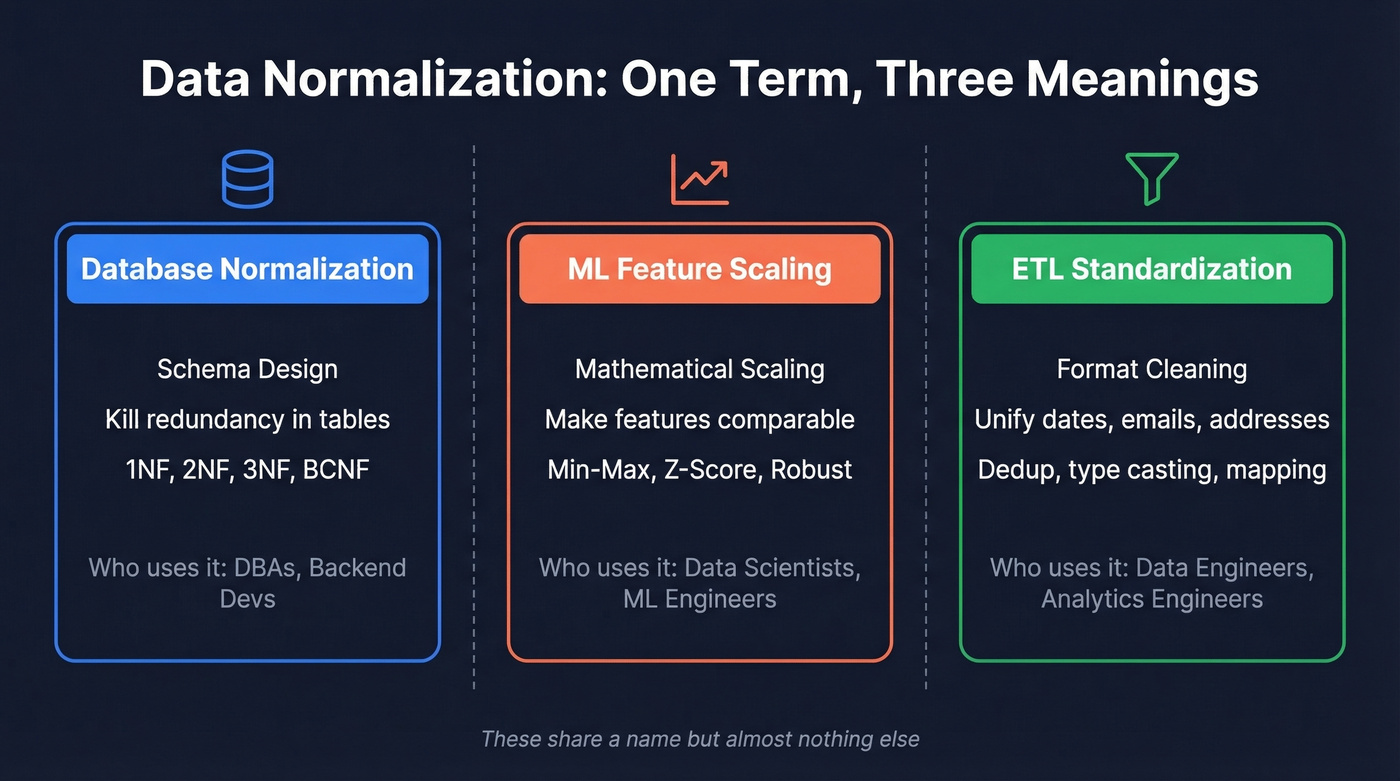
These three meanings share a word but almost nothing else. Database normalization is about schema design. ML normalization is about math. ETL normalization is about cleaning. The rest of this guide covers all three - with SQL, Python, and practical checklists - so you can stop conflating them.
Database Normalization (Schema Design)
Edgar F. Codd introduced the relational model in 1970, and database normalization has been a standard approach to schema design ever since. It's the process of structuring tables to eliminate redundancy and prevent data anomalies. If you've ever worked with a database where updating one customer's address required touching 47 rows, you've felt the pain this process solves.
Anomalies That Break Production
Unnormalized tables create three categories of problems. All of them will bite you in production.
Insert anomalies happen when you can't add data without unrelated data. Imagine you can't add a new product to your catalog until someone orders it - because products only exist inside the Orders table.
Update anomalies happen when the same fact is stored in multiple rows. A customer moves offices, and you update their address in 12 of 15 order rows. Now three rows have the old address. Your shipping team sends packages to both.
Delete anomalies happen when removing a record destroys unrelated data. Delete the last order for a customer, and suddenly you've lost their contact information entirely - because it only lived in the Orders table.
Here's the less obvious problem: unnormalized structures break analytics queries too. Take an Orders table where ProductCategory and Quantity are stored as comma-separated lists in a single cell. Try running GROUP BY ProductCategory on that. Your query either errors out or returns garbage, because SQL can't parse "Electronics, Books" as two separate categories without string manipulation hacks.
Normal Forms - 1NF Through BCNF
Let's walk through a single dataset - an Orders table - and progressively normalize it. This is the same approach Dataquest uses in their SQL normalization guide, and it's the clearest way to build intuition.
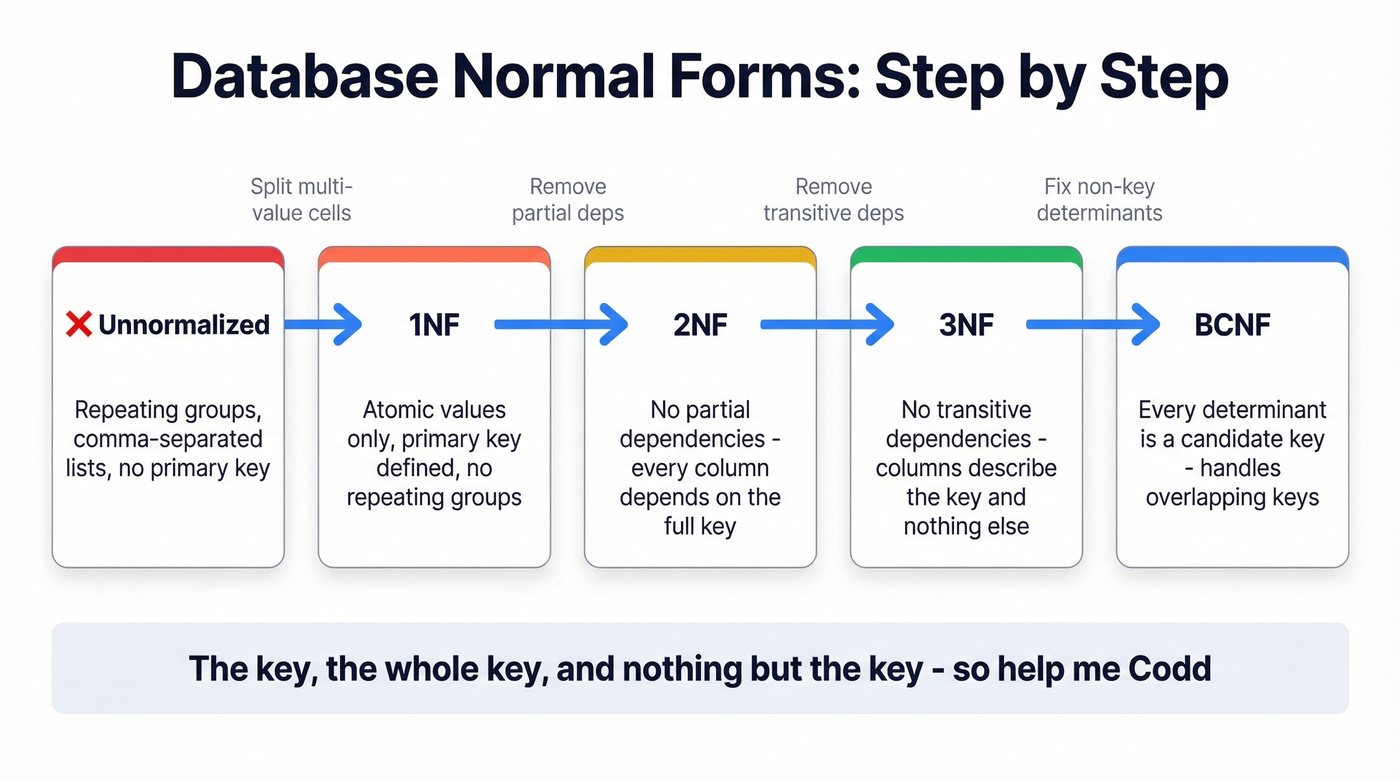
First Normal Form (1NF) is the baseline. Your table must satisfy four conditions:
- Row order doesn't convey meaning
- No mixed data types in a single column
- Every table has a primary key
- No repeating groups or lists in a cell
That last one catches most people. If your Orders table has a column called Products containing "Widget A, Widget B, Widget C" - that's not 1NF. Each product needs its own row.
-- Violates 1NF (comma-separated products)
CREATE TABLE orders_bad (
  order_id INT,
  customer_name VARCHAR(100),
  products VARCHAR(500)  - "Widget A, Widget B"
);

-- 1NF: one product per row
CREATE TABLE orders_1nf (
  order_id INT,
  product_id INT,
  customer_name VARCHAR(100),
  customer_city VARCHAR(100),
  product_name VARCHAR(100),
  product_category VARCHAR(50),
  PRIMARY KEY (order_id, product_id)
);
Second Normal Form (2NF) eliminates partial dependencies. Every non-key column must depend on the entire primary key, not just part of it. In our orders_1nf table, customer_name depends only on order_id (not on product_id), and product_name depends only on product_id. Those are partial dependencies. Fix it by splitting into separate tables:
CREATE TABLE orders (
  order_id INT PRIMARY KEY,
  customer_id INT,
  order_date DATE
);

CREATE TABLE order_items (
  order_id INT,
  product_id INT,
  quantity INT,
  PRIMARY KEY (order_id, product_id)
);

CREATE TABLE customers (
  customer_id INT PRIMARY KEY,
  customer_name VARCHAR(100),
  customer_city VARCHAR(100)
);

CREATE TABLE products (
  product_id INT PRIMARY KEY,
  product_name VARCHAR(100),
  product_category VARCHAR(50)
);
Third Normal Form (3NF) removes transitive dependencies - the concept that trips up the most people. A Reddit thread on r/dataengineering showed users struggling with this, so let's make it concrete. In our Customers table, customer_city depends on customer_id. But if we also stored city_state, that depends on customer_city, not directly on customer_id. That's a transitive dependency: customer_id -> customer_city -> city_state. The fix is to move city/state into its own table.
The intuition is simple: every non-key column should tell you something about the key, the whole key, and nothing but the key. If column B tells you about column C (which tells you about the key), B and C belong in a separate table.
Boyce-Codd Normal Form (BCNF), named after Raymond F. Boyce and Edgar F. Codd and formalized in 1974, catches an edge case: when a column that determines other columns isn't itself a candidate key. If your table has two overlapping composite keys, check for this. For most applications, if you've reached 3NF and don't have overlapping candidate keys, you're already in BCNF.
4NF and 5NF - When You Actually Need Them
Fourth Normal Form (4NF), introduced by Ronald Fagin in 1977, handles multi-valued dependencies - situations where two independent multi-valued facts about an entity are stored in the same table. Fifth Normal Form (5NF), also from Fagin (1979), addresses join dependencies that can't be reduced to simpler components. Higher forms like DKNF and 6NF exist but are almost exclusively academic.
Here's the thing: for most applications, 3NF is the ceiling. Skip this section if you aren't dealing with multi-valued dependencies causing actual data anomalies in production.
When to Denormalize
Normalization isn't always the right answer. The decision depends on your workload:
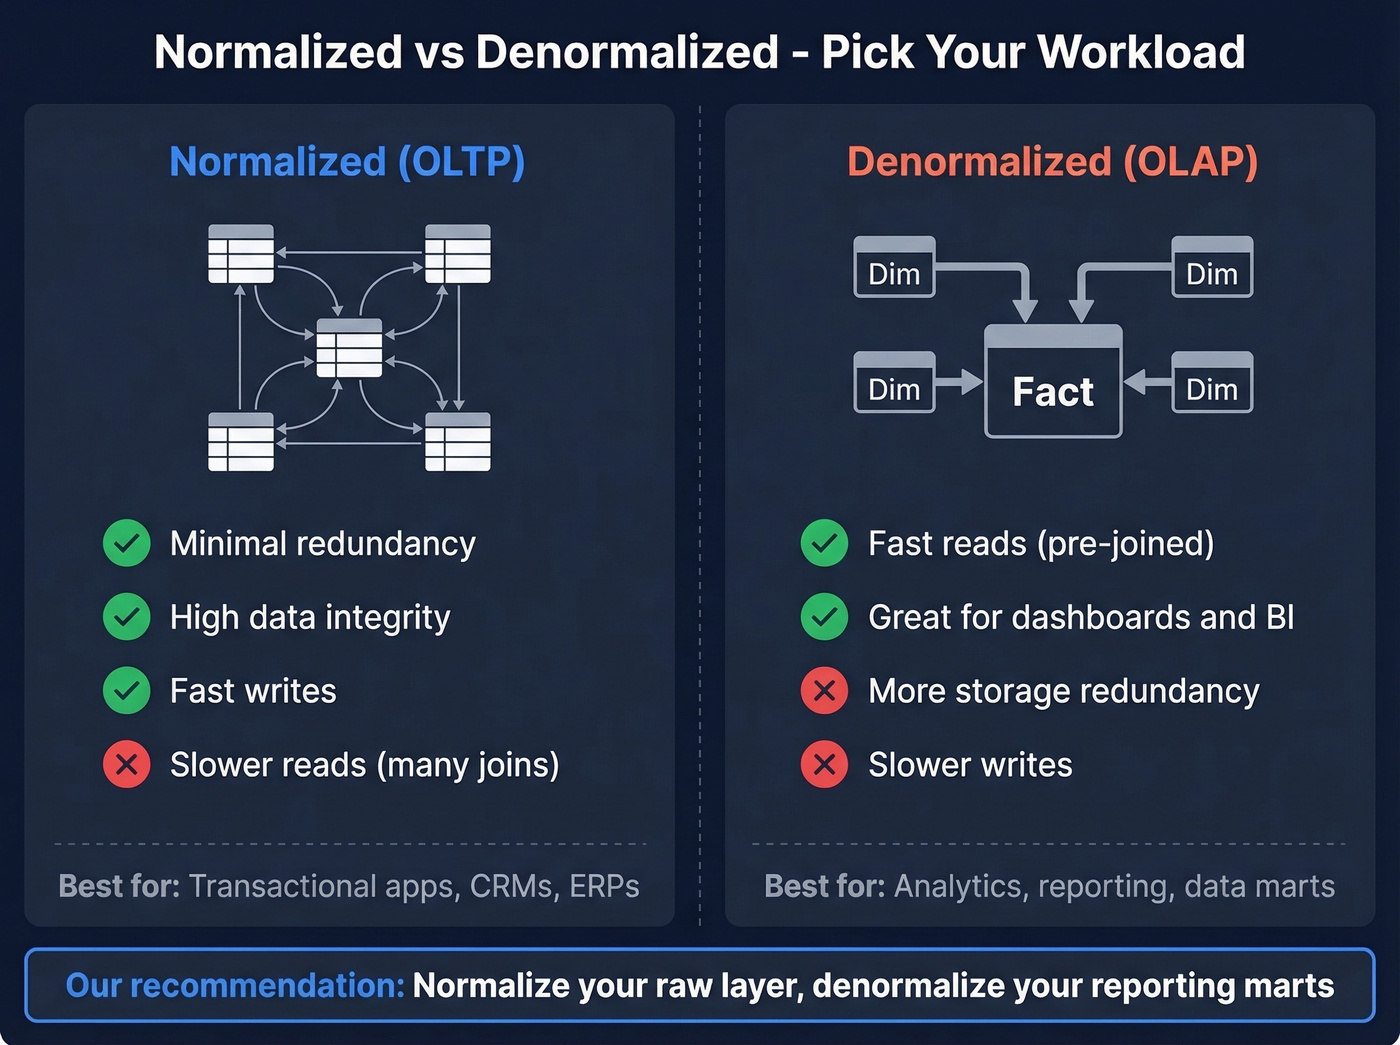
| Factor | Normalized (OLTP) | Denormalized (OLAP) |
|---|---|---|
| Redundancy | Minimal | Intentional |
| Data integrity | High | Moderate |
| Read speed | Slower (joins) | Faster (pre-joined) |
| Write speed | Faster | Slower |
| Use case | Transactional apps | Analytics, reporting |
For analytics workloads, star schemas and snowflake schemas are the standard patterns. A star schema places a central fact table - sales transactions, for example - surrounded by dimension tables for customers, products, and dates. It's deliberately denormalized for query performance. A snowflake schema normalizes dimension tables further, which helps when dimensions are large or shared across many facts.
In cloud warehouses, storage and compute are billed separately. Normalized schemas reduce storage duplication, while denormalized marts often reduce compute for repeated BI queries. This economic reality drives the modern consensus, and the approach we recommend: normalize your raw layer and denormalize your reporting marts. Your staging tables should preserve the integrity of source data. Your BI-facing tables should be optimized for the queries analysts actually run. Trying to serve both purposes with one schema is how you end up with a data warehouse that's slow for everyone.
Normalization headaches often start with dirty source data. Prospeo's 5-step verification and 7-day refresh cycle deliver 50+ standardized data points per contact - so your ETL pipelines ingest clean, consistent records from day one.
Stop normalizing garbage. Start with data that's already clean.
Feature Scaling in Machine Learning
In machine learning, "normalization" means something entirely different: scaling numerical features so they occupy comparable ranges. Nothing to do with database tables or schema design.
Why Feature Scaling Matters
Picture a churn prediction model using KNN. You've got two features: annual revenue (ranging from $10K to $50M) and employee count (ranging from 1 to 500). Without scaling, the distance calculation is completely dominated by revenue - a $1M difference dwarfs a 100-employee difference, even though both are equally predictive.
If you're using KNN, SVM, K-means, or neural networks without scaling, your results will be worse. The algorithm is making decisions based on which feature happens to have the largest numbers, not which feature is most predictive.
Most "broken" ML models aren't broken at all - they're just unscaled. Before you blame the algorithm, check your preprocessing pipeline.
Min-Max vs Z-Score vs Robust Scaling
Three scaling methods cover the vast majority of use cases.
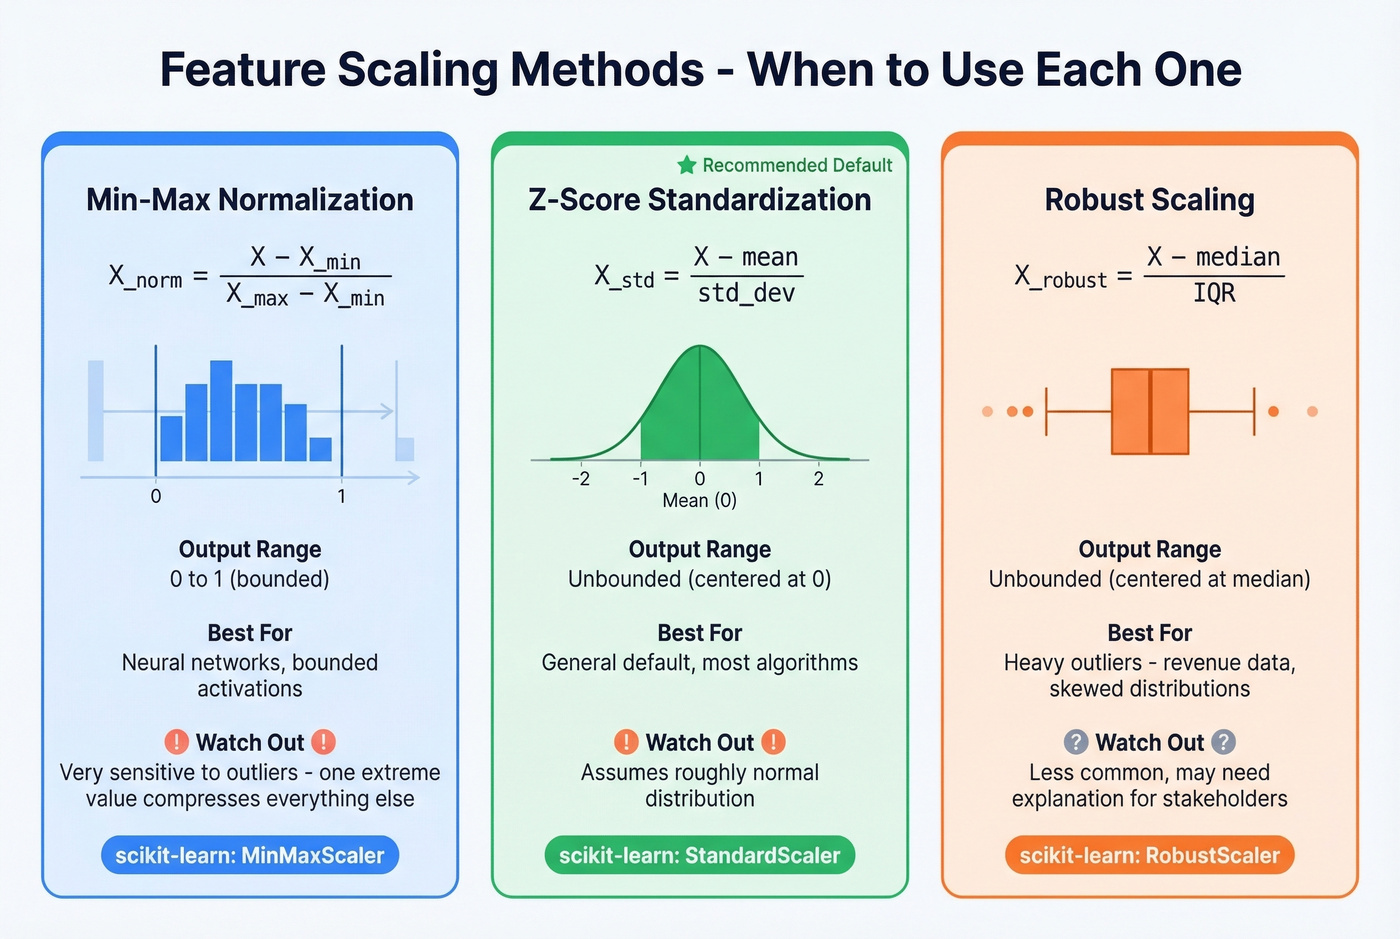
Min-max normalization rescales every value to a fixed range, typically 0 to 1:
$$X_{norm} = \frac{X - X_{min}}{X_{max} - X_{min}}$$
It's intuitive and works well when you need bounded outputs - particularly useful for neural network activation functions. The tradeoff: it's highly sensitive to outliers. A single extreme value defines the min or max, which compresses all other data points into a narrow band.
Z-score standardization transforms data to have a mean of 0 and standard deviation of 1:
$$X_{std} = \frac{X - \mu}{\sigma}$$
Because standard deviation is an aggregated statistic, individual outliers have less direct control over the scaling than they do with min-max. The result isn't bounded to a specific range, which matters for some algorithms but not others. Z-score is a common default in many workflows, and it's where we'd start if you aren't sure.
Robust scaling uses median and interquartile range (IQR) instead of mean and standard deviation:
$$X_{robust} = \frac{X - \text{median}}{\text{IQR}}$$
This is your go-to when the data has heavy outliers. Median and IQR are resistant to extreme values in a way that mean and standard deviation aren't. scikit-learn's RobustScaler implements this directly.
The practical recommendation: default to StandardScaler (z-score). Switch to MinMaxScaler for neural networks that need bounded inputs. Use RobustScaler when your data has outlier-heavy distributions - revenue data, for example, where a few enterprise deals skew the entire range.
Which Algorithms Need Scaling?
| Algorithm | Scaling Recommended? | Why |
|---|---|---|
| KNN, K-means | Yes | Distance-based |
| SVM | Yes | Margin optimization |
| Neural networks | Yes | Gradient descent |
| Logistic regression | Yes | Gradient-based optimization is scale-sensitive |
| Random forest | No | Split-based |
| XGBoost / LightGBM | No | Tree-based, scale-invariant |
| PCA | Yes | Variance-based |
Tree-based models make decisions based on feature value thresholds, not distances or gradients. Scaling doesn't change predictions because splits depend on feature ordering, not magnitude. Everything else on this list will produce different - and usually worse - results without scaling.
"Doesn't Scaling Remove Meaning?"
This comes up constantly. A Reddit thread on r/datascience captured the concern well: "If income is genuinely predictive, won't scaling hide that importance?"
No. Scaling changes units, not information content. Think of it like converting temperature from Fahrenheit to Celsius - the relative differences between measurements are preserved. Model coefficients and distance calculations adjust accordingly. A feature that's predictive before scaling is equally predictive after. What changes is the algorithm's ability to see that predictiveness without being distracted by raw magnitude differences.
Python Implementation
All three scalers follow the same pattern in scikit-learn:
from sklearn.preprocessing import MinMaxScaler, StandardScaler, RobustScaler
from sklearn.model_selection import train_test_split

data = np.array([[10000], [50000], [25000], [80000], [5000000]])
X_train, X_test = train_test_split(data, test_size=0.2, random_state=42)

# Min-max (0-1 range)
mm = MinMaxScaler()
X_train_mm = mm.fit_transform(X_train)  # Fit on training data only
X_test_mm = mm.transform(X_test)        # Transform test data - never fit

# Z-score (mean=0, std=1)
ss = StandardScaler()
X_train_ss = ss.fit_transform(X_train)
X_test_ss = ss.transform(X_test)

# Robust (median/IQR)
rs = RobustScaler()
X_train_rs = rs.fit_transform(X_train)
X_test_rs = rs.transform(X_test)
Fit on your training set, then use transform() on test data. Never fit on the test set - that's data leakage, and it'll silently inflate your evaluation metrics.
Format Standardization in ETL
The third meaning is the most practical and the least formal: standardizing data formats across multiple sources so they can be combined, compared, and analyzed. No normal forms, no scaling formulas - just making sure "New York," "NY," "new york," and "N.Y." all resolve to the same thing.
Format Standardization Checklist
Every ETL normalization pipeline should handle these categories:
- Address standardization: "123 Main St." vs "123 Main Street" vs "123 main st" - pick a canonical form and enforce it
- Phone number formatting: Strip parentheses, dashes, spaces. Store in E.164 format (+1XXXXXXXXXX). Validate country codes.
- Date and timezone handling: ISO 8601 (e.g., 2026-03-23T14:05:00Z) as the canonical format. Convert all timestamps to UTC at ingestion, localize at display.
- Currency conversion: Log the exchange rate and conversion date alongside the converted value. Never overwrite the original currency.
- Company name deduplication: "IBM," "International Business Machines," "I.B.M. Corp" - fuzzy matching plus a canonical entity ID
Healthcare offers a powerful example of how deep this gets. Systems like SNOMED CT, ICD-10, and LOINC represent many-to-one canonicalization - dozens of source terminologies mapped into a single normalized vocabulary. The mapping is one-way (you preserve the original terms) and purpose-driven, since different use cases normalize differently. It's the most rigorous version of what every data team does when they merge CRM data with marketing automation data.
The Modern Data Stack Pattern
The standard architecture in 2026 is a normalized raw/staging layer feeding denormalized reporting marts. Your raw layer preserves source data with minimal transformation - just enough structure to query it. Your reporting layer is optimized for BI tools, with pre-joined tables, pre-aggregated metrics, and business-friendly naming.
dbt is the standard for transformation logic in this stack. The core CLI is free; dbt Cloud starts around $100+/month. Apache NiFi handles data flow and routing as a free, open-source option. Talend offers a visual ETL builder with commercial plans running ~$1,000+/month depending on edition and users. For most teams, dbt plus a cloud warehouse handles the vast majority of transformation needs.
B2B Contact Data: Where Format Fixes Hit Their Limits
Look, you can standardize every phone number to E.164, format every email to lowercase, and deduplicate company names perfectly - and still have a list full of dead addresses. An email can be perfectly formatted and completely dead.
We've seen this play out dozens of times: a team spends weeks building a beautiful normalization pipeline, loads 50,000 contacts into their outbound sequences, and watches their bounce rate climb past 15% because nobody verified whether those clean-looking records were actually deliverable. The gap between normalization and verification is where most B2B data quality breaks down.
The workflow should be: normalize formats first, deduplicate second, then verify before anything hits a sequence. Tools like Prospeo close that last gap - 98% email accuracy on 143M+ verified records, refreshed on a 7-day cycle, with enrichment returning 50+ data points per contact so your normalized records are actually complete.
Update anomalies, stale addresses, duplicate records - these problems multiply when your CRM ingests unverified data. Prospeo enriches your CRM with 98% accurate emails and 125M+ verified mobiles, refreshed every 7 days. That's 6x faster than the industry average.
Eliminate data anomalies before they reach your database.
Common Mistakes to Avoid
We've seen teams make every one of these. They show up across all three meanings of normalization.
Stopping at 1NF or 2NF. Partial normalization is often worse than no normalization - you've added complexity without eliminating the anomalies that motivated the effort. Push to 3NF or don't bother.
Over-normalizing to BCNF+ without business justification. Decomposing tables that work fine at 3NF adds join complexity that slows queries and confuses developers. Unless overlapping candidate keys are causing real anomalies in production, leave it alone.
Ignoring join performance at scale. A beautifully normalized schema with 15 tables joined in a single query will crawl on a 100M-row dataset. Benchmark your actual query patterns. Add indexes. Selectively denormalize the hot paths.
Confusing normalization with data cleaning. Database normalization doesn't deduplicate "John Smith" and "Jon Smith." ML scaling doesn't fix missing values. ETL normalization doesn't validate that an email address actually works. Each is a distinct step in the pipeline.
Not documenting design decisions. Six months from now, nobody will remember why you split the Addresses table into three sub-tables. Write it down. A one-paragraph design note per table saves hours of archaeology later.
Skipping feature scaling for scale-sensitive algorithms. This is the most common ML pipeline bug we encounter. The model isn't broken - it's just measuring the wrong thing.
FAQ
What is the purpose of data normalization?
It depends on context. In databases, it eliminates redundancy and prevents insert, update, and delete anomalies. In machine learning, it scales features to comparable ranges so algorithms weight them fairly. In ETL, it standardizes formats so records from different sources can be merged and analyzed without ambiguity.
What's the difference between normalization and standardization?
In databases, the terms are interchangeable - both mean organizing schema to reduce redundancy. In machine learning, normalization typically means min-max scaling (0-1 range) while standardization means z-score scaling (mean = 0, std = 1). Always clarify which meaning applies in cross-functional conversations.
What normal form should I target?
Third normal form (3NF) for most production applications. It eliminates anomalies that cause real problems without the join complexity of higher forms. Move to BCNF only if overlapping candidate keys are creating issues. Going beyond BCNF is rarely justified outside academic exercises.
Do all ML models need feature scaling?
No. Distance-based models (KNN, SVM, K-means) and gradient-based models (neural networks, logistic regression) benefit heavily. Tree-based models like random forest and XGBoost are scale-invariant - scaling won't change their output. When in doubt, scale anyway; it won't hurt trees and saves debugging time.
How do I normalize B2B contact data across sources?
Standardize formats first - phone numbers to E.164, emails to lowercase, company names to canonical IDs - then deduplicate with fuzzy matching. Finally, verify accuracy before anything goes into a sequence. Prospeo validates emails at 98% accuracy across 143M+ records on a 7-day refresh cycle, ensuring data that looks clean actually works.
Three Meanings, One Principle
Database normalization, ML feature scaling, and ETL format standardization solve different problems with different tools - but they share a single principle: raw data is messy, and structure makes it useful. Understanding which type you're dealing with, and knowing the right techniques for each, means you'll spend less time debugging dashboards and more time acting on what the data actually tells you.