Forecast Confidence: The Complete Guide for Analysts and Leaders
Your VP leans across the table during the QBR and asks, "How confident are you in the Q4 number?" You say 85%. They nod. Neither of you is talking about the same thing. That gap between statistical confidence and gut-feel confidence leads to misallocated resources - and 82% of chief economists in the WEF Chief Economists Outlook now rate economic uncertainty as "very high." Getting forecast confidence right has never mattered more.
The short version: use prediction intervals, not confidence intervals when forecasting future values. Always present ranges, not point estimates. And fix your data quality before you touch the model.
What It Actually Means
Forecast confidence carries two distinct meanings, and conflating them is where most problems start.
The statistical meaning is precise: intervals that quantify how uncertain a forecast is. A 95% prediction interval says there's a 95% probability the future value lands within those bounds. It's math, not vibes. As Hyndman puts it, point forecasts are "of almost no value" without prediction intervals - because without them, you're just guessing with extra steps.
The business meaning is fuzzier: organizational trust that the forecast reflects reality. When your CFO says "I don't have confidence in this number," they're not critiquing your standard errors. They're saying the forecast doesn't match their intuition, the pipeline looks shaky, or last quarter's miss still stings. Both meanings matter. Confuse one for the other and you'll have bad conversations that lead to worse decisions.
Confidence Interval vs Prediction Interval
Use prediction intervals when you're forecasting a future observation - next quarter's revenue, next month's churn count, tomorrow's demand. A prediction interval captures both model uncertainty and the inherent randomness of the thing you're predicting. It's wider. It's also honest.
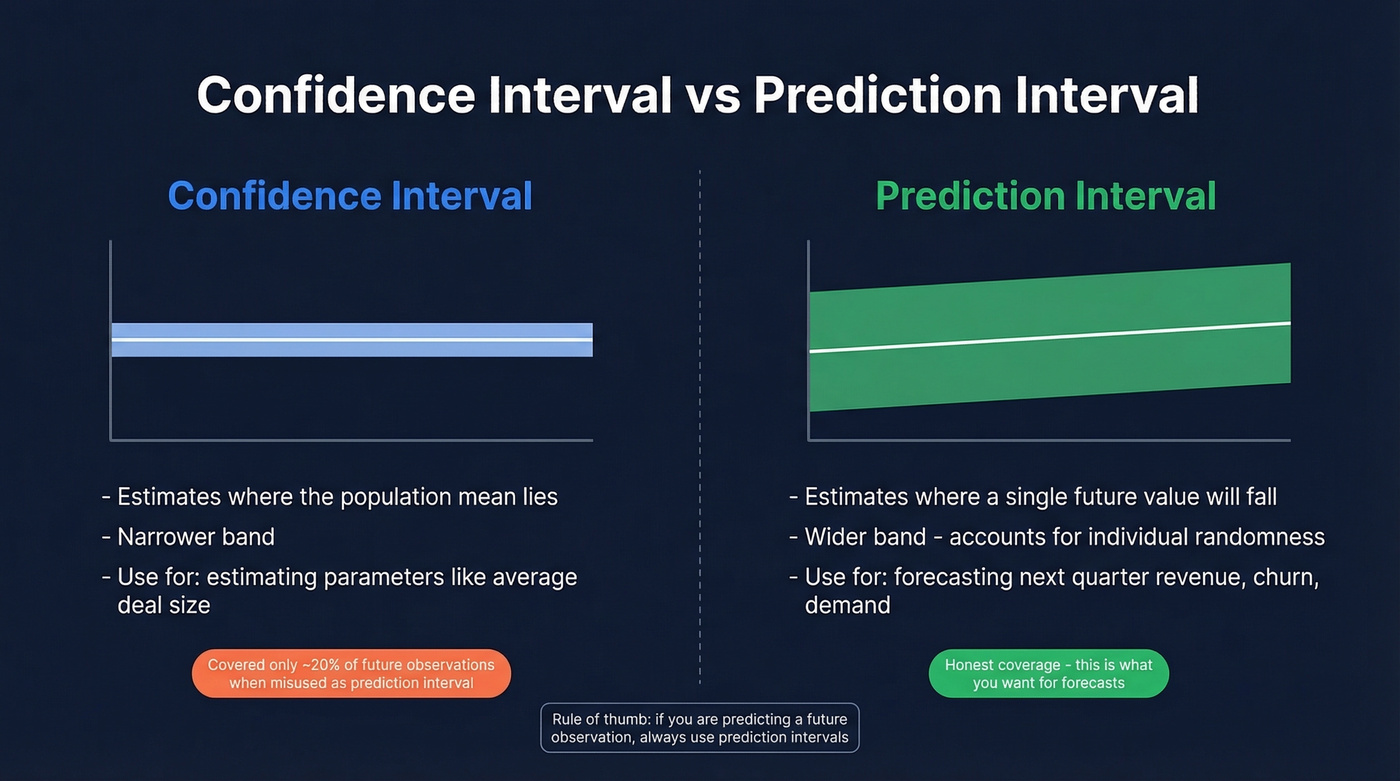
Use confidence intervals when you're estimating a parameter - the true mean conversion rate, the average deal size across all customers.
Never substitute one for the other. Hyndman demonstrates that using a 95% confidence interval for the mean as if it were a prediction interval covered only about 20% of future observations. That's not a rounding error. It's false precision that makes leadership think the forecast is five times more certain than it actually is.
Even in econometrics, the terms get used interchangeably. If you see "confidence interval" in a forecasting context, check whether they actually mean prediction interval. They usually do.
How to Calculate Forecast Intervals
The core formula for an h-step prediction interval under normally distributed errors:
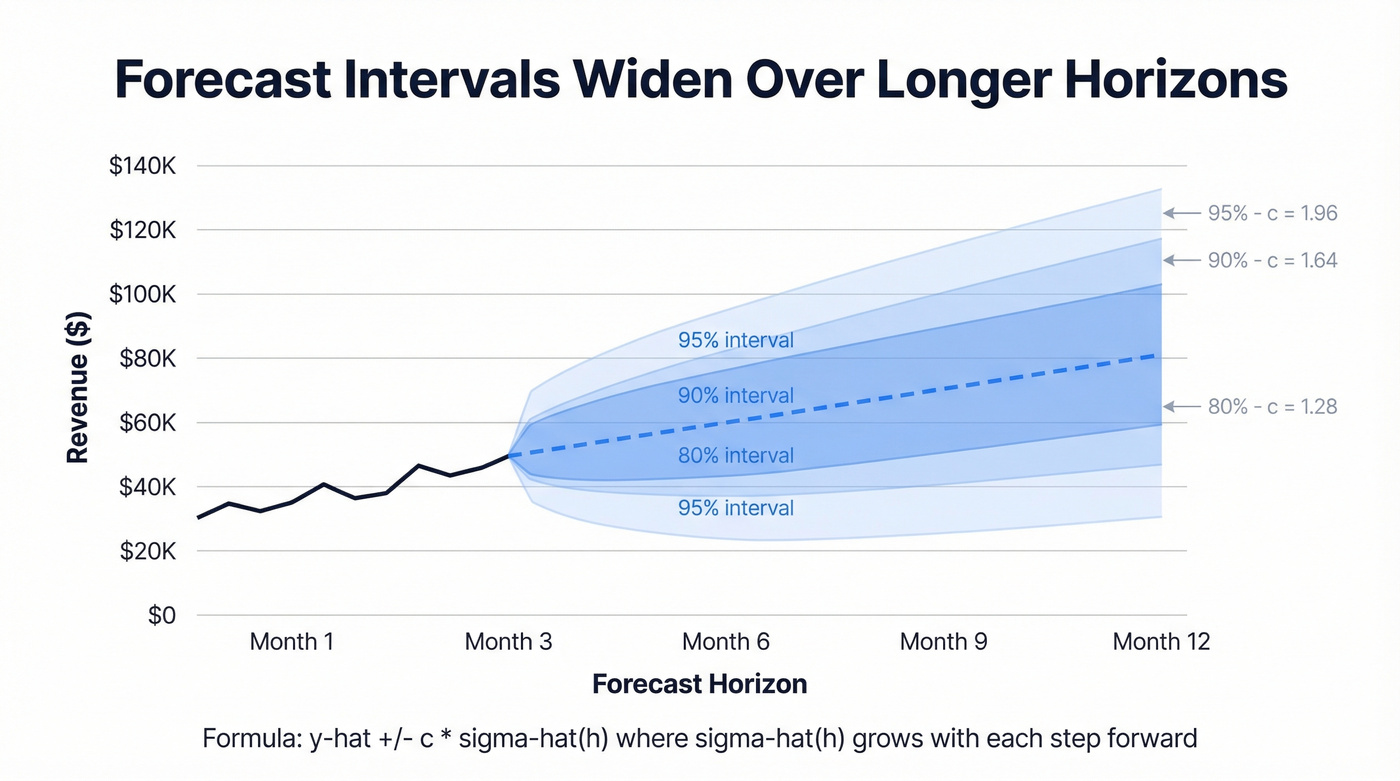
Where y-hat is your point forecast, c is the multiplier for your chosen coverage level, and sigma-hat(h) is the estimated standard deviation of the forecast error at horizon h.
| Coverage | Multiplier (c) |
|---|---|
| 80% | 1.28 |
| 90% | 1.64 |
| 95% | 1.96 |
Intervals widen as the horizon grows because sigma-hat(h) usually increases with each step forward - model error, parameter uncertainty, and inherent randomness compound. A 1-month forecast is tighter than a 6-month forecast. That's the model being honest, not broken.
In Python, statsmodels makes this practical:
from statsmodels.tsa.arima.model import ARIMA
model = ARIMA(data, order=(1,1,1)).fit()
forecast = model.get_forecast(steps=12)
intervals = forecast.conf_int(alpha=0.05)  # 95% interval
Excel users can get similar results with FORECAST.ETS.CONFINT. Note that it isn't available in Excel for the Web, iOS, or Android - desktop only.
You just read that teams spend weeks tuning models while feeding them outdated contact lists. Prospeo refreshes 300M+ profiles every 7 days - not the 6-week industry average. With 98% email accuracy and 92% API match rates, your pipeline data actually reflects reality.
Stop forecasting on stale data. Start with inputs you can trust.
Choosing the Right Level
Skip the decision paralysis. Here's the framework:
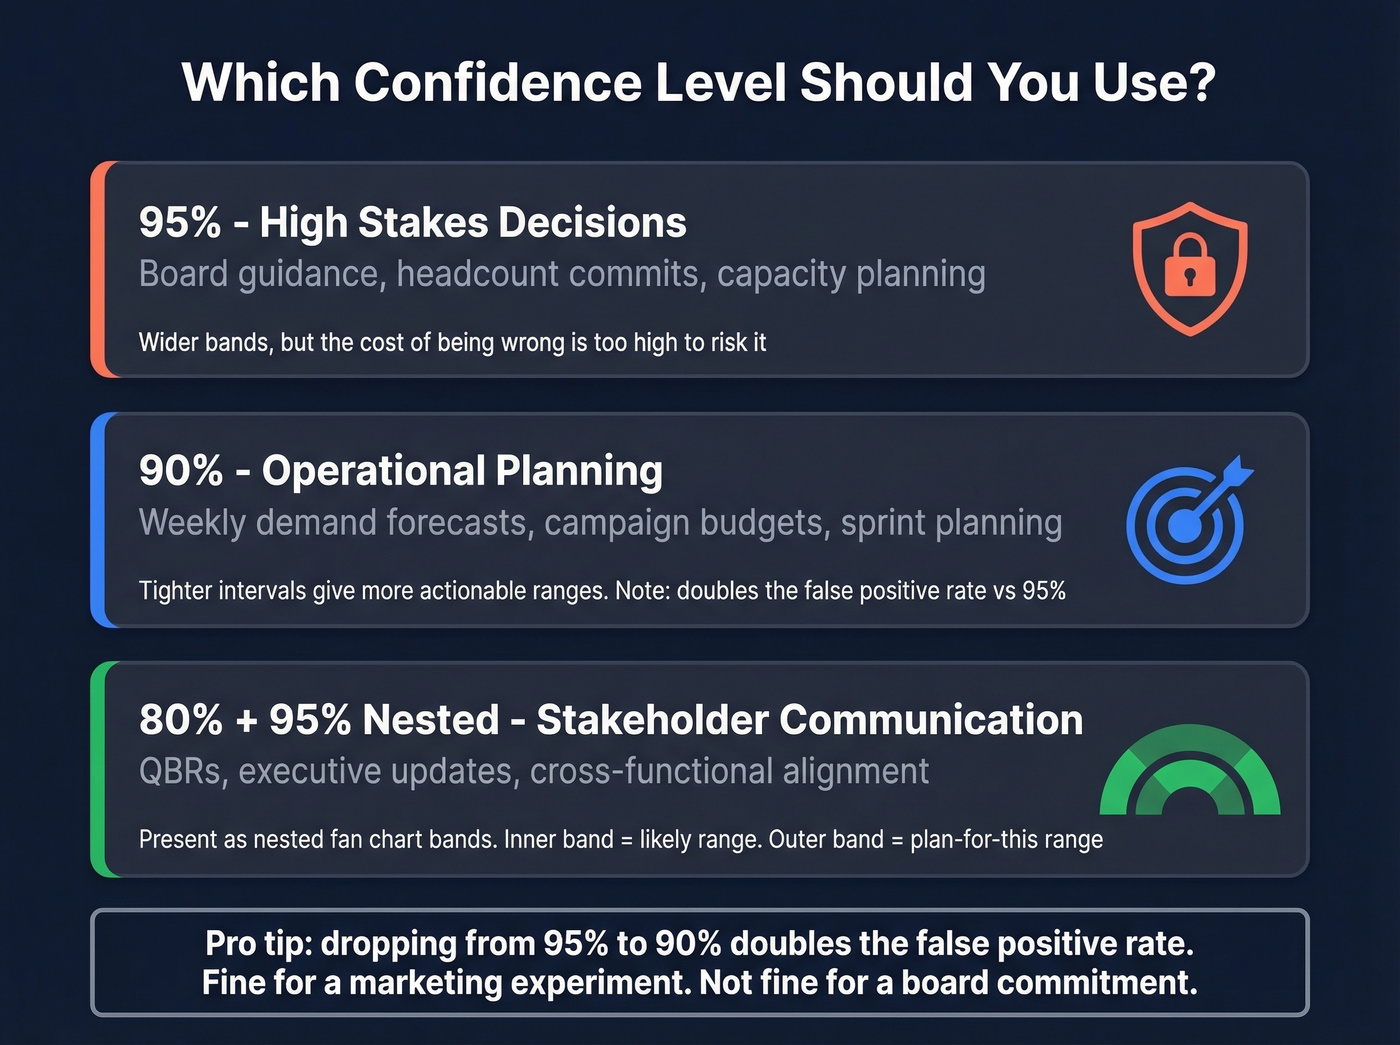
- Board guidance, headcount commits, capacity planning: 95%. The cost of being wrong is high, so you need wider bands.
- Weekly demand, campaign budgets, operational planning: 90% is sufficient. Tighter intervals give more actionable ranges.
- Stakeholder communication: Present both 80% and 95% as nested fan-chart bands. The inner band shows the likely range; the outer band shows the "plan for this" range.
One trade-off worth knowing: dropping from 95% to 90% effectively doubles the false positive rate. Fine for a marketing experiment. Not fine for a revenue commitment to the board.
Common Misconceptions
Hoekstra et al. (2014) found that CI misconceptions are widespread even among experienced researchers. If PhDs get this wrong, your VP definitely will.
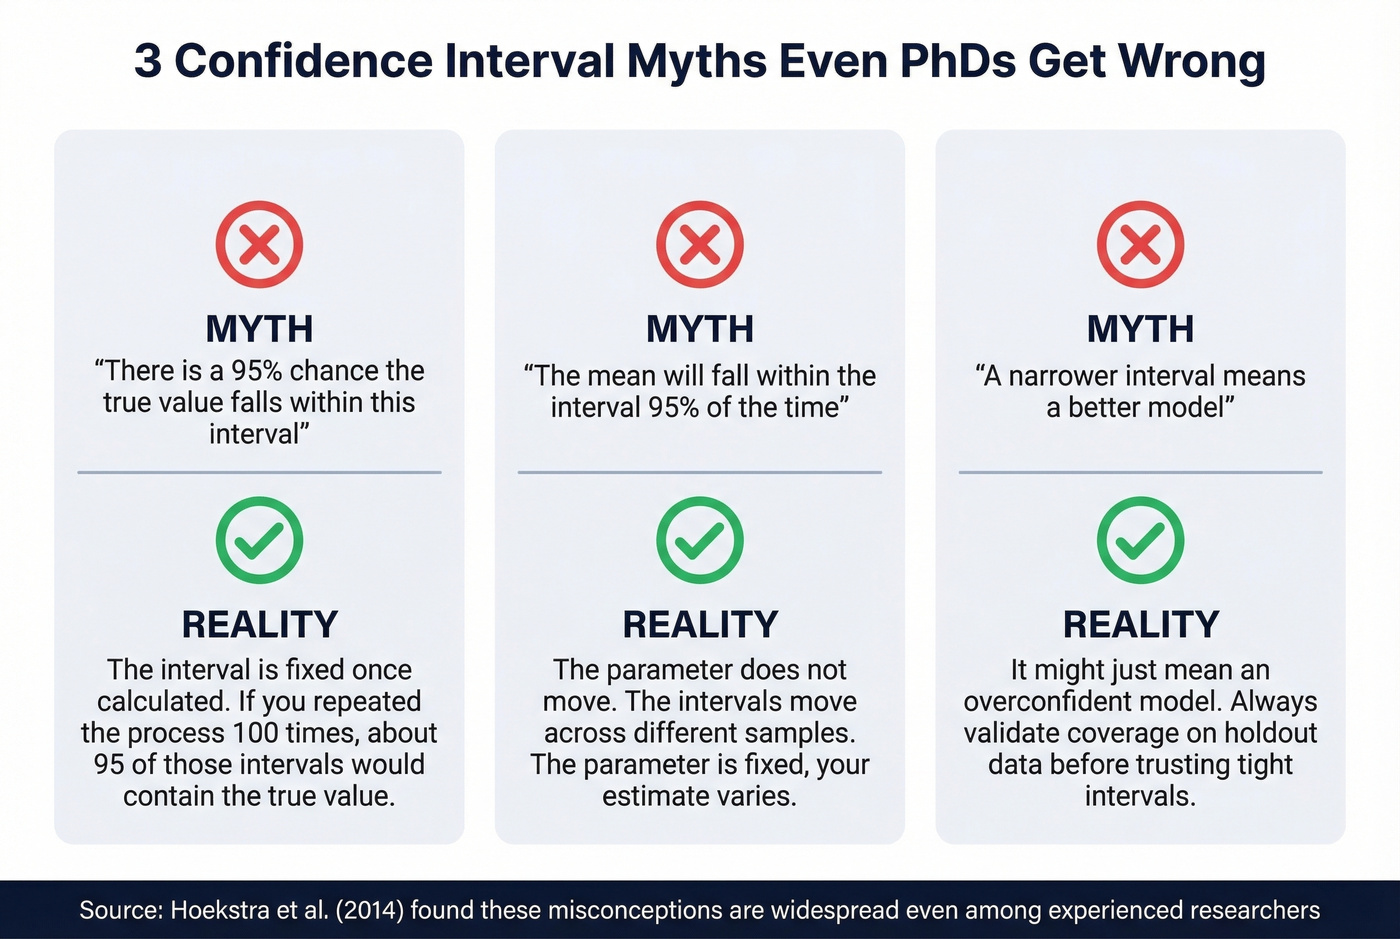
The three biggest traps:
"There's a 95% chance the true value falls within this interval." Wrong. The interval is fixed once calculated. The correct interpretation: if you repeated the process 100 times, about 95 of those intervals would contain the true value.
"The mean will fall within the interval 95% of the time." Also wrong. The parameter doesn't move; the intervals do across samples.
"A narrower interval means a better model." Not necessarily. It might just mean an overconfident model. Always validate coverage on holdout data.
Validating Your Forecasts
A forecast interval is only useful if it's calibrated. Here's the practical test: backtest your intervals on holdout data. Take your 95% prediction intervals and check whether roughly 95% of actual outcomes fell inside them. If only 60% did, your intervals are too narrow - you're overconfident. Reliability diagrams and Expected Calibration Error formalize this, but the coverage test is where to start.
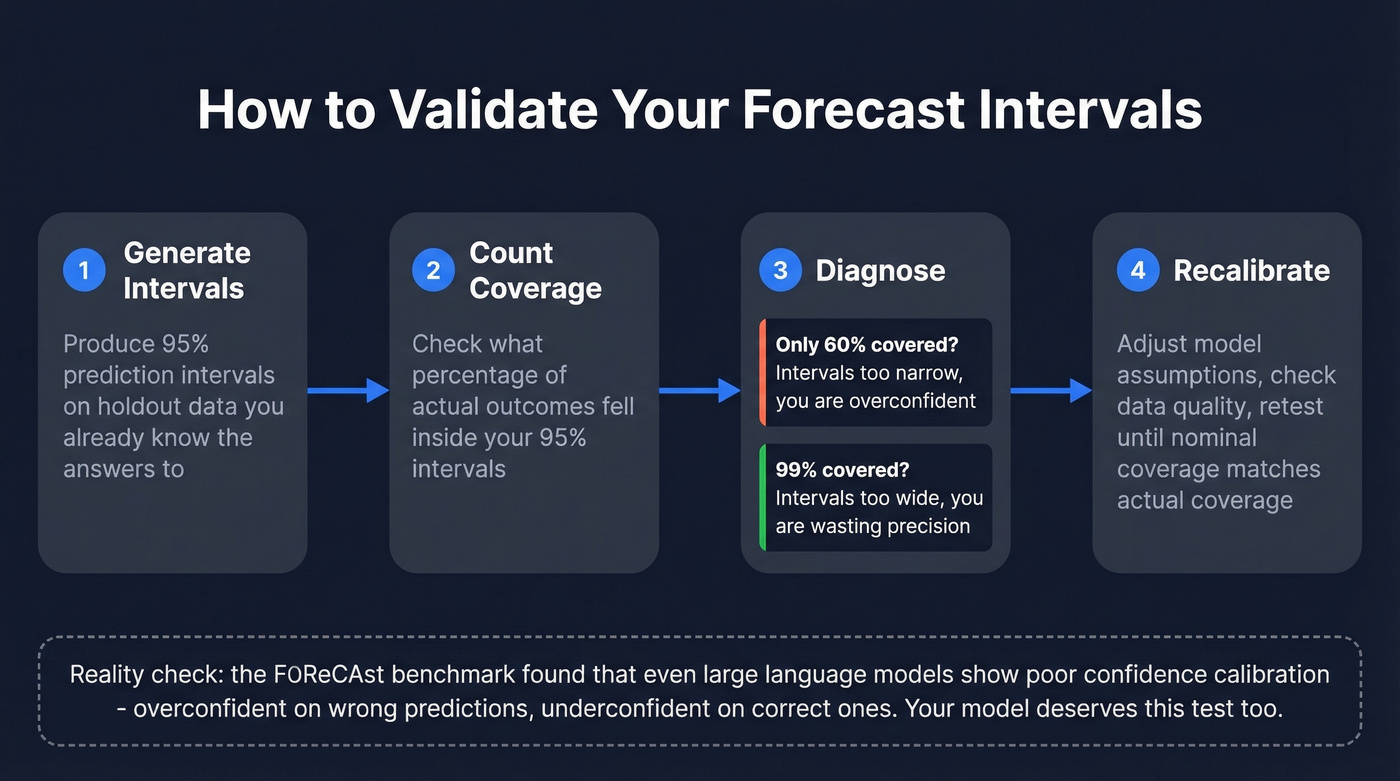
Even sophisticated models struggle here. The FOReCAst benchmark found that contemporary language models show poor confidence calibration overall - overconfident on wrong predictions, underconfident on correct ones. If LLMs can't self-assess reliability, your ARIMA model deserves a reality check too.
Sales Forecast Confidence in Practice
Most business forecasts don't break down in the model. They break down in the inputs.
The distinction between accuracy and bias matters enormously. A forecast can look accurate in aggregate while hiding systematic errors at the item level - over-forecasting in one segment cancels out under-forecasting in another. Leadership sees a clean number. Operations sees chaos.
We've watched teams spend weeks tuning ARIMA parameters while feeding the model contact lists that were hopelessly outdated. The FP&A community on Reddit describes the core problem well - late-stage deals slip because recorded activity doesn't capture actual buyer momentum. Meanwhile, data science teams report that leadership often demands point estimates only, rejecting the very intervals that would make forecasts useful.
Let's be honest about what drives forecast confidence in a sales context: it's less about model sophistication and more about whether the pipeline data feeding it reflects what's actually happening in the field. Top-performing forecasting organizations hold managers accountable for forecast quality, but accountability without data quality is theater.
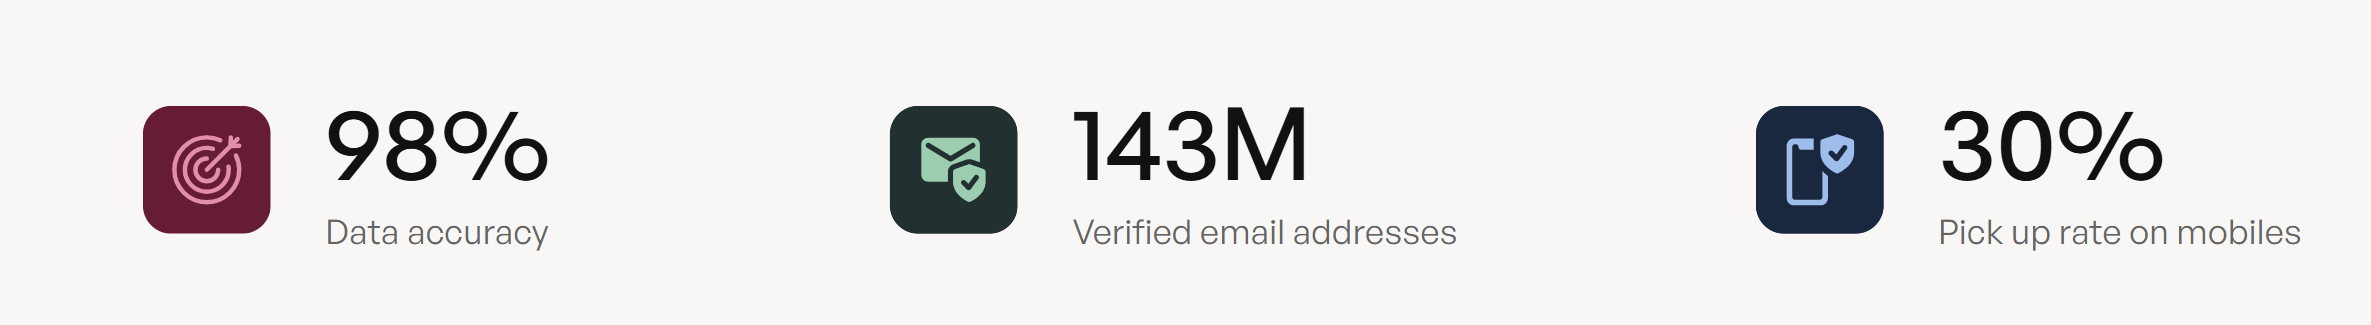
Here's the thing: if your average deal size exceeds five figures and your sales forecast depends on pipeline data built on unverified contacts, the problem isn't your model - it's your CRM. In our experience, fixing input freshness moves the needle more than any statistical refinement. Prospeo's 7-day refresh cycle and 98% verified email accuracy, built on 300M+ professional profiles, means the pipeline feeding your forecast reflects reality rather than six-week-old guesses.
Skip this approach if your forecasting challenge is purely a demand-planning or inventory problem with no CRM dependency. But for any revenue forecast that touches pipeline data, clean inputs aren't optional.
Forecast confidence collapses when deals slip because recorded activity doesn't match buyer momentum. Prospeo's intent data tracks 15,000 topics so you see which accounts are actively in-market - not which ones your CRM says talked to sales three months ago.
Layer real buyer signals into your forecast at $0.01 per lead.
FAQ
What's the difference between a confidence interval and a prediction interval?
A confidence interval estimates where the population mean lies; a prediction interval estimates where a single future observation will fall. For forecasting, you almost always want the prediction interval - it's wider because it accounts for individual-observation randomness, but it gives honest coverage.
Why do forecast intervals widen over longer horizons?
Uncertainty compounds. Each step forward adds model error, parameter uncertainty, and inherent randomness, so sigma-hat(h) grows with horizon h. A 12-month forecast will typically carry bands 2-4x wider than a 1-month forecast.
How does data quality affect forecast confidence?
Stale inputs poison even the best models. If your pipeline is built on outdated contacts and dead emails, prediction intervals become meaningless - the model is calibrated against fiction. Tools that refresh data on a weekly cycle rather than the 6-week industry average keep the inputs your model depends on accurate, so your intervals actually reflect reality.