Forecast Management: Fix the Process Before You Upgrade the Math
A sales rep spends 45 minutes every Friday updating close dates in Salesforce - not because it helps them sell, but because their manager's manager needs a number for the board. Meanwhile, a data scientist at a consumer goods company ships a beautifully tuned ML forecast every Monday morning, and nobody in supply chain can tell her whether anyone actually reads it. These two scenarios play out in thousands of companies every quarter, and they share the same root cause: forecasting without management.
If your forecasts keep missing, the problem is almost never the statistical method. It's governance - who owns the forecast, how often it's updated, and what triggers action when numbers drift. It's data quality. And it's cross-functional integration - whether anyone downstream actually uses the forecast to make decisions. Let's break down the methods, KPIs, and mistakes most teams get wrong.
What Is Forecast Management?
Forecasting is generating a prediction. Forecast management is everything that wraps around that prediction to make it useful: the governance, the process ownership, the data hygiene, the feedback loops, and the continuous improvement cycle that turns a number into a decision.
Most organizations are decent at producing forecasts and terrible at managing them. They've got the math. They're missing the plumbing.
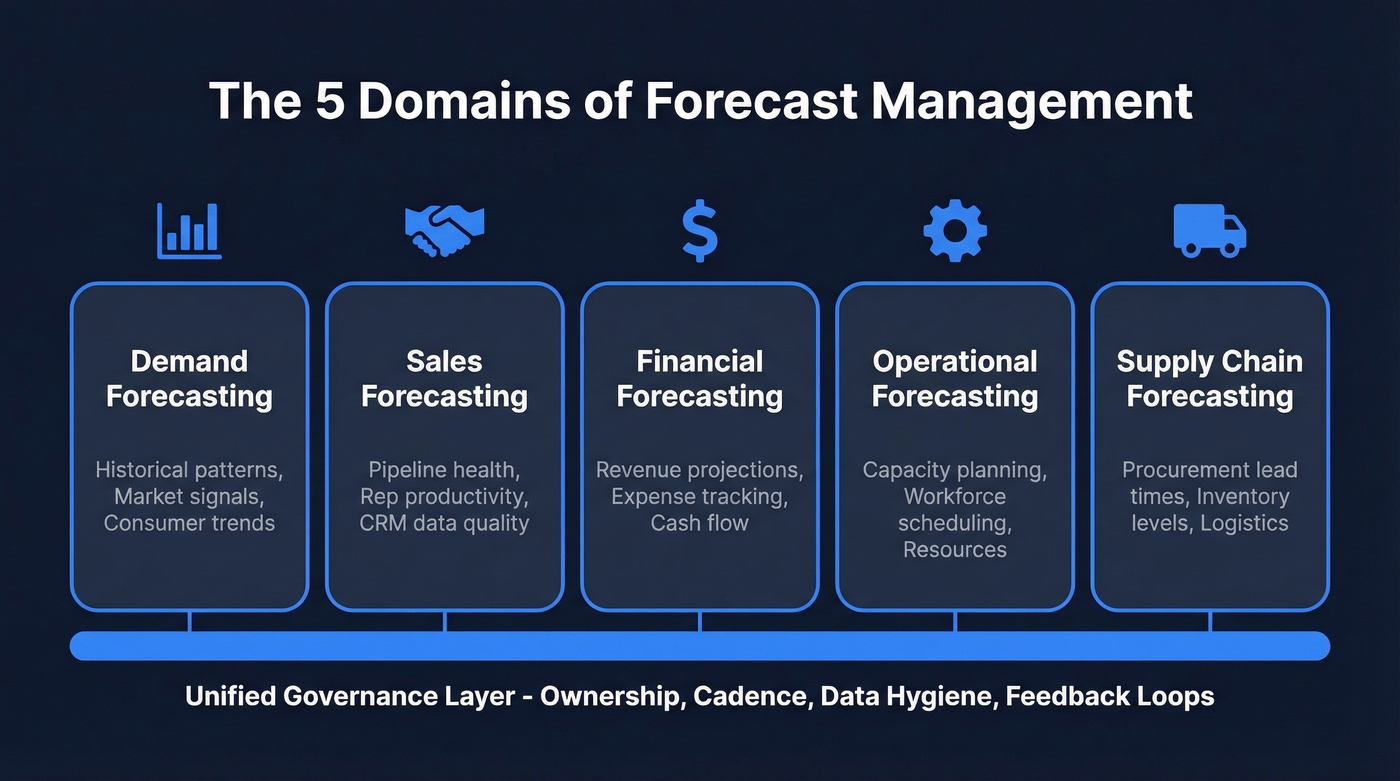
The discipline spans multiple domains, each with different inputs, owners, and decision horizons:
- Demand forecasting predicts external market and customer demand using historical patterns, macro indicators, and consumer trend data.
- Sales forecasting predicts internal ability to capture that demand - pipeline health, rep productivity, CRM data quality, and deal velocity. A sales forecast that nobody trusts because the pipeline is full of stale contacts is a management problem, not a math problem.
- Financial forecasting projects revenue, expenses, and cash flow for budgeting and investor communication.
- Operational forecasting covers capacity planning, workforce scheduling, and resource allocation.
- Supply chain forecasting ties demand signals to procurement lead times, inventory levels, and logistics planning.
The process also extends to project-based industries like construction, where cash flow forecasting is critical - one in five construction companies struggle with cash flow issues that better governance could prevent.
The distinction between sales and demand forecasting trips up a lot of teams. Sales forecasting depends heavily on CRM data quality and rep behavior. Demand forecasting depends on market signals and external data. Both need structured oversight, but the governance models look different.
Why Sales Forecasting Governance Matters
The numbers are stark. Companies with rigorous, tech-enabled forecasting workflows achieve 21% higher quota attainment, 18% higher win rates, and 25% lower customer churn than their peers, per Korn Ferry research. That's not a marginal improvement - it's the difference between hitting plan and missing it.
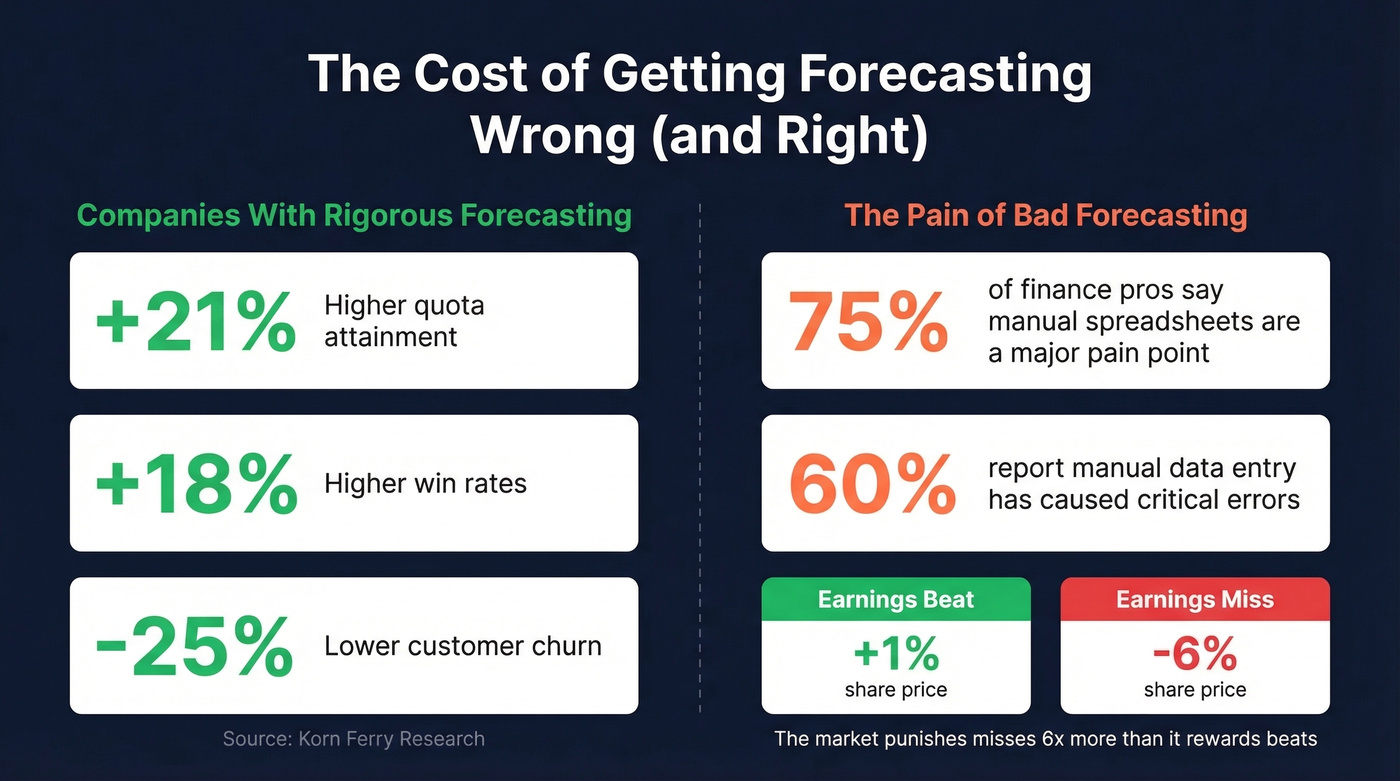
The cost of bad forecasting is asymmetric. In 2026 market data cited in Abacum's FP&A analysis, earnings beats lifted share prices roughly 1%. Misses dragged them down roughly 6%. The market punishes surprises far more than it rewards outperformance, which means forecast accuracy isn't just an operational metric - it's a credibility metric.
And yet, 75% of financial professionals say manual spreadsheet processes are a significant pain point in budgeting and forecasting. 60% report that manual data entry has caused critical errors - broken formulas, version control disasters, numbers that silently drift. The tools exist to fix this. The process discipline often doesn't.
The Core Process
Three stages apply regardless of whether you're forecasting demand, sales, or financial performance.
Start With Data Hygiene
Every forecasting failure we've seen traces back to dirty data. Before you touch a model, clean the inputs. That means removing outliers like viral spikes and stock-out periods that would skew your baseline. It means labeling promotions so your model doesn't mistake a 40%-off fire sale for organic demand growth. And it means backing out backorders and cancellations that inflate historical numbers.
Match Methods to Segments
One model doesn't fit all demand patterns. Segment your portfolio by demand characteristics and assign methods accordingly:
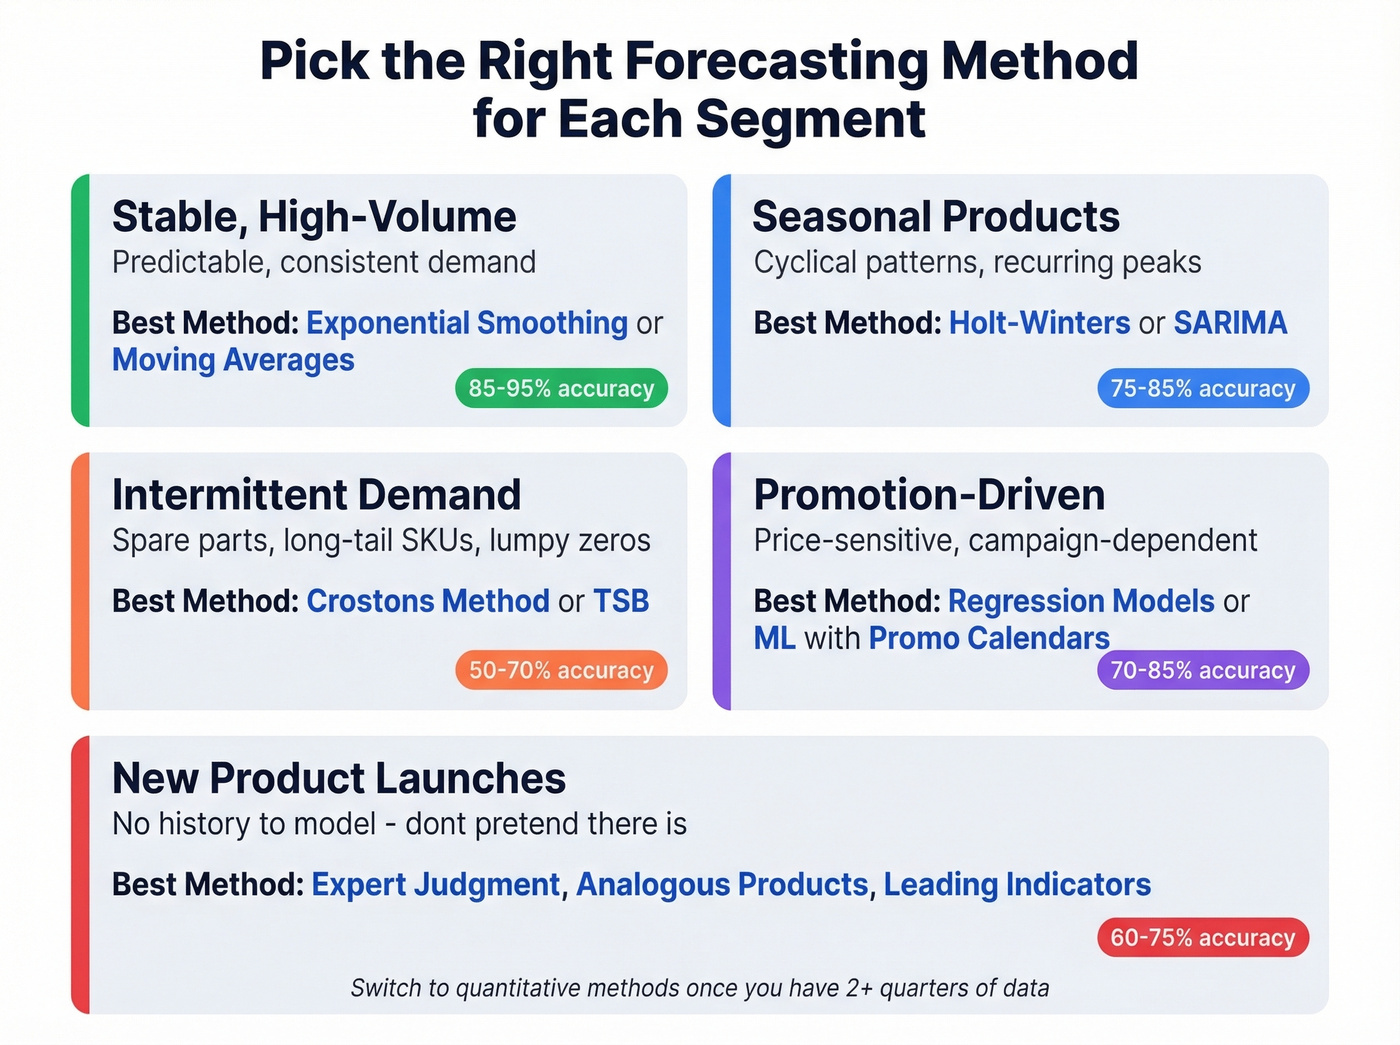
Stable, high-volume products do fine with exponential smoothing or simple moving averages. Don't overcomplicate it. Seasonal products need Holt-Winters or SARIMA models to capture cyclical patterns that simpler methods miss. Intermittent demand - spare parts, long-tail SKUs - calls for Croston's method or TSB to handle the lumpy, zero-heavy patterns that break standard models. Promotion-driven demand responds best to regression models or ML approaches that incorporate promo calendars and pricing variables.
For new product launches, throw the models out. There's no history to model, so don't pretend there is - rely on expert judgment, analogous product comparisons, and leading indicators until you've accumulated enough data to let the math take over.
The HBR framework for choosing forecasting techniques is over 50 years old and still holds up. The fundamentals haven't changed.
Design Around Decisions
Most teams build forecasts at whatever granularity is convenient, not whatever granularity supports actual decisions. This is where the money gets wasted.
The 4-Dimensions Framework offers a useful lens: design your forecast around granularity (what level of detail supports the decision), temporality (time buckets and horizon), metrics (what you're measuring accuracy against), and process (who owns what and when).
If your supplier needs monthly purchase orders three months ahead, focus your accuracy efforts on M+1 through M+3 at the SKU-warehouse level. Don't waste energy perfecting a 12-month national-level forecast that nobody uses for procurement decisions. Forecasting at the country level when decisions happen at the warehouse level is one of the most common - and most expensive - mis-alignments we see.
Measuring Accuracy
A single accuracy target is lazy planning. Setting "85% accuracy" across your entire portfolio ignores the reality that a stable, high-volume product and a brand-new seasonal launch have fundamentally different forecastability.
Realistic accuracy by segment:
- High-volume, stable demand: 85-95% accuracy is achievable and expected.
- Seasonal products: 75-85%. Cyclical swings introduce variance that models can partially but never fully capture.
- New product launches: 60-75%. Hitting 70% in the first two quarters is excellent.
- Intermittent/long-tail: 50-70%. Inherently hard to forecast, and your planning strategy should account for that rather than demanding impossible precision.
As a rule of thumb, MAPE below 10% is very good; above 25% signals a process that needs serious optimization. But MAPE has real pitfalls - it's skewed by low-volume items and mathematically promotes underforecasting. Combine it with MAE and bias tracking for a more honest picture.
| Metric | What It Measures | Use When | Key Pitfall |
|---|---|---|---|
| MAPE | % error vs actuals | General reporting | Skews on low volumes |
| WMAPE | Volume-weighted % error | Portfolio-level view | Hides SKU problems |
| MAE | Absolute error in units | Operational planning | No % context |
| Bias | Directional tendency | Diagnosing over/under | Doesn't show magnitude |
52% of companies use WMAPE as their primary metric. Industry averages for forecast error run higher than most people expect - CPG averages around 39%, chemicals around 36%. If your numbers are in that range, you're not failing. You're normal. But normal isn't good enough if your competitors are investing in better processes.
Bad CRM data is the #1 reason sales forecasts miss. Stale contacts, bounced emails, and wrong numbers inflate your pipeline and destroy forecast accuracy. Prospeo's 7-day data refresh cycle and 98% email accuracy keep your pipeline clean - so your forecast actually reflects reality.
Stop forecasting on dirty data. Start with contacts that are actually real.
Governance and Roll-Ups
This is the "management" in forecast management, and it's where most organizations have the biggest gap. You can have perfect models and still miss forecasts if nobody owns the process.
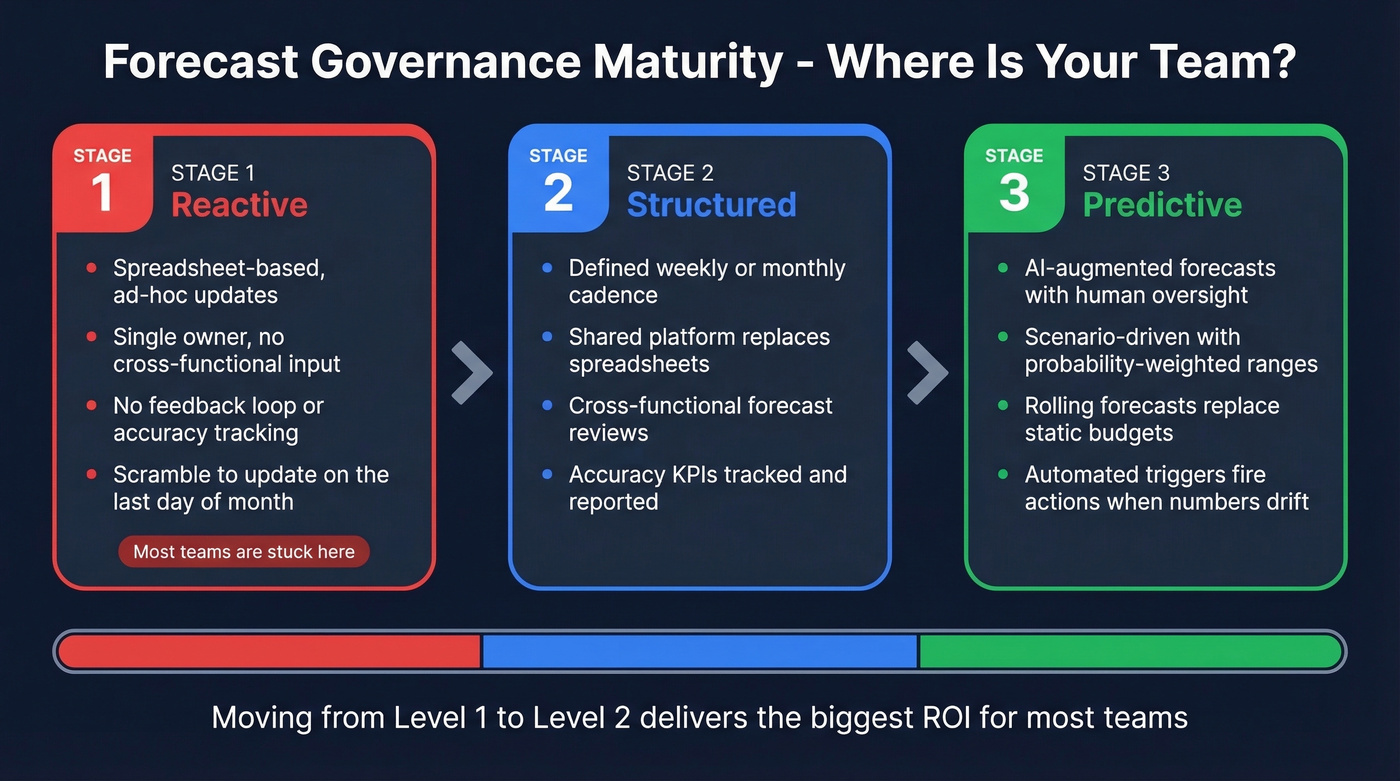
Here's a quick maturity check - most teams are stuck at Level 1:
| Level | Label | What It Looks Like |
|---|---|---|
| 1 | Reactive | Spreadsheet-based, ad-hoc updates, single owner, no feedback loop |
| 2 | Structured | Defined cadence, shared platform, cross-functional reviews, accuracy tracked |
| 3 | Predictive | AI-augmented, scenario-driven, rolling forecasts, automated triggers, continuous improvement |
Cadence matters. For teams that want forecasting to move fast, you need tight operational discipline: track data accuracy KPIs daily, time-box your close-to-forecast process, and complete updates several days before month-end - not in a scramble on the last day. In high-velocity environments, weekly reforecasting is a common operating cadence. For many businesses, monthly reforecasting is the baseline.
Forecast roll-ups deserve special attention. When individual rep-level or SKU-level forecasts aggregate up to regional, divisional, and company-wide numbers, errors compound - or sometimes cancel out in misleading ways. A clean roll-up process requires consistent assumptions across levels, clear rules for how overrides propagate, and visibility into where the biggest variances originate. Without disciplined roll-ups, leadership sees a smooth top-line number while problems hide in the segments underneath.
Scenarios beat point estimates. Maintain probability-weighted ranges per business unit, set standard assumptions organization-wide, then stress-test key variables. The real power is in pre-setting "go/no-go" triggers - specific actions that fire automatically when you drift toward a downside scenario. This prevents the worst governance failure: re-entering planning mode when you should be acting. Abacum cites data showing 81% of companies lowered forward guidance then outperformed it, reinforcing why conservative baselines plus upside/downside scenarios have become a dominant approach.
Rolling forecasts beat static budgets. 80% of finance professionals agree scenario forecasting is more dynamic than traditional budgeting. A static annual budget is a snapshot that's stale by February. Rolling forecasts keep the horizon moving forward.
Cross-functional ownership is non-negotiable. Remember that data scientist shipping ML forecasts into the void? That's what happens without a RACI model. Formal governance frameworks like S&OP and IBP exist specifically to institutionalize cross-functional forecast ownership. Someone in supply chain, sales, or operations needs to own the consumption of every forecast. If nobody's accountable for acting on the numbers, the numbers don't matter. The consensus on r/supplychain is that this silo problem is endemic - and it's a governance failure, not a technical one.
AI and ML in Forecasting
Let's be honest about where AI actually helps and where it's hype.
Companies using AI in supply chain forecasting report up to 50% fewer forecasting errors and 65% fewer lost sales than their peers. Digital twins let you stress-test scenarios without disrupting live operations. Demand sensing models detect shifts weeks before traditional methods catch them. Anomaly detection flags data quality issues that humans miss in spreadsheets.
Those are real gains. But AI won't save a broken process.
If your CRM data is 30% stale, an ML model trained on that data will produce confidently wrong forecasts faster than a spreadsheet would. If nobody acts on the forecast output, a better model just produces better-ignored numbers.
The practical guidance: deploy AI where it matches the forecast type. Demand sensing works best for CPG and retail. Anomaly detection adds the most value in supply chain. NLP-based signal extraction helps financial forecasting teams monitor earnings calls and macro commentary. Keep human override for market knowledge, competitive intelligence, and new product launches where there's no training data. And invest in data quality before you invest in model complexity - the ROI is higher.
Here's the thing: if your deals average under $15K, you probably don't need an enterprise AI forecasting platform. A clean CRM, a well-governed spreadsheet process, and a weekly review cadence will get you 80% of the way there at 5% of the cost. The companies that benefit most from AI forecasting are the ones that already have their governance house in order - AI amplifies good process, it doesn't replace missing process.
Mistakes That Kill Accuracy
Driving with only the rear-view mirror. Over-reliance on historical data ignores market shifts. Incorporate leading indicators and external signals - economy, weather, competitor moves, regulatory changes. These aren't noise; they're signal. Maintain an external drivers calendar and update it monthly.
Overcomplicating models. A sophisticated model nobody understands is worse than a simple one everyone trusts. Start simple, add complexity only when it demonstrably improves accuracy. We've watched teams spend six months building an ML pipeline that performed 2% better than a well-tuned exponential smoothing model. That's not a win - that's a maintenance liability.
Set-and-forget forecasting. Forecasts decay fast. Build reforecasting cadence into the calendar, not into ad-hoc requests. Rolling forecasts with quarterly horizon extensions solve this.
Confirmation bias is the silent killer. Teams see what they want to see in the data. The fix isn't cultural - it's structural. Track bias as a formal KPI and flag persistent over- or under-forecasting. When a sales team consistently forecasts 20% above actuals, that's not optimism. That's a systematic error that governance should catch and correct.
Multiple "versions of truth." Sales says $4M, finance says $3.5M, operations planned for $4.5M. Shared platforms and regular cross-functional forecast reviews eliminate this. If three departments can't agree on the number, you don't have a forecast - you have three guesses.
Ignoring the forecast movement chart. Too many teams look at the final number without tracking how it changed over time. A forecast movement chart shows how predictions shifted across review cycles - revealing whether your team is consistently adjusting late, sandbagging early, or reacting to the same surprises quarter after quarter. Skip this if you're running a small team with short deal cycles, but for enterprise sales orgs and supply chain operations, it's essential.
Wrong aggregation level. Forecasting nationally when decisions are regional. Align granularity to the decision the forecast supports. And build a feedback loop - every forecast cycle should include a variance review that feeds the next cycle. Forecasts that go out without anyone reporting back on what happened are forecasts that never improve.
How Data Quality Drives Sales Forecasts
A VP of Sales tells the board that pipeline is $4.2M. The forecast model says the quarter will land at $3.8M. Looks solid. Except 35% of the emails in that pipeline bounce, which means a meaningful chunk of those "committed" deals are attached to contacts who never received a single outreach. The pipeline number is inflated by ghosts.
Sales forecast management depends on CRM data quality more than any other single variable. Stale contact data - bounced emails, disconnected phone numbers, people who changed jobs six months ago - inflates pipeline and makes forecasts fiction. This isn't a modeling problem. It's a data problem that no statistical method can fix.
Prospeo fixes this layer. With 143M+ verified emails at 98% accuracy and a 7-day data refresh cycle, it keeps the contact data feeding your pipeline honest. Meritt, one of Prospeo's customers, saw their bounce rate drop from 35% to under 4% and pipeline triple from $100K to $300K per week. That wasn't a forecasting upgrade - it was a data quality upgrade that made the existing forecast trustworthy.
For teams running sales forecasts off CRM data, enrichment workflows that push 50+ data points per contact back into Salesforce or HubSpot mean pipeline numbers reflect reality instead of wishful thinking. Starts free with 75 emails per month, paid plans from ~$39/mo - a fraction of what enterprise forecasting platforms charge, and it solves the problem those platforms can't.
You just read that 75% of finance teams struggle with manual data errors in forecasting. The same problem hits sales - reps waste hours updating CRM records with contacts that bounce. Prospeo enriches your CRM with 50+ verified data points per contact at a 92% match rate, giving your forecast a foundation worth trusting.
Accurate forecasts start with accurate data. Enrich your CRM for $0.01 per lead.
FAQ
What's the difference between forecasting and forecast management?
Forecasting generates a prediction - a number, a range, a probability. Forecast management is the governance, process ownership, data hygiene, and continuous improvement cycle that makes that prediction actionable. You can have great forecasts and terrible management around them. The reverse is rare.
How often should forecasts be updated?
Monthly reforecasting is a solid baseline for most businesses; high-velocity supply chains often reforecast weekly. Track data accuracy KPIs daily regardless of cadence, and complete updates several days before period-end - not on the last day.
What's a good MAPE target?
MAPE below 10% is excellent; above 25% signals serious process gaps. Segment targets by demand pattern: expect 85-95% accuracy on stable high-volume items, 75-85% on seasonal products, and 60-75% on new launches. One universal target across your portfolio masks real problems.
Can AI replace human judgment in forecasting?
AI reduces forecasting errors by up to 50% but requires clean data and governance to deliver those gains. The best setups combine ML for pattern detection and demand sensing with human override for competitive intelligence, market shifts, and new launches where no training data exists.
How does CRM data quality affect sales forecast accuracy?
Stale contacts - bounced emails, disconnected numbers, job changers - inflate pipeline and make forecasts fiction. If 30% of your pipeline contacts are unreachable, your forecast is 30% fantasy. Keeping contact data verified and refreshed on a weekly cycle is the single highest-ROI fix most sales teams can make before touching their forecasting model.