Historical Forecasting: Methods, Metrics, and Mistakes That Actually Matter
A RevOps lead we know spent three months building a demand model that looked beautiful in backtesting - 92% accuracy on historical data. First quarter in production, it missed by 34%. The model wasn't wrong. The data feeding it was.
That gap between backtested accuracy and real-world performance is where most historical forecasting projects die, and it's almost always fixable. 73% of supply chain leaders struggle with forecast accuracy due to fragmented data and reactive planning. Supply chain disruptions alone can cost businesses up to 45% of a year's profits over a decade. Bad forecasts aren't an inconvenience - they're a P&L problem.
The Short Version
- Start with ETS (exponential smoothing). It handles trend and seasonality through Holt-Winters extensions and is a strong default for most business series.
- Measure with MAE + MAPE. MAE for day-to-day work, MAPE for executive reporting. Add MASE for intermittent demand.
- You need 2 full seasonal cycles minimum. Not 60 data points, not 36. Two complete cycles of whatever seasonality you're modeling.
What Is Historical Sales Forecasting?
Historical forecasting analyzes past data - sales figures, demand volumes, revenue, web traffic - to project future values. You're looking at patterns that repeated before and betting they'll repeat again.
The core assumption is straightforward: trends, seasonality, and cycles embedded in your history contain signal about what's coming. Moving averages, exponential smoothing, and regression models all decompose historical data into components - trend, seasonal pattern, residual noise - and extrapolate forward.
One distinction worth getting right early. Forecasting and predictive analytics aren't the same thing. Forecasting produces a specific numeric estimate ("we'll sell 10,000 units next quarter"). Predictive analytics estimates probabilities or classifies outcomes ("this customer has a 73% chance of churning"). Forecasting is a subset of the broader prediction toolkit.
Most organizations move through a maturity curve: descriptive analytics (what happened?) to diagnostic (why?) to predictive (what will happen?) to prescriptive (what should we do?). Historical forecasting sits in the predictive stage. Most companies are still somewhere between descriptive and diagnostic, which is why that 73% accuracy-struggle stat exists.
Methods Compared
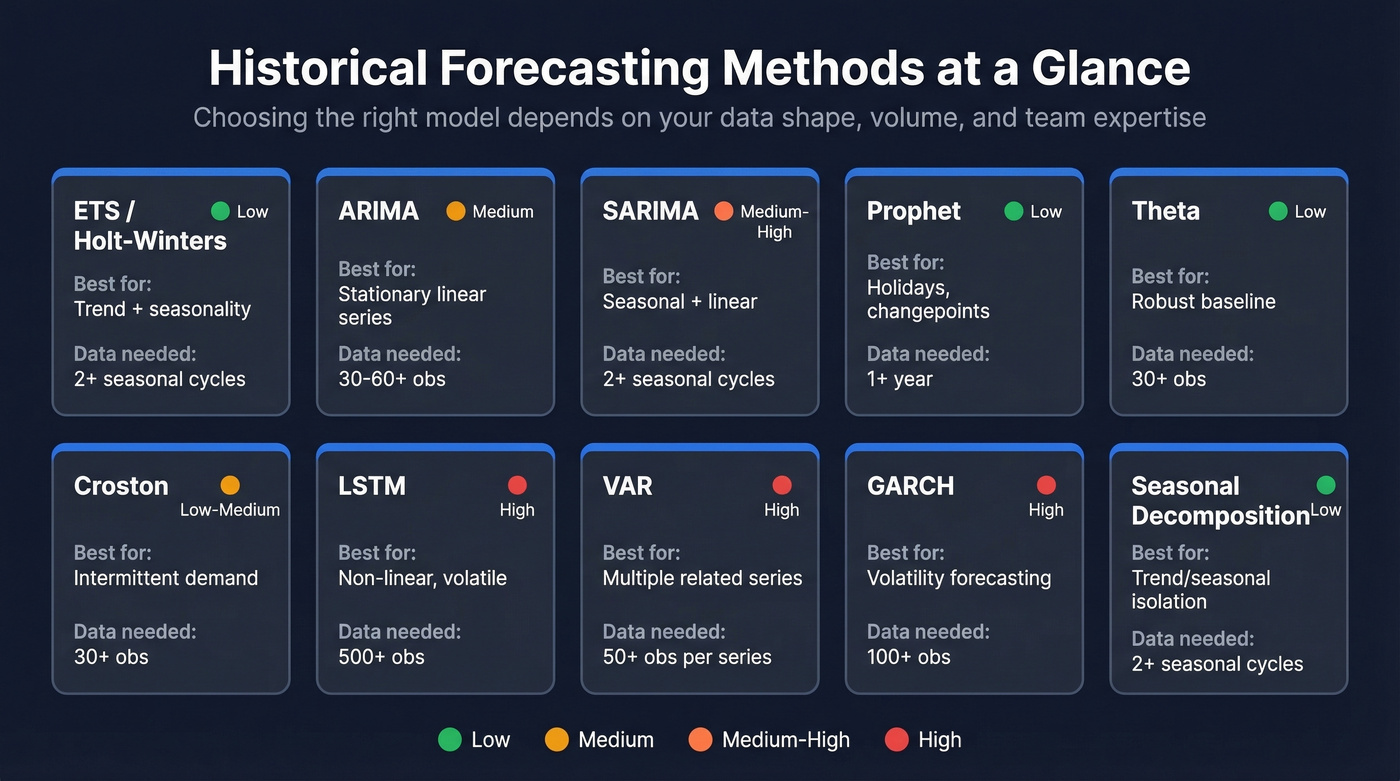
Not all methods suit all data. The right choice depends on your data's characteristics - seasonal, stationary, intermittent, or volatile - and your team's technical depth.
| Method | Best For | Data Needed | Complexity |
|---|---|---|---|
| ETS / Holt-Winters | Trend + seasonality | 2+ seasonal cycles | Low |
| ARIMA | Stationary linear series | 30-60+ observations | Medium |
| SARIMA | Seasonal + linear | 2+ seasonal cycles | Medium-High |
| Prophet | Holidays, changepoints | 1+ year of history, tolerates gaps | Low |
| Theta | Robust baseline | 30+ observations | Low |
| Croston | Intermittent demand | 30+ observations with enough non-zero events | Low-Medium |
| LSTM | Non-linear, volatile | 500+ observations | High |
| VAR | Multiple related series | 50+ observations per series | High |
| GARCH | Volatility forecasting | 100+ observations | High |
| Seasonal Decomposition | Trend/seasonal isolation | 2+ seasonal cycles | Low |
Performance ranges from the literature tell a useful story. ARIMA delivers MAPE of 3.2-13.6% on simple linear patterns. Prophet's range is wider - 2.2-24.2% MAPE - reflecting its flexibility across messy business data with strong seasonality. LSTM models show 84-87% error reduction versus ARIMA on non-linear datasets, but they need substantially more data and tuning expertise.
The Theta method deserves a mention most guides skip: it won the M3 forecasting competition, beating far more complex models. Sometimes simple wins.
Forecast horizon matters as much as data shape. Short-term forecasts (days to weeks) benefit from ML models and real-time signals like POS data or order book changes. Medium and long-term forecasts - monthly, quarterly - favor classical methods like ETS, ARIMA, and Theta, where stable seasonal patterns carry more predictive weight than noisy short-term fluctuations. Pick your method based on both your data and your planning horizon.
Which Method to Learn First
Start with ETS (exponential smoothing). It's the most intuitive classical method, it handles trend and seasonality natively through Holt-Winters extensions, and it's a strong baseline for real business data. Prophet is the natural next step - it handles holiday effects and changepoints without deep statistical expertise. ARIMA is worth learning if you have a statistical background, but its stationarity requirements and (p,d,q) parameterization make it a steeper climb for practitioners who just need a working forecast.
How Much Data Do You Need?
There's no universal minimum. The "60 data points" rule from Box-Jenkins and the "36 observations" threshold from Makridakis are both arbitrary - a well-known StackExchange discussion confirms there's no formal power test for time series sample size.
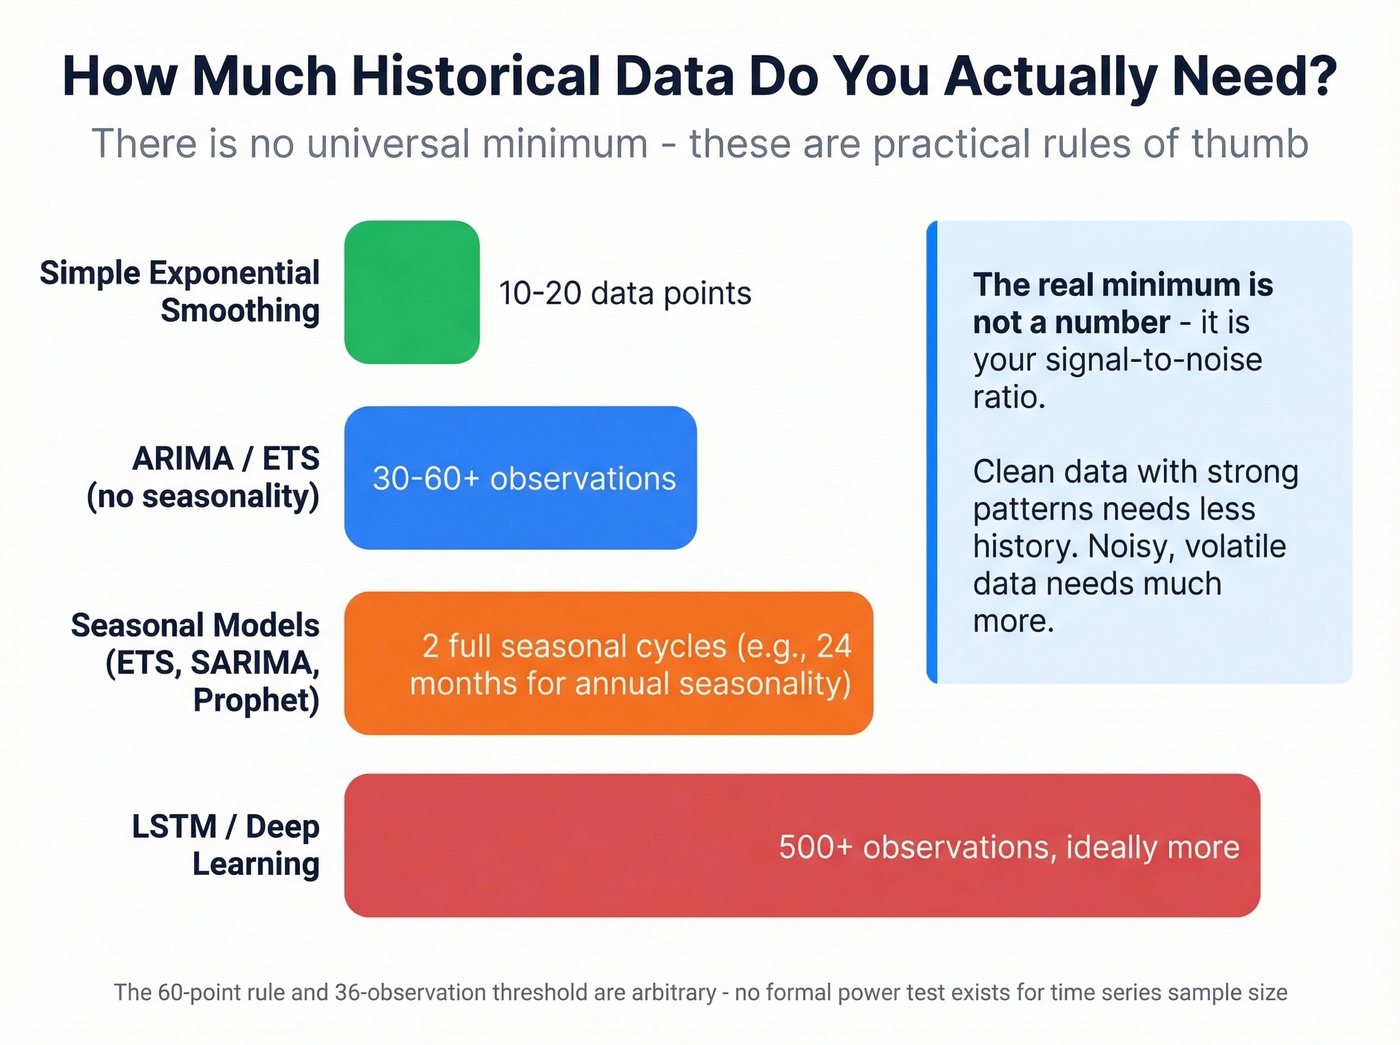
What actually matters is the signal-to-noise ratio in your data. A clean, stable series with strong seasonality can produce useful forecasts from relatively few observations. A noisy, volatile series might need hundreds of points before any pattern emerges.
These rules of thumb hold up across most use cases:
- Seasonal models (ETS, SARIMA): 2 full seasonal cycles minimum. Monthly data with annual seasonality means 24 months.
- ARIMA / ETS without seasonality: 30-60+ observations.
- Simple exponential smoothing: Can work with 10-20 data points if you tune the smoothing factor carefully.
- LSTM / deep learning: Hundreds of observations, ideally more.
Forecasting With Limited History
This pain point surfaces constantly on r/datascience - companies releasing new products yearly, sometimes with only six months of sales data, trying to apply traditional models and hitting a wall. On r/InventoryManagement, practitioners describe seasonal forecasting for new SKUs as a "guessing game," which is exactly why method selection matters here.
The workarounds require different thinking. Attribute-based similarity models let you borrow history from analogous products with the same category, price point, and launch timing. Simple exponential smoothing with a carefully tuned alpha can extract signal from short series. And don't underestimate qualitative judgment combined with Bayesian priors - expert estimates updated with incoming data often outperform purely statistical methods when history is thin.
New product forecast accuracy typically runs 50-70% in the first six months. That's not failure - that's the reality of forecasting without a track record.
That 34% miss in the intro? It started with stale data. Prospeo's 7-day refresh cycle means your pipeline data reflects reality - not a snapshot from six weeks ago. Feed your forecast models with 98% accurate contact data and watch the gap between backtest and production shrink.
Stop forecasting on data that expired before the quarter started.
How to Measure Forecast Accuracy
Here's the thing: picking the wrong accuracy metric can make a bad model look good and a good model look bad. A peer-reviewed study on forecast evaluation found that flawed evaluation practices routinely produce spurious conclusions where weak methods appear competitive. The metric you choose literally changes which model "wins."
| Metric | Formula Concept | Best For | Key Pitfall |
|---|---|---|---|
| MAPE | Mean absolute percentage error | Exec reporting | Undefined when actual = 0 |
| MAE | Mean absolute error | Day-to-day tracking | Not scale-independent |
| RMSE | Root mean squared error | High-cost-of-error contexts | Outlier-sensitive |
| MASE | MAE / naive MAE | Intermittent demand | Less intuitive |
| RMSSE | RMSE / naive RMSE | Cross-series comparison | Requires naive baseline |
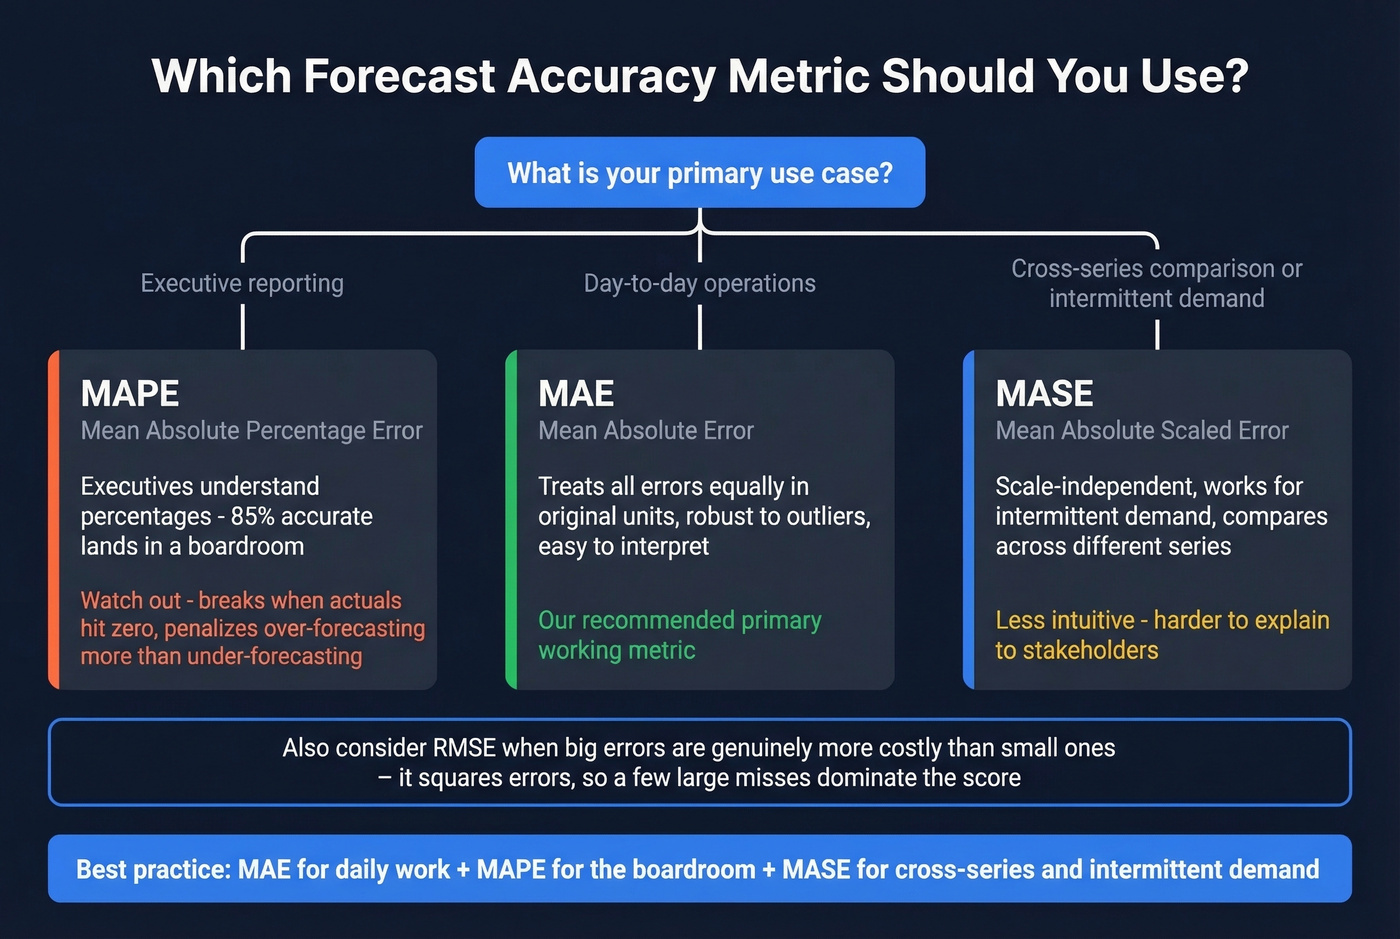
MAPE is the metric executives understand - "we're 85% accurate" lands in a boardroom. But MAPE breaks when actual values hit zero, and it's asymmetric: it penalizes over-forecasting more harshly than under-forecasting. For intermittent demand - spare parts, slow-moving SKUs - MAPE will mislead you.
MAE treats all errors equally in the original units of your data. It's robust to outliers and easy to interpret. RMSE squares errors before averaging, so a few large misses dominate the score - useful when big forecast errors are genuinely more costly than small ones.
Our recommendation: MAE as your primary working metric, MAPE for executive reporting, and MASE when comparing across series with different scales or intermittent demand patterns.
What Good Accuracy Looks Like
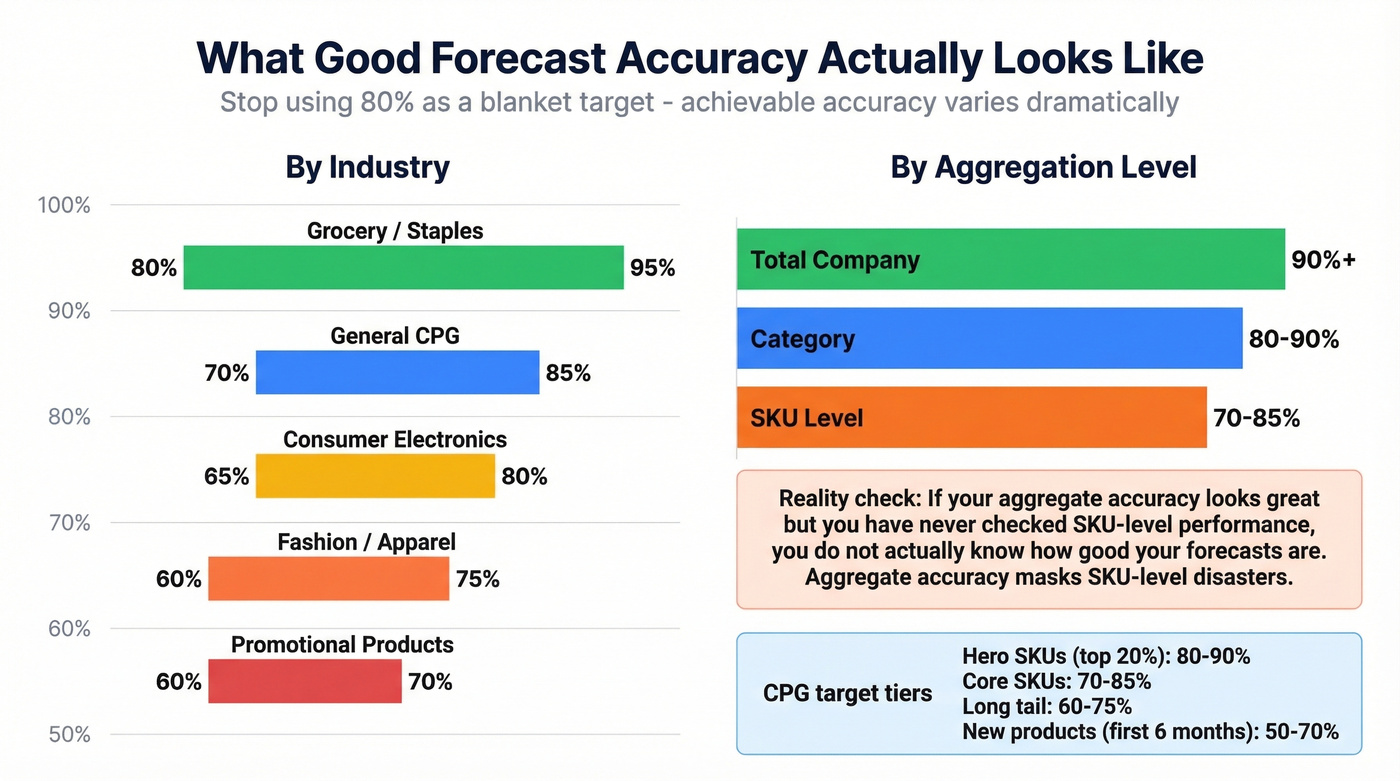
The most common mistake in setting accuracy targets is picking a blanket number - usually 80-85% - and applying it across the entire portfolio. Achievable accuracy varies dramatically by what you're forecasting and at what granularity.
By industry:
| Industry | Typical Accuracy |
|---|---|
| Grocery / Staples | 80-95% |
| General CPG | 70-85% |
| Consumer Electronics | 65-80% |
| Fashion / Apparel | 60-75% |
| Promotional Products | 60-70% |
By aggregation level:
| Level | Typical Accuracy |
|---|---|
| Total Company | 90%+ |
| Category | 80-90% |
| SKU | 70-85% |
The pattern is intuitive: the more you aggregate, the more individual errors cancel out. Company-level forecasts look great. SKU-level forecasts for fashion items in their first season? You're doing well at 65%.
For CPG teams, segmenting targets by product tier makes the most sense. Hero SKUs (top 20% by volume) should hit 80-90%. Core SKUs target 70-85%. Long-tail items realistically land at 60-75%. New products in their first six months? 50-70% is the benchmark, not a failure.
Let's be honest about something we've seen repeatedly: if your aggregate accuracy looks great but you've never checked SKU-level performance, you don't actually know how good your forecasts are. Aggregate accuracy masks SKU-level disasters. Those high-margin products that are wildly off? Those are the ones where forecast error actually costs money.
7 Mistakes That Kill Accuracy
1. Over-reliance on history without external factors. Historical models assume the future resembles the past. When market shifts, competitor launches, or regulatory changes hit, your rear-view mirror breaks. Build in external signals - even qualitative ones - alongside your time series.
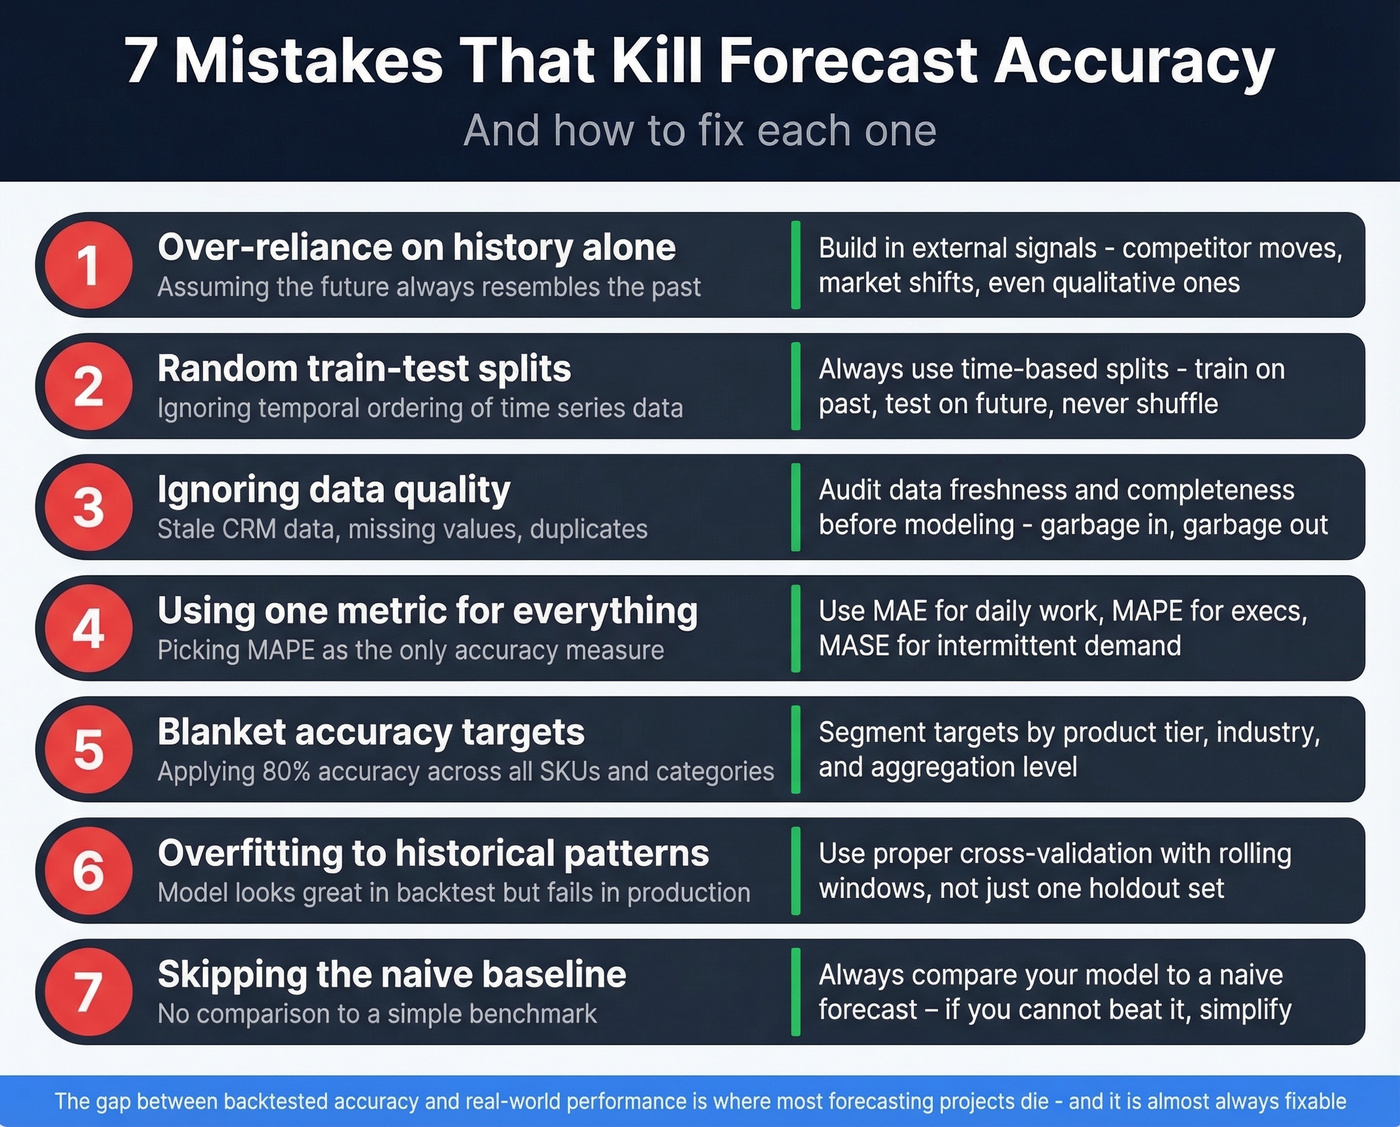
2. Random train-test splits and sneaky feature leakage. This is the most common technical error we encounter. Time series data has temporal ordering. Randomly splitting it into train and test sets causes data leakage - your model "sees" future data during training. Always use time-based splits: train on earlier periods, test on later ones. This includes computing rolling averages or lag features before splitting, because the features themselves leak future information.
3. Ignoring stationarity assumptions. ARIMA requires stationary data. If your series has a trend or changing variance and you don't difference or transform it first, the model's parameter estimates are unreliable. Check stationarity before fitting. Skip this step and nothing downstream matters.
4. Overfitting on limited data. More parameters don't mean better forecasts. A complex model trained on 18 months of data will memorize noise, not learn patterns. When data is limited, simpler models almost always generalize better.
5. Using a single accuracy metric. MAPE alone can hide systematic bias. RMSE alone lets a few outliers dominate. We've seen teams declare a model "production-ready" based on one metric that happened to look good - the same peer-reviewed study documents how this produces spurious conclusions. Use at least two complementary metrics, and always include prediction intervals in executive reporting. A point estimate without a range is a guess dressed up as precision.
6. Static forecasts instead of rolling. A forecast made in January for the full year becomes stale by March. Rolling forecasts that incorporate new data each period keep your projections aligned with reality.
7. Never checking accuracy post-deployment. Models drift as patterns change. If you aren't monitoring forecast accuracy in production - comparing predictions to actuals on a regular cadence - you won't know your model has degraded until the business feels it.
Bad input data is the silent killer underneath all seven of these mistakes. If your sales forecast relies on CRM pipeline data full of bounced emails and outdated contacts, the numbers you're projecting against don't reflect reality. Tools like Prospeo keep contact data verified with a 98% email accuracy rate and a 7-day refresh cycle, so the pipeline stages feeding your forecast model represent reachable prospects rather than stale records.
When Past Data Isn't Enough
Historical methods work beautifully for stable markets with predictable seasonality. They break down when the world changes - regime shifts, black swan events, structural disruptions with no precedent in your data.
The practical answer is a hybrid approach. Use historical forecasting for medium and long-term planning where patterns are stable, augmented with ML models for short-term volatile signals incorporating real-time inputs like POS data, weather, and economic indicators. Gartner predicts 70% of large organizations will adopt AI-based supply chain forecasting by 2030, but only 23% have a formal AI strategy today. Organizations that have invested report revenue growth 61% greater than peers.
Don't abandon time-tested methods. Start layering in external signals where your data supports it.
Tools for Getting Started
You don't need expensive software to start. The best tool is the one your team will actually use.
Free and open-source: Excel handles basic forecasting natively with Microsoft's FORECAST function. Python's statsmodels and scikit-learn cover everything from ARIMA to ML. R's forecast package is the gold standard for classical time series. Prophet is free and purpose-built for business forecasting with holidays and changepoints.
Paid platforms: Tableau adds visual forecasting on top of BI. Salesforce Forecasting and HubSpot Forecasting embed pipeline-based forecasting into CRM workflows - Salesforce customers using pipeline forecasting tools saw a 15% improvement in forecast accuracy, and HubSpot customers saw a 23% improvement.
The bridge most teams miss: your forecast model is only as good as the pipeline data feeding it. For sales teams whose forecasts depend on weighted pipeline data, contact accuracy is a forecasting input. Prospeo's 300M+ professional profiles with 98% email accuracy and 7-day data refresh keep CRM records clean, so the deal values you're forecasting against reflect real, reachable prospects.
If you're evaluating sales forecasting solutions or sales forecasting tools, make sure they can ingest clean pipeline inputs.
Historical forecasting only works when your CRM reflects what's actually happening. Prospeo enriches your pipeline with 50+ data points per contact at a 92% match rate - giving your models the clean, current signal they need instead of noise from decayed records.
Clean pipeline data in, accurate forecasts out. It's that simple.
FAQ
What's the difference between historical forecasting and predictive analytics?
Historical forecasting produces a specific numeric estimate of a future value ("10,000 units next quarter"), while predictive analytics estimates probabilities or classifies outcomes ("73% churn risk"). Forecasting is a subset of the broader prediction toolkit, focused on point estimates with confidence intervals.
How much historical data do I need for accurate forecasts?
For seasonal models like ETS or SARIMA, you need at least 2 full seasonal cycles - 24 months of monthly data with annual seasonality. ARIMA needs 30-60+ observations, while LSTM models typically require 500+. Signal-to-noise ratio matters more than any fixed threshold.
Why are my sales forecasts consistently inaccurate?
The top culprits are over-reliance on past patterns without external context, blanket accuracy targets applied across all SKUs, and poor CRM data quality. Cleaning outliers, identifying regime changes, and segmenting accuracy targets by product volatility often fixes the problem before any model tuning is needed.
Which forecasting method should a beginner learn first?
Start with ETS (exponential smoothing). It's intuitive, handles trend and seasonality natively through Holt-Winters extensions, and serves as a strong baseline for most real-world business data. Prophet is the natural next step for handling holiday effects and changepoints without deep statistical expertise.
How can I improve forecast accuracy with better data?
Layer verified, up-to-date CRM data into your pipeline-weighted forecasts. Clean inputs consistently improve forecast reliability by 10-20%, and the effort is far less than rebuilding your model from scratch.