How to Calculate a Conversion Rate: Formula, Benchmarks, and Real Examples
Your CMO asks for last month's conversion rate. Simple question - except you could report the website form rate, the paid ads rate, the trial-to-paid rate, or the blended number across all channels. Each tells a different story.
So how do you calculate a conversion rate that actually means something?
Here's the uncomfortable truth: conversion rate without volume and average order value is a vanity metric. A 10% conversion rate on 200 visitors isn't a win. Let's make sure you're calculating - and interpreting - the right number.
The Quick Formula
Conversion Rate = (Conversions / Total Visitors) x 100
Example: 50 purchases from 2,000 visitors = 2.5% conversion rate.
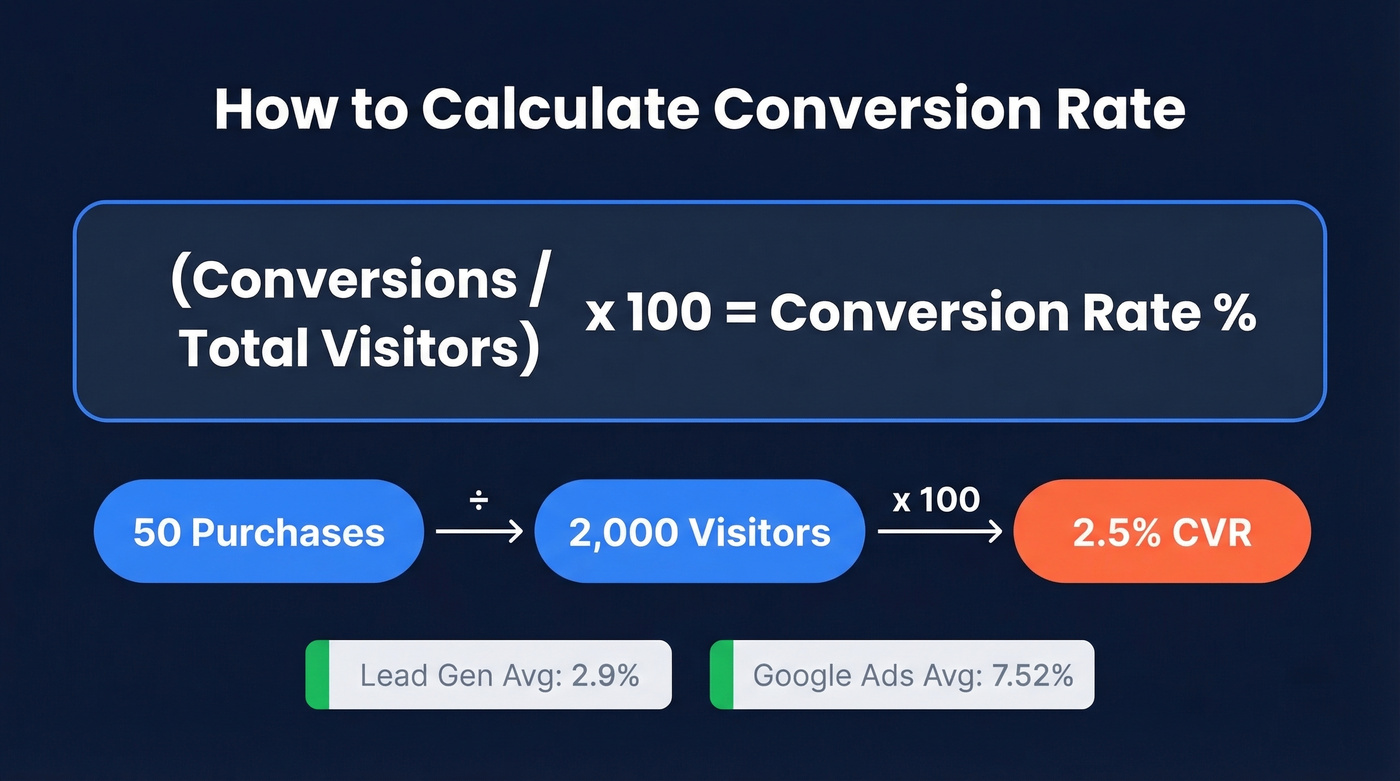
The average sits around 2.9% for lead gen and 7.52% for Google Ads - but context matters more than the number itself.
Conversion Rate Formula With Examples
The formula is dead simple. What trips people up is defining "conversion" for their business model. A conversion is whatever action you're optimizing for - a purchase, a trial signup, a demo request, a phone call. The denominator changes too: total visitors, unique users, clicks, or sessions depending on the platform.
Ecommerce: Your store gets 2,000 visitors in a week. 50 people buy something. That's 50 / 2,000 x 100 = 2.5% conversion rate.
SaaS trial signup: Your landing page pulls 8,000 visitors in a month. 120 start a free trial. That's 120 / 8,000 x 100 = 1.5%. The denominator is total visitors, not just people who scrolled past the fold.
Paid ads: Your Google Ads campaign drives 1,935 clicks and 57 people convert. That's 57 / 1,935 x 100 = 2.95%. Here the denominator is clicks, not impressions - an important distinction we'll revisit in the mistakes section.
The formula never changes. What changes is what you count as a conversion and what you use as the denominator. Get those two definitions locked before you start benchmarking, or you'll compare apples to invoices.
2026 Benchmarks by Industry
"2-5% is a good conversion rate" is the kind of advice that sounds helpful and tells you nothing. A 2% rate is excellent for luxury real estate leads and terrible for a restaurant running Facebook ads.
Why Conversion Rate Alone Lies
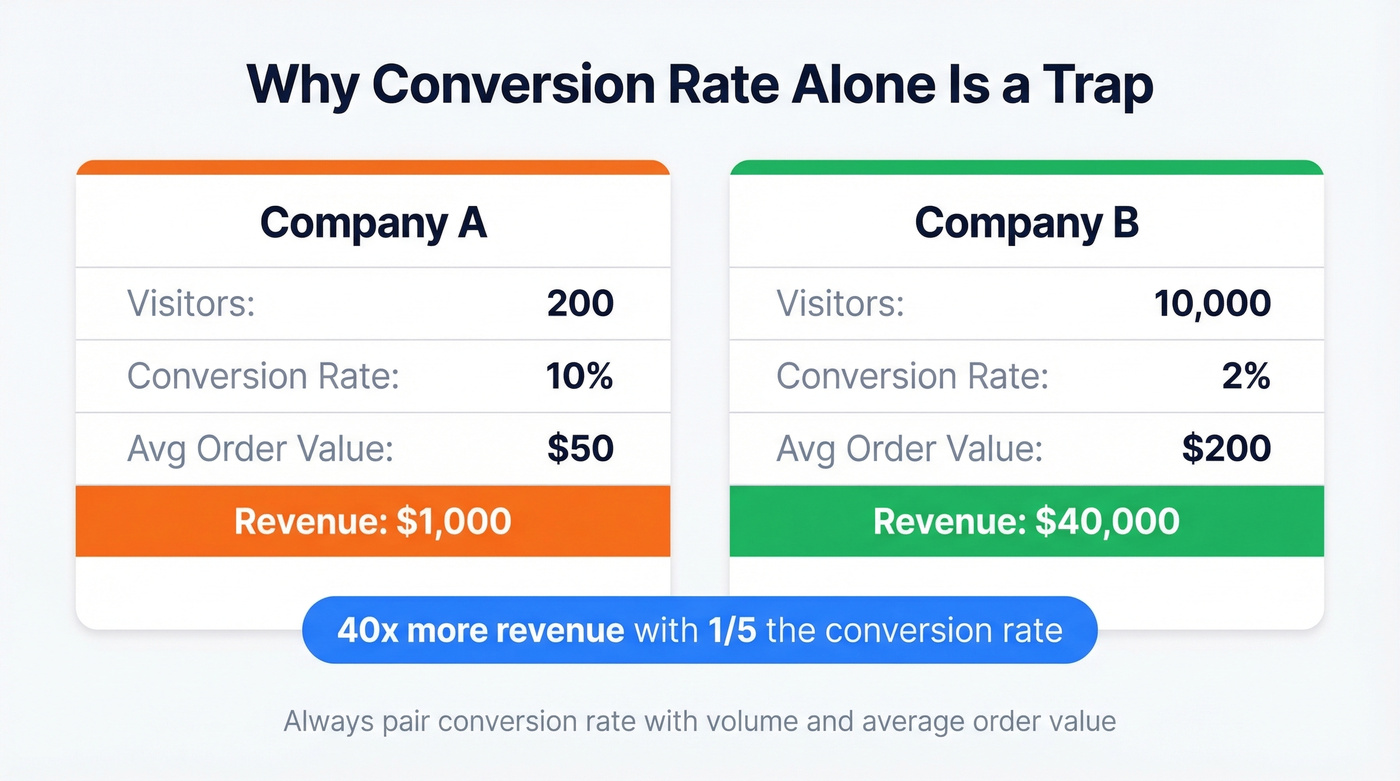
We promised this in the intro, so here's the proof. Company A converts at 10% - impressive on paper. Company B converts at 2% - looks mediocre. But watch what happens when you add volume and average order value:
| Company A | Company B | |
|---|---|---|
| Visitors | 200 | 10,000 |
| CVR | 10% | 2% |
| AOV | $50 | $200 |
| Revenue | $1,000 | $40,000 |
Company B generates 40x the revenue with one-fifth the conversion rate. This is why benchmarking conversion rate in isolation is a trap. Always pair it with volume and value.
By Industry (Lead Gen)
Ruler Analytics analyzed 100M+ data points across 14 industries and found an average qualified-lead conversion rate of 2.9% - a 1.7% form rate and a 1.2% call rate.
High-ticket industries like legal, financial services, and enterprise software consistently convert below that average. The sales cycle is longer, the consideration phase is deeper, and the visitor-to-lead gap is wider by design. Don't panic if you're at 1.2% selling six-figure contracts.
By Channel (Paid Media)
Paid media benchmarks look dramatically different from organic because you're measuring against clicks, not raw visitors. WordStream's latest benchmark data tells a clear story:
| Channel | Avg CVR | Avg CPL |
|---|---|---|
| Google Ads | 7.52% | $70.11 |
| Facebook Ads | 7.72% | $27.66 |
The industry spread is massive. Automotive Repair hits 14.67% on Google Ads. Finance & Insurance limps in at 2.55%. On Facebook, Restaurants convert at 18.25% while Furniture sits at 3.77%. The "average" is almost meaningless - your industry vertical matters far more.
By Device (Ecommerce)
Dynamic Yield's dataset - aggregated across 200M+ monthly unique users, 400+ brands, and 300M+ total sessions - reveals a persistent gap:
| Metric | Mobile | Desktop | Overall |
|---|---|---|---|
| Conversion Rate | 2.8% | 3.2% | 2.9% |
| [Cart Abandonment](https://www.emarketer.com/content/cart-abandonment-benchmark - which-categories-have-highest-lowest-rates) | 79.0% | 68.1% | 76.2% |
| Traffic Share | ~75% | ~25% | - |
Desktop converts roughly 1.7x mobile. The sector spread adds another layer: Food & Beverage leads at 4.9%, while Home & Furniture trails at 1.4%. Shopify cites 2.5-3% as a typical ecommerce baseline. If you're in that band, you're normal. Below 2%, there's a friction problem worth investigating.
Your conversion rate formula is only as good as the leads feeding it. Teams using Prospeo's 98% verified emails see bounce rates drop below 4% - turning more of that funnel math into real pipeline revenue.
Better data in, better conversion rates out. Start free today.
How to Find Conversion Rate in GA4
Google renamed "conversions" to "key events" and "conversion rate" to "key event rate" in GA4. If you've been searching for "conversion rate" in your reports and coming up empty, that's why. The rename broke every existing tutorial and confused teams who'd been using GA4 for years.
GA4 gives you two distinct metrics:
Session key event rate = sessions with a key event / total sessions. Use this for evaluating landing pages and ad campaigns - it tells you how well a specific page or traffic source converts per visit.
User key event rate = users who triggered a key event / total users. Use this for audience-level reporting over time.
The difference matters. If a converted user returns in a later session without converting again, the session rate drops but the user rate stays "converted."
One practical gotcha: key event rate isn't always visible by default in GA4 standard reports. You'll often need to manually add it as a metric through report customization. It's a two-minute fix, but it catches people off guard.
Your attribution window setting (1-day, 7-day, 30-day) directly affects reported rates too. A 7-day click window will always show fewer conversions than a 30-day window for the same campaign. If your GA4 numbers don't match your ad platform, check the attribution window first.
B2B Funnel Conversion Rates
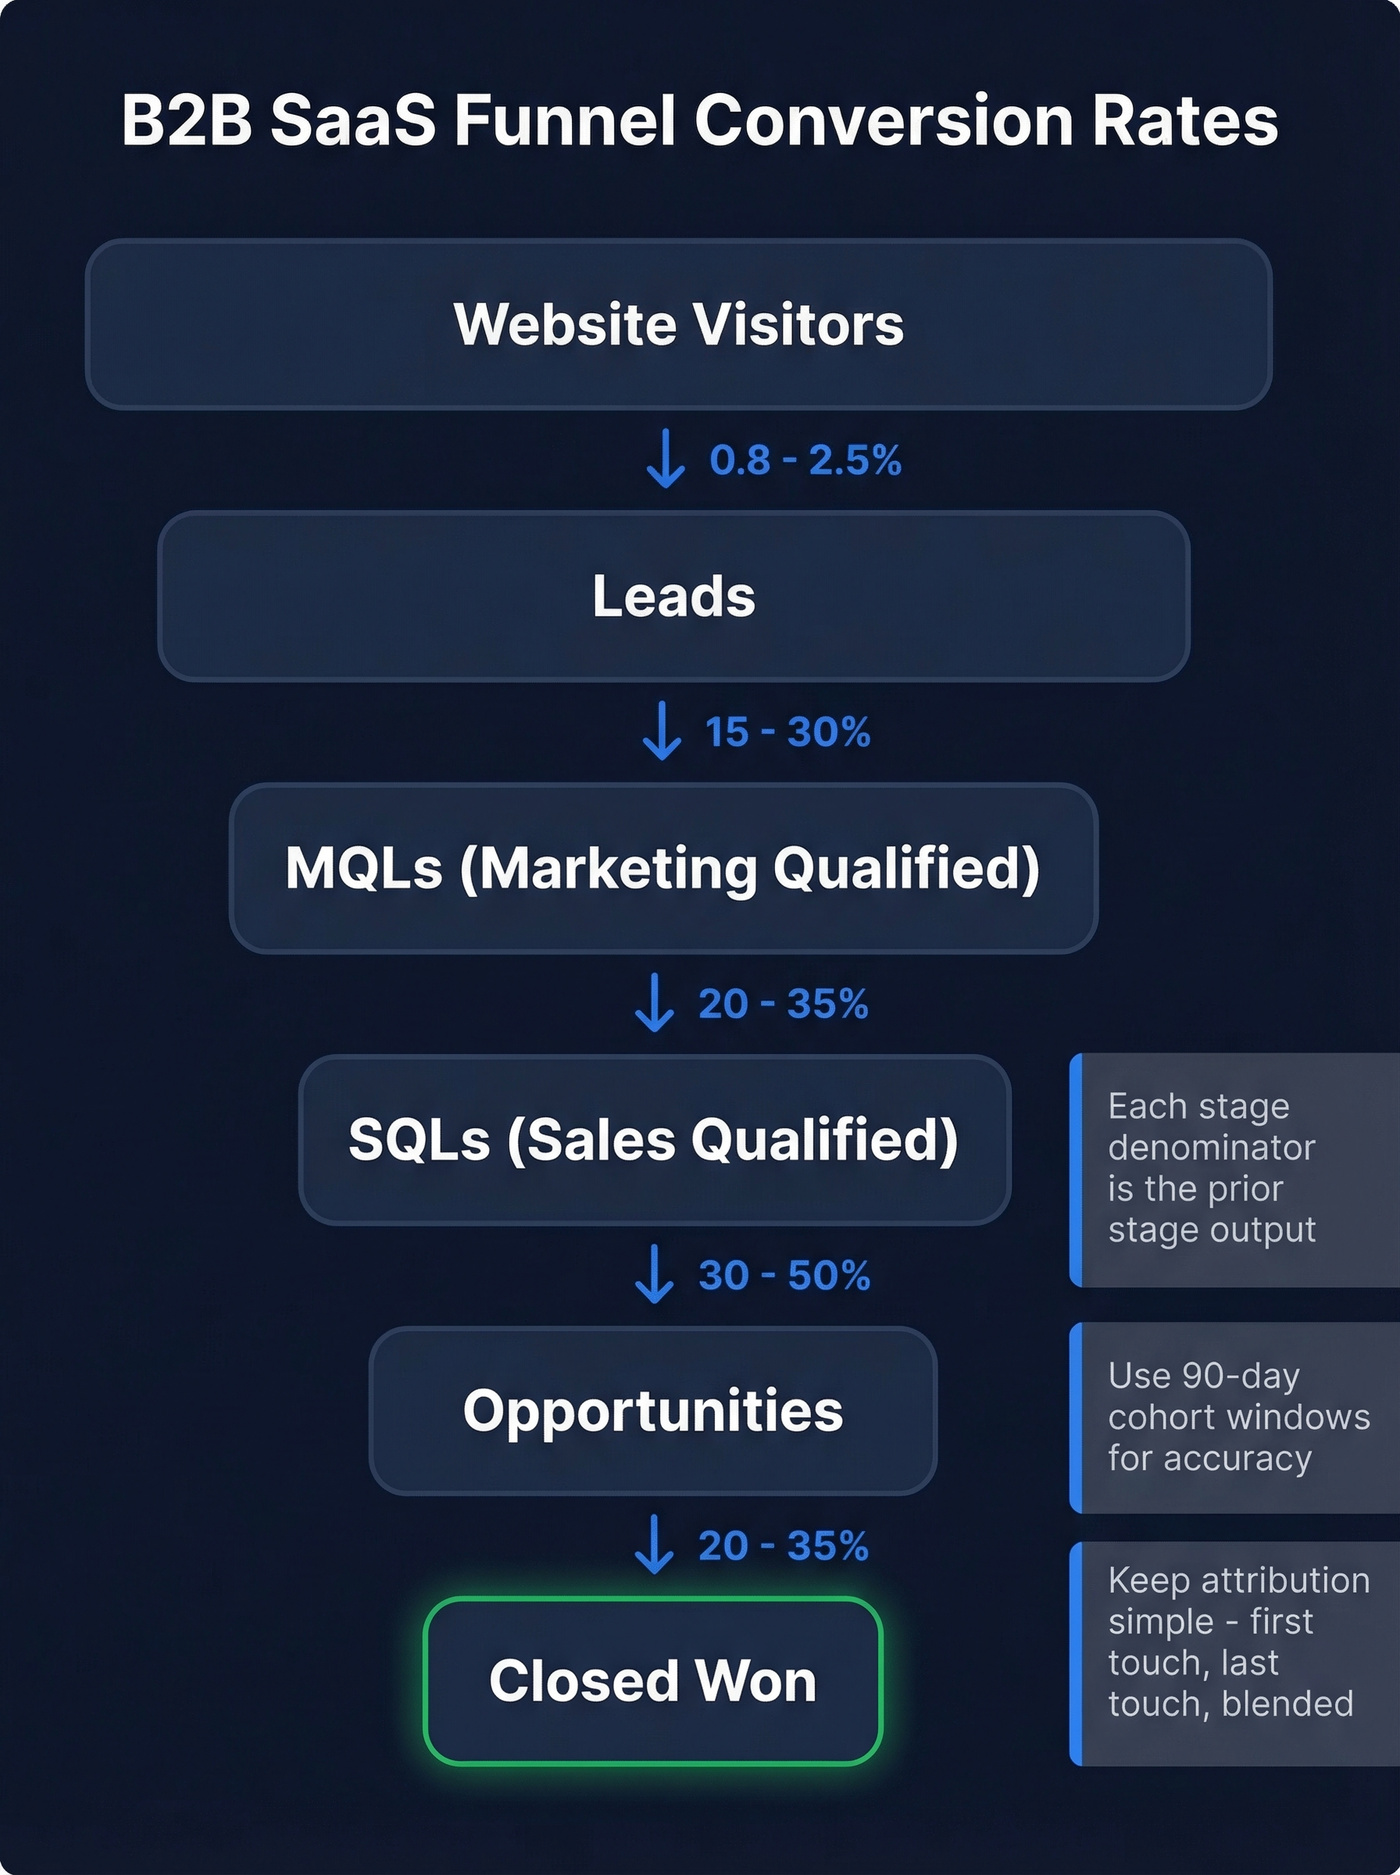
B2B doesn't have "one conversion rate." You're tracking a chain: visitor to lead to MQL to SQL to opportunity to closed-won. Each stage has its own formula, and each uses the prior stage as the denominator. Understanding the conversion rate at each stage is what separates useful reporting from vanity dashboards.
| Funnel Stage | B2B SaaS | Prof. Services | Manufacturing |
|---|---|---|---|
| Visitor to Lead | 0.8-2.5% | 1-3% | 0.7-2.0% |
| Lead to MQL | 15-30% | 20-40% | 10-25% |
| MQL to SQL | 20-35% | 25-40% | 15-30% |
| Trial to Paid | 8-20% | - | - |
| SQL to Opportunity | 30-50% | 30-50% | 35-55% |
| Opportunity to Won | 20-35% | 25-40% | 25-45% |
Three rules that prevent bad data from polluting these numbers:
- Denominators must be clear. Each stage's denominator is the prior stage's output, not total website visitors. Dividing closed-won deals by website visitors gives you a number so small it's demoralizing and useless.
- Use 90-day cohort windows. B2B sales cycles are long enough that monthly snapshots create misleading trends. A March cohort that closes in June shouldn't inflate June's conversion rate.
- Keep attribution simple. First-touch, last-touch, and a blended view are enough. Over-engineered attribution models create more arguments than insights.
Common Calculation Mistakes
1. Your Google Ads number doesn't match your manual math. Look, this isn't a bug - it's a feature you were never told about. One Reddit user reported Google Ads showing a 1.20% conversion rate while their manual calculation yielded 8.36%. Another saw 57 conversions on 1,935 clicks - 2.95% manually, but Google reported 1.89%. Modeled conversions, consent mode adjustments, and different denominators all create gaps between platform reporting and naive division.
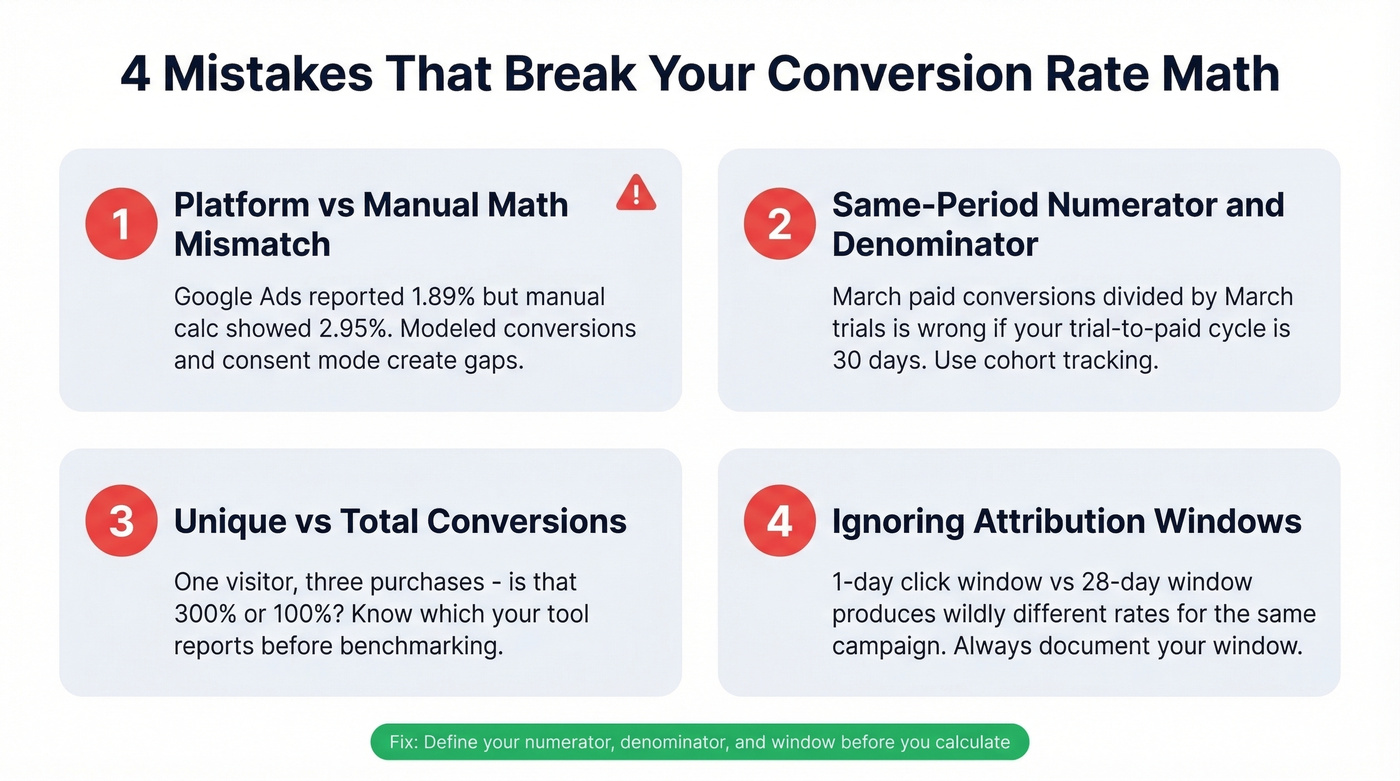
2. Same-period numerator/denominator in SaaS. If your trial-to-paid conversion takes 30 days on average, you can't divide March's paid conversions by March's trial signups and get a meaningful number. Those March conversions came from February's or January's trials. Use cohort-based tracking with a defined conversion window - say, activation within 14 days of signup - or your trends will be fiction.
3. Unique vs. total conversions. If one visitor makes three purchases in a session, is that a 300% conversion rate or 100%? Depends on whether you're counting unique or total conversions. Most reporting defaults to total. Make sure you know which one you're looking at before you benchmark against industry averages that use unique.
4. Ignoring attribution windows. A 1-day click attribution window and a 28-day window will produce wildly different conversion rates for the same campaign. Mobile and app marketers get burned by this constantly. Always document which window you're using when reporting, or quarter-over-quarter comparisons become meaningless.
How to Improve Your Rate
The highest-leverage CRO moves tend to be embarrassingly simple. Expedia increased annual profit by $12M by removing a single form field from their checkout. Travel company Going saw a 104% month-over-month lift from changing CTA copy alone. Testimonials, when placed strategically, can lift conversion rates by 34%. Unbounce's analysis of 20,000+ landing pages found an inverse relationship between on-page links and conversion rate - fewer exits, more conversions.
Our hot take: most teams obsess over on-page CRO when their biggest conversion rate problem is upstream. For ecommerce, it's traffic quality. For outbound, it's data quality.

If 15%+ of your outbound list bounces, your domain reputation degrades, deliverability drops, and reply rates crater - making every downstream conversion rate look worse than it should. We've seen this pattern repeatedly with teams who switch to Prospeo's verified email data: bounce rates drop from 30-40% to under 5%, and suddenly the "conversion rate problem" fixes itself because emails are actually landing in inboxes. The free tier gives you 75 email verifications plus 100 Chrome extension credits per month, enough to audit whether your current data provider is the bottleneck.
For a quick sanity check, you can build a simple conversion rate calculator in any spreadsheet: put conversions in cell A1, total visitors in B1, and use =A1/B1*100 in C1. No fancy tools needed for the math - the hard part is always getting the inputs right.
B2B funnel conversion rates collapse when contact data is stale. Prospeo refreshes 300M+ profiles every 7 days - not the 6-week industry average - so your MQL-to-SQL and SQL-to-opportunity rates reflect real buyer engagement, not dead leads.
Stop dividing by garbage. Get data that actually converts.
FAQ
How do you calculate a conversion rate?
Divide the number of conversions by total visitors (or clicks, or sessions), then multiply by 100. For example, 50 purchases from 2,000 visitors equals a 2.5% conversion rate. The key is defining what counts as a "conversion" and choosing the right denominator for your context.
What's the sales conversion rate formula?
The sales conversion rate formula is: (closed deals / total leads) x 100. If your team closes 15 deals from 200 qualified leads, your sales conversion rate is 7.5%. Apply this same structure at any funnel stage - just swap in the relevant numerator and denominator.
What's the difference between conversion rate and click-through rate?
Click-through rate measures clicks divided by impressions - it tells you if your ad or email got attention. Conversion rate measures completed actions divided by total visitors or clicks. CTR captures interest; conversion rate captures follow-through. You need both, but conversion rate is closer to revenue.
Can conversion rate exceed 100%?
Yes, when you count total conversions rather than unique conversions and a single user can convert multiple times. If one visitor makes three purchases in a session, that's technically 300% for that session. Switch to unique conversions for cleaner benchmarking.
How does bad data hurt outbound conversion rates?
Bounced emails above 5% degrade your sender reputation, tanking deliverability and every downstream metric. Clean, verified contact data keeps bounce rates under control and ensures your outreach actually reaches inboxes. It's the cheapest conversion rate optimization most outbound teams overlook.