Average Deal Size: How to Calculate, Benchmark, and Actually Use It
A sales rep hit $1.3M in quota last year selling $280k average orders. Then he moved teams. Same company, same quota - but now the deals run $30-70k each. His words on Reddit: "The math isn't adding up." Meanwhile, another team's dashboard shows average deal size climbing 40% quarter over quarter. Sounds great - until one $500k whale is dragging the mean up while the forecast keeps missing.
Both problems trace back to the same metric, measured wrong.
What You Need (Quick Version)
The formula: Total Revenue / Number of Closed Deals = Average Deal Size
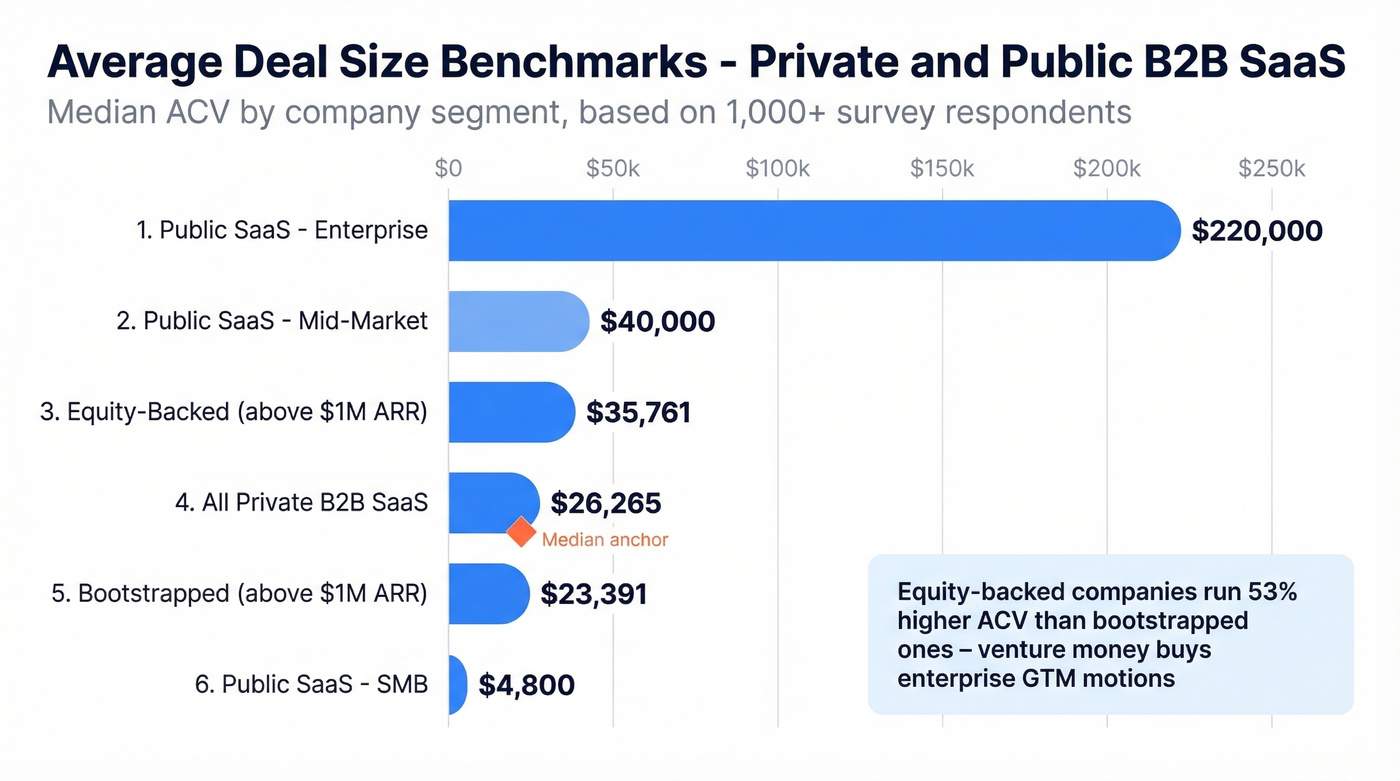
The benchmark anchor: Private SaaS median ACV is $26,265 across 1,000+ survey respondents.
The one-line opinion: Track median deal size, not just the mean. One whale deal will wreck your forecast.
What Does This Metric Actually Measure?
Average deal size captures the typical revenue generated per closed deal over a given period. Simple enough - but the definition breaks down fast if you don't decide what counts as a "deal."
Are you measuring bookings or recognized revenue? Total contract value or annualized contract value? Do renewals count? Expansions? What about refunded deals? There's no universal right answer, but there's a wrong one: mixing them. If your Q1 number includes a 3-year prepaid enterprise contract at full TCV alongside monthly self-serve subscriptions at ACV, your average is meaningless. Pick one definition, document it, stick with it.
ADS isn't the same as ACV, which refers specifically to the annualized value of a subscription contract. It's also not AOV, an e-commerce metric. ADS is broader - it's whatever your closed-won deals are worth, measured however you've defined "worth."
Formula and Examples
Average Deal Size = Total Revenue from Closed Deals / Number of Closed Deals
Transactional: Your team closes 200 deals in Q1 worth $400,000 total. ADS = $2,000.
Subscription (ACV): You close 15 annual contracts worth a combined $750,000 in ACV. ADS = $50,000.
Mixed with discount: A rep closes a 2-year deal listed at $120,000 but gives a 15% discount. Bookings-based ADS uses $102,000. Revenue-based ADS uses $51,000 - one year of recognized revenue. Same deal, very different numbers.
For multi-year prepays, annualize. A $300k 3-year contract becomes $100k ACV. This keeps your ADS comparable across deal structures.
Mean vs. Median - Why Your Average Lies
"Average" usually means "mean," and the mean is a terrible measure when your deal sizes vary widely. One $500k enterprise contract in a quarter of $20-40k mid-market deals will pull your mean up by thousands, making your pipeline look healthier than it is.
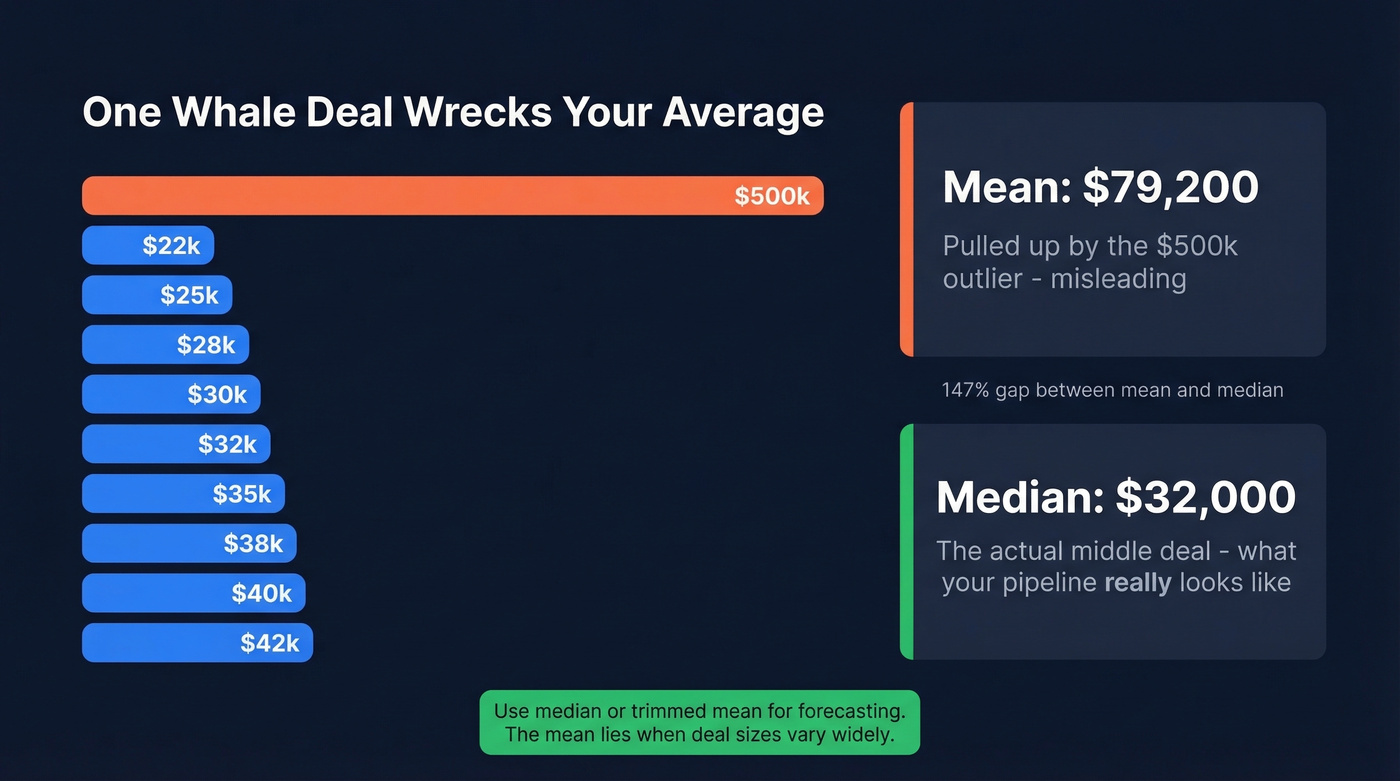
Fix this by using median deal size - the middle value when deals are ranked by size - or a trimmed mean that excludes the top and bottom 10%. As Monetizely recommends, median gives you a more honest picture of what a "typical" deal actually looks like.
We've seen teams celebrate a rising ADS that was entirely driven by two outlier contracts while their core mid-market motion was actually shrinking. Segment your ADS by new business vs. expansion, by rep, by vertical, and by product line. A single blended number hides the shifts that matter most.
Here's the thing: make your ADS predictable before trying to increase it. If you’re tightening your process, it helps to map the rest of your funnel metrics alongside deal size.
Predictable deal size starts with predictable pipeline. If you need 104 opps to hit quota, you can't afford 35% bounce rates torching your outreach. Prospeo delivers 98% email accuracy and 125M+ verified mobiles - so every conversation counts toward your number.
Stop losing deals to bad data. Build pipeline that actually converts.
Benchmarks With Real Data
The figures below are dataset-backed. Private-company figures come from SaaS Capital's survey of 1,000+ private B2B SaaS respondents. Public-company anchors come from SaaStr's analysis.
| Segment | Median ACV |
|---|---|
| All private B2B SaaS | $26,265 |
| Bootstrapped (>$1M ARR) | $23,391 |
| Equity-backed (>$1M ARR) | $35,761 |
| Public SaaS - SMB | ~$4,800 |
| Public SaaS - Mid-market | ~$40,000 |
| Public SaaS - Enterprise | ~$220,000 |
Among companies above $1M ARR, equity-backed ones run 53% higher ACV than bootstrapped. That gap isn't surprising - venture money buys longer sales cycles and enterprise GTM motions - but it's useful context if you're benchmarking against "SaaS averages" without filtering for funding stage.
The $5-10M ARR band actually saw ACV decrease from $33,704 to $30,592 year over year: growth doesn't always mean bigger deals. Sometimes companies in that range add volume at lower price points to hit their number.
One interesting wrinkle: companies with NRR between 110-120% have lower median ACV than those at 100-110%. High retention doesn't require large deals. It requires sticky ones. If you want to pressure-test this, pair it with a clean churn analysis.
For reference, one enterprise seller on Reddit reports $250k average deals enterprise-side and $100k mid-market. A RepVue screenshot puts Google Cloud and Workday at $500k+ average deal sizes. Those are outliers, not benchmarks.
Benchmarkit data adds more context: median NRR sits at 101%, with expansion ARR representing 40% of total new ARR and median S&M cost at $2.00 per $1.00 of new ARR (up 14% year over year). If your CAC is climbing, increasing deal value is one of the few levers that directly improves unit economics - especially when you’re tracking cost to acquire customer alongside ACV.
Quota Math: Does Your Pipeline Add Up?
Back to that Reddit rep. He's got a $1.3M quota and deals now average $50k.
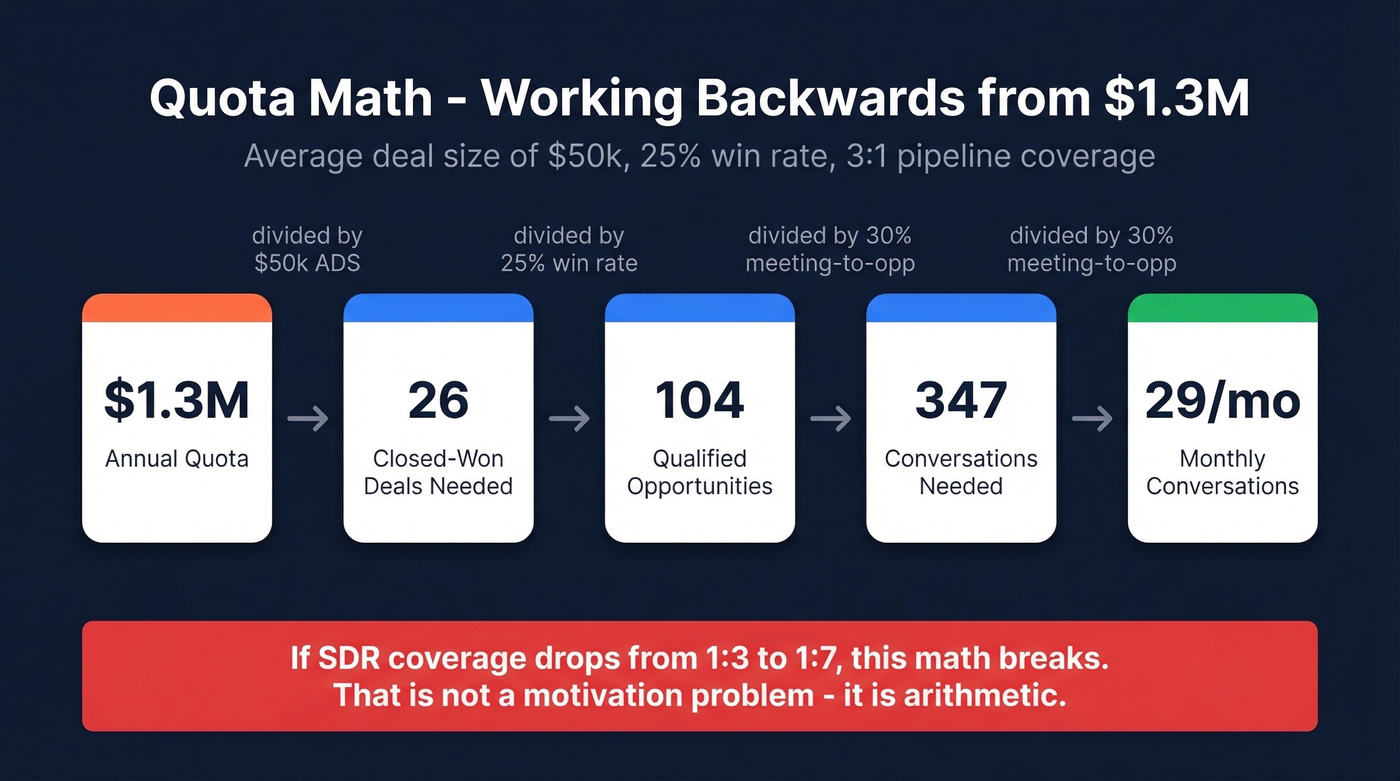
- Required closed-won deals: $1,300,000 / $50,000 = 26 deals
- Required opportunities (25% win rate): 26 / 0.25 = 104 opps
- Required pipeline (3:1 coverage): $1,300,000 x 3 = $3.9M
- Required conversations (30% meeting-to-opp rate): ~347, about 29/month
That's 104 qualified opportunities a single rep needs in a year - roughly 8-9 new opps per month. The thread's SDR coverage dropped from 1 SDR per 3 AEs to 1 SDR per 6-7 AEs. The pipeline math can't work. That's not a motivation problem. It's arithmetic.
Let's be honest: if your deals average under $25k and your quota is above $1M, you need either a product-led funnel or an SDR army. The math gets ugly fast without one of those. Run this calculation before you blame the team - knowing your pipeline requirements upfront prevents quota plans that look reasonable on a spreadsheet but collapse in execution. If you’re diagnosing gaps, start with pipeline health and the most common sales pipeline challenges.
Deal Size, Cycle Time, and Win Rate
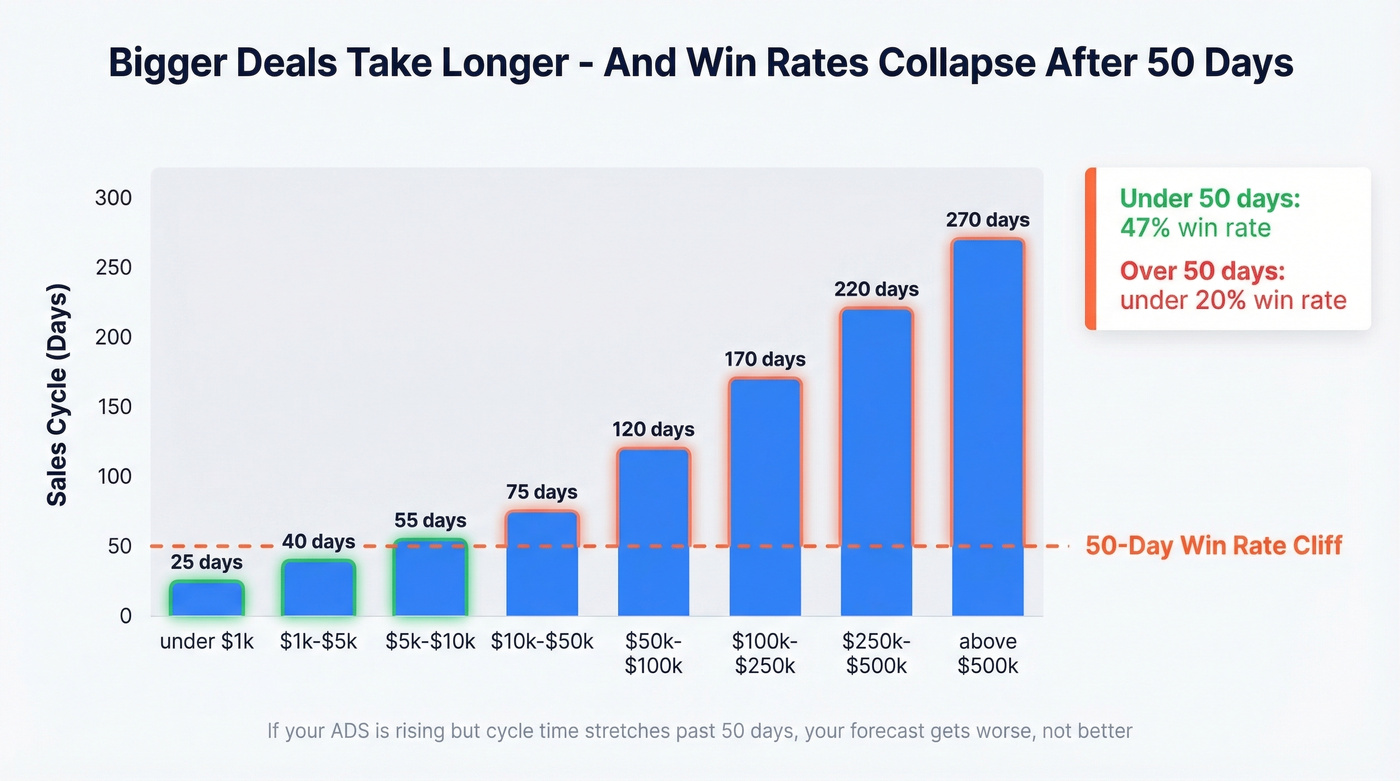
Bigger deals take longer. What's less obvious is how dramatically cycle time scales - and how it kills your win rate.
| ACV Range | Avg Sales Cycle |
|---|---|
| <$1k | 25 days |
| $1k-$5k | 40 days |
| $5k-$10k | 55 days |
| $10k-$50k | 75 days |
| $50k-$100k | 120 days |
| $100k-$250k | 170 days |
| $250k-$500k | 220 days |
| >$500k | 270 days |
Now layer in win rates. Outreach's platform data shows opportunities closed within 50 days have a 47% win rate. After 50 days, win rate drops to 20% or lower. That cliff is brutal, and it explains why so many enterprise forecasts miss - the deals that slip past the 50-day mark are statistically unlikely to close, but they sit in pipeline for months inflating coverage ratios. This is also where better sales forecasting solutions can help you stop over-calling late-stage pipeline.
If your ADS is rising but your sales cycle is stretching past 50 days, your forecast will get worse, not better. Companies with ACV above $20k reach positive cash flow 12-18 months faster than those with smaller ACVs - but only if you can actually close those deals in a reasonable timeframe.
How to Increase Deal Value
Don't start with "sell bigger deals." Start with levers that increase deal value without changing your ICP or stretching your cycle.
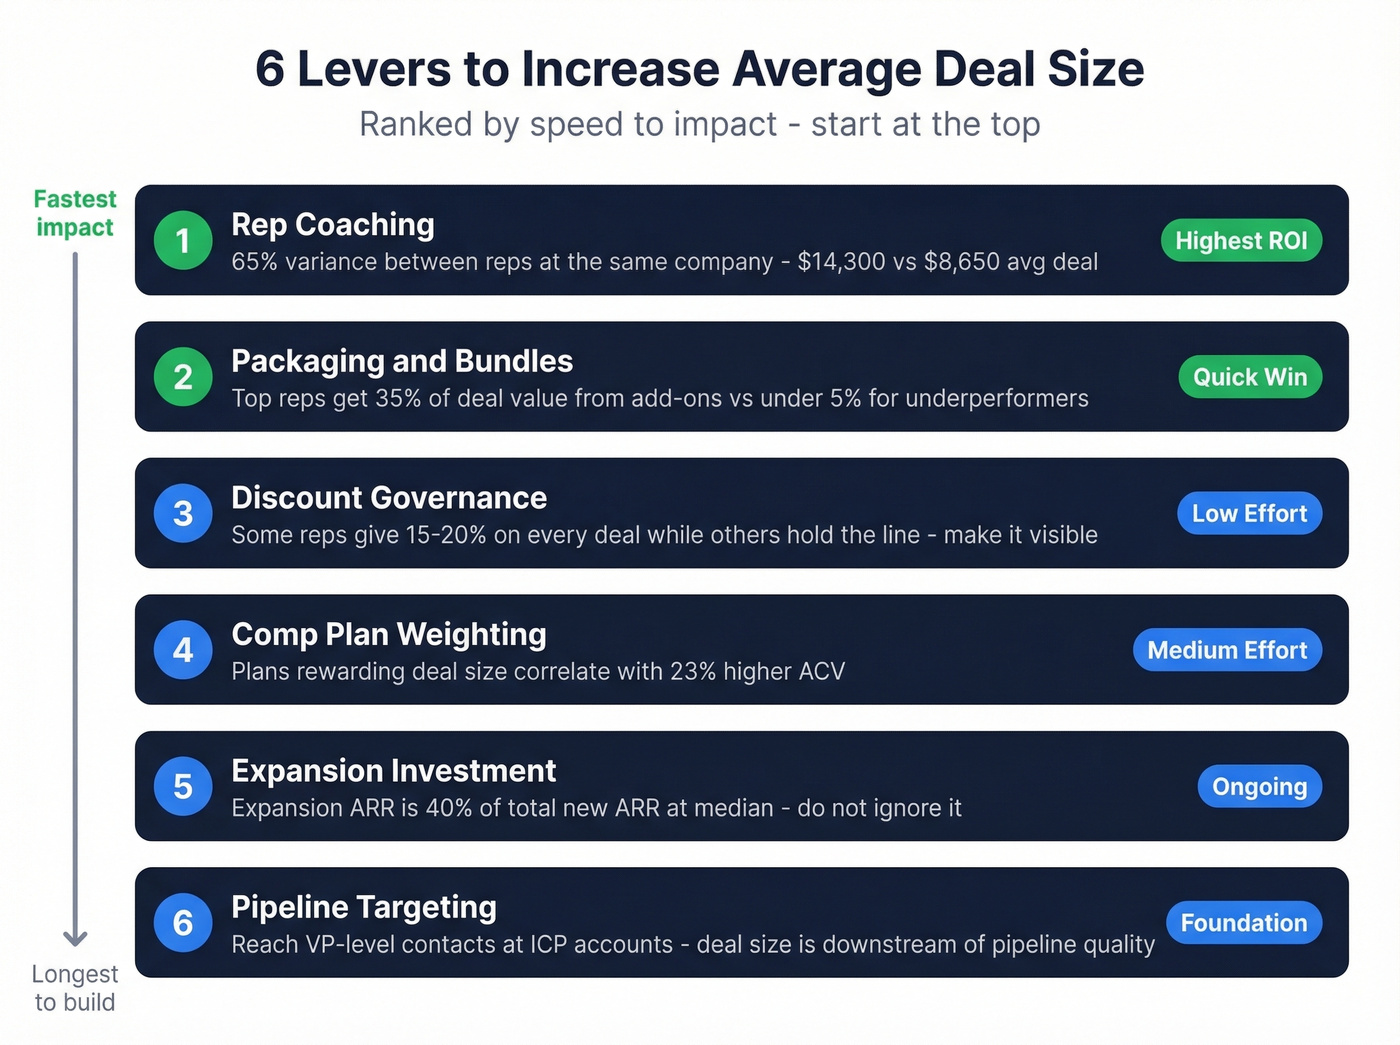
Start with rep coaching. In our experience, this is the highest-ROI move. GSP found 65% variance between reps at the same company - $14,300 average for one rep versus $8,650 for another. That gap comes down to product mix, discount behavior, and which personas each rep targets. It's coachable within a quarter. If you need a structured ramp plan, use a 30-60-90 day plan for sales reps.
Fix packaging and bundles. GSP's data also shows optional products contributed 35% of a top rep's deal value versus less than 5% for underperformers. Make sure reps know how to position add-ons - this isn't upselling for the sake of it, it's solving more of the buyer's problem in a single transaction. (Related: cross selling vs upselling.)
Control discounts. Track discounting by rep. You'll find some reps give away 15-20% on every deal while others hold the line. Make discount authority visible and accountable. If you want a practical framework, use an anchor in negotiation.
Weight comp plans toward deal value. Alexander Group research shows comp plans that reward deal size correlate with 23% higher ACV. If your comp plan treats a $10k deal the same as a $50k deal, reps will optimize for volume.
Invest in expansion. Expansion ARR now represents a median 40% of total new ARR. Don't optimize new-deal size in isolation when expansion is nearly half the growth engine.
Improve targeting. Deal size is downstream of pipeline quality. If reps can't reach VP-level contacts at ICP accounts, they default to smaller, easier-to-close deals with lower-level buyers who don't have budget authority. Prospeo's 98% email accuracy and 7-day data refresh cycle help reps build pipeline from reachable, qualified accounts instead of wasting cycles on bounced emails and outdated contacts. Skip this step if your pipeline quality is already strong and your problem is purely pricing or packaging. To tighten your targeting criteria, start with an ideal customer profile.
When your ADS is $50k, every lost opportunity costs real quota attainment. Prospeo's 300M+ profiles with 30+ filters - including buyer intent, funding, and headcount growth - let you target accounts sized for the deals you actually want to close.
Bigger deals start with better targeting. Data refreshed every 7 days.
FAQ
What's the difference between ACV, TCV, and ARR?
ACV is one year of a multi-year deal. TCV is the full contract value. ARR is annualized recurring revenue across all active customers. Pick one for your ADS calculation and stay consistent - mixing them makes comparison impossible.
Should I include renewals in my calculation?
Track renewals and expansions separately from new-logo deals. A rising blended number driven by expansion while new-logo deal size shrinks tells a very different story than uniform growth. Segmenting reveals the signal that a single metric hides.
How do I grow deal value without killing win rate?
Focus on packaging and discount governance first - they increase revenue per deal without lengthening the cycle. Then improve targeting: verified contact data ensures reps spend time on qualified prospects who can buy larger packages, not whoever's email happens to work. Comp plan adjustments come third.
That Reddit rep's problem wasn't effort or skill - it was arithmetic. Know your average deal size, trust the median over the mean, and run the quota math before you build the plan. Everything else is optimization.