How to Calculate Pipeline Velocity (and Actually Trust the Number)
Your VP of Sales needs pipeline velocity for the board deck. You've got 48 hours. The formula takes 30 seconds - learning how to calculate pipeline velocity that's actually defensible takes real work.
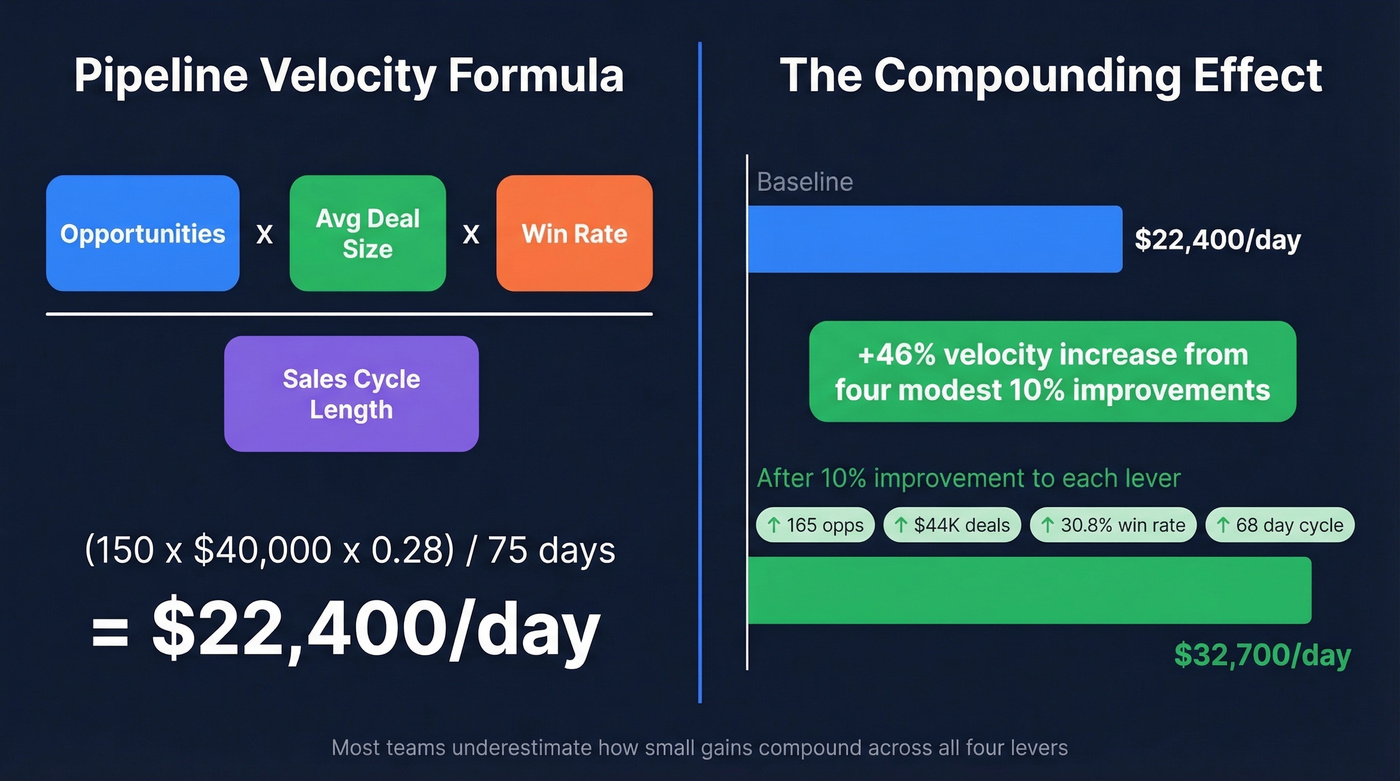
The formula: (Opportunities x Average Deal Size x Win Rate ) / Sales Cycle Length. A mid-market example: 150 opps x $40K x 28% / 75 days = $22,400/day. Jump to the benchmarks table if you just need to know whether your number is good or terrible.
What Is Pipeline Velocity?
Pipeline velocity measures how quickly qualified opportunities convert into closed revenue, expressed as dollars per day:
(Number of Opportunities x Average Deal Size x Win Rate) / Sales Cycle Length
You'll see "pipeline velocity" and "sales velocity" used interchangeably - they're the same metric. If you track one number beyond quota attainment, make it this one. It's the only metric that folds volume, quality, value, and speed into a single read.
The Formula (Worked Example)
Here's a mid-market segment example:
| Variable | Value |
|---|---|
| Qualified Opps | 150 |
| Avg Deal Size | $40,000 |
| Win Rate | 28% |
| Sales Cycle | 75 days |
Velocity = (150 x $40,000 x 0.28) / 75 = $22,400/day
Now the sensitivity math. A 10% improvement in each variable doesn't yield a 10% velocity increase - it compounds. Bump to 165 opps x $44K x 30.8% / 68 days and you get roughly $32,700/day. That's a 46% total velocity increase from four modest 10% improvements. Most guides skip this compounding effect entirely, and it's the reason velocity is such a powerful lever for RevOps teams who want to show the board what "incremental improvement" actually means in dollar terms.
How to Pull the Numbers From Your CRM
You need four fields from your CRM: Amount, Stage, CloseDate, and CreatedDate. Export your Opportunity records into a spreadsheet or use a live connector like Coefficient, then build these columns:
- Qualified opp count: filter by stage >= your qualification threshold within your time window
- Average deal size: closed-won Amount, averaged over the period
- Win rate: closed-won / total closed (won + lost) - never include open opps in the denominator
- Average sales cycle: mean of (CloseDate - CreatedDate) for closed-won opps
Never use a single blended number. The same org's enterprise segment might run 35 opps x $180K x 24% / 130 days = $11,631/day while mid-market runs $22,400/day. Blend those and you get a meaningless average that hides a decelerating enterprise pipeline behind healthy SMB volume.
Segment by motion, product line, and region. Always.
Segmenting velocity by motion only works when your CRM data is clean. Prospeo's enrichment API returns 50+ data points per contact at a 92% match rate - so every opp in your pipeline maps to a real, reachable buyer. No ghost contacts inflating your numbers.
Stop calculating velocity on phantom opportunities.
Pipeline Velocity Benchmarks
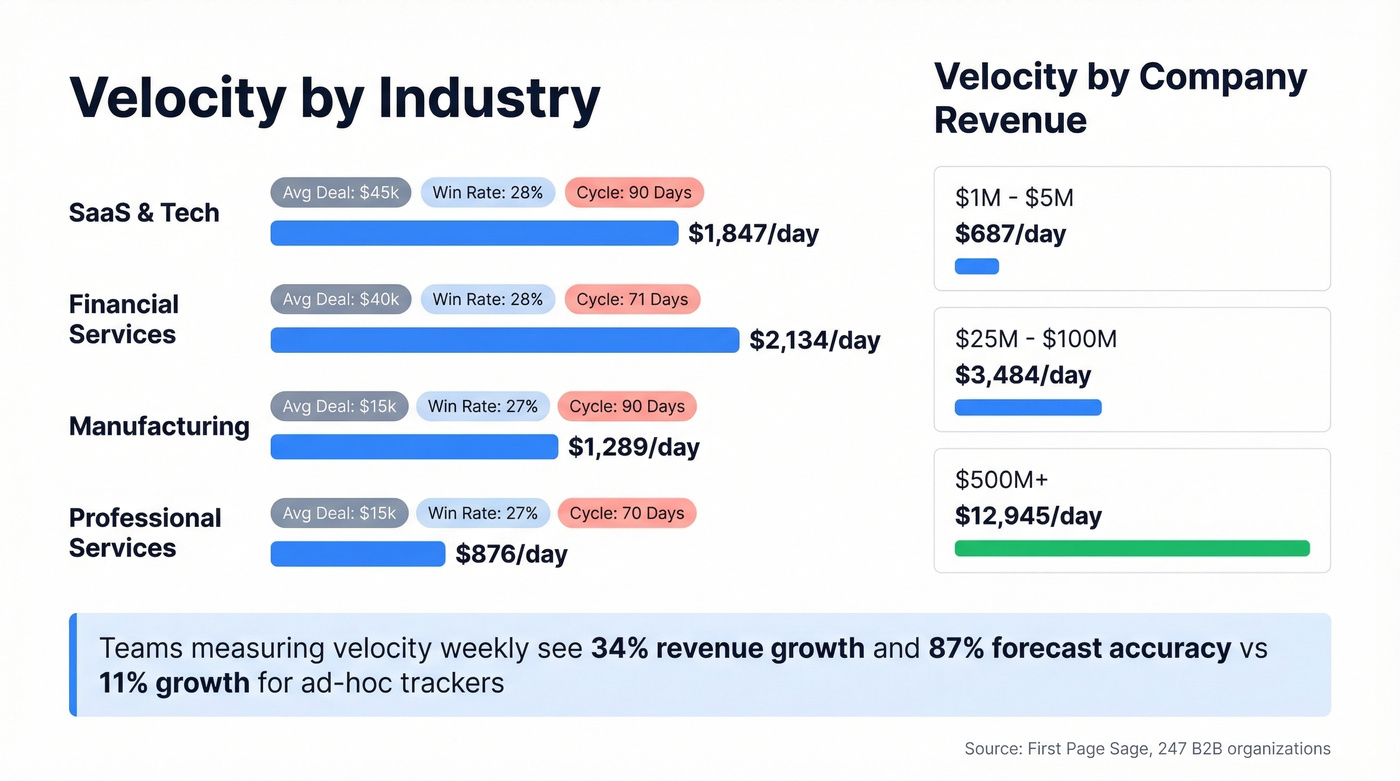
A First Page Sage study of 247 B2B organizations provides one of the most granular benchmark datasets available. Here's velocity by industry:
| Industry | Deal Size | Win Rate | Cycle (days) | Velocity/Day |
|---|---|---|---|---|
| SaaS & Tech | $12,400 | 22% | 67 | $1,847 |
| Financial Svcs | $31,200 | 18% | 89 | $2,134 |
| Manufacturing | $47,800 | 19% | 124 | $1,289 |
| Prof. Services | $8,900 | 28% | 51 | $876 |
And by company revenue size:
| Revenue | Deal Size | Win Rate | Cycle (days) | Velocity/Day |
|---|---|---|---|---|
| $1M-$5M | $6,200 | 26% | 43 | $687 |
| $25M-$100M | $22,700 | 21% | 78 | $3,484 |
| $500M+ | $57,600 | 17% | 118 | $12,945 |
In our experience, the tracking frequency correlation is the most underappreciated finding here. Teams that measure velocity weekly see 34% revenue growth and 87% forecast accuracy. Teams that track ad-hoc? 11% growth and 52% accuracy. Weekly measurement isn't optional - it's the difference between a forecast your board trusts and one that's decorative.
Why Your Number Might Be Wrong
Here's the thing: 70-80% of CRM databases have hygiene issues that directly corrupt velocity math. RevOps practitioners on r/salesoperations consistently flag these as the worst offenders:
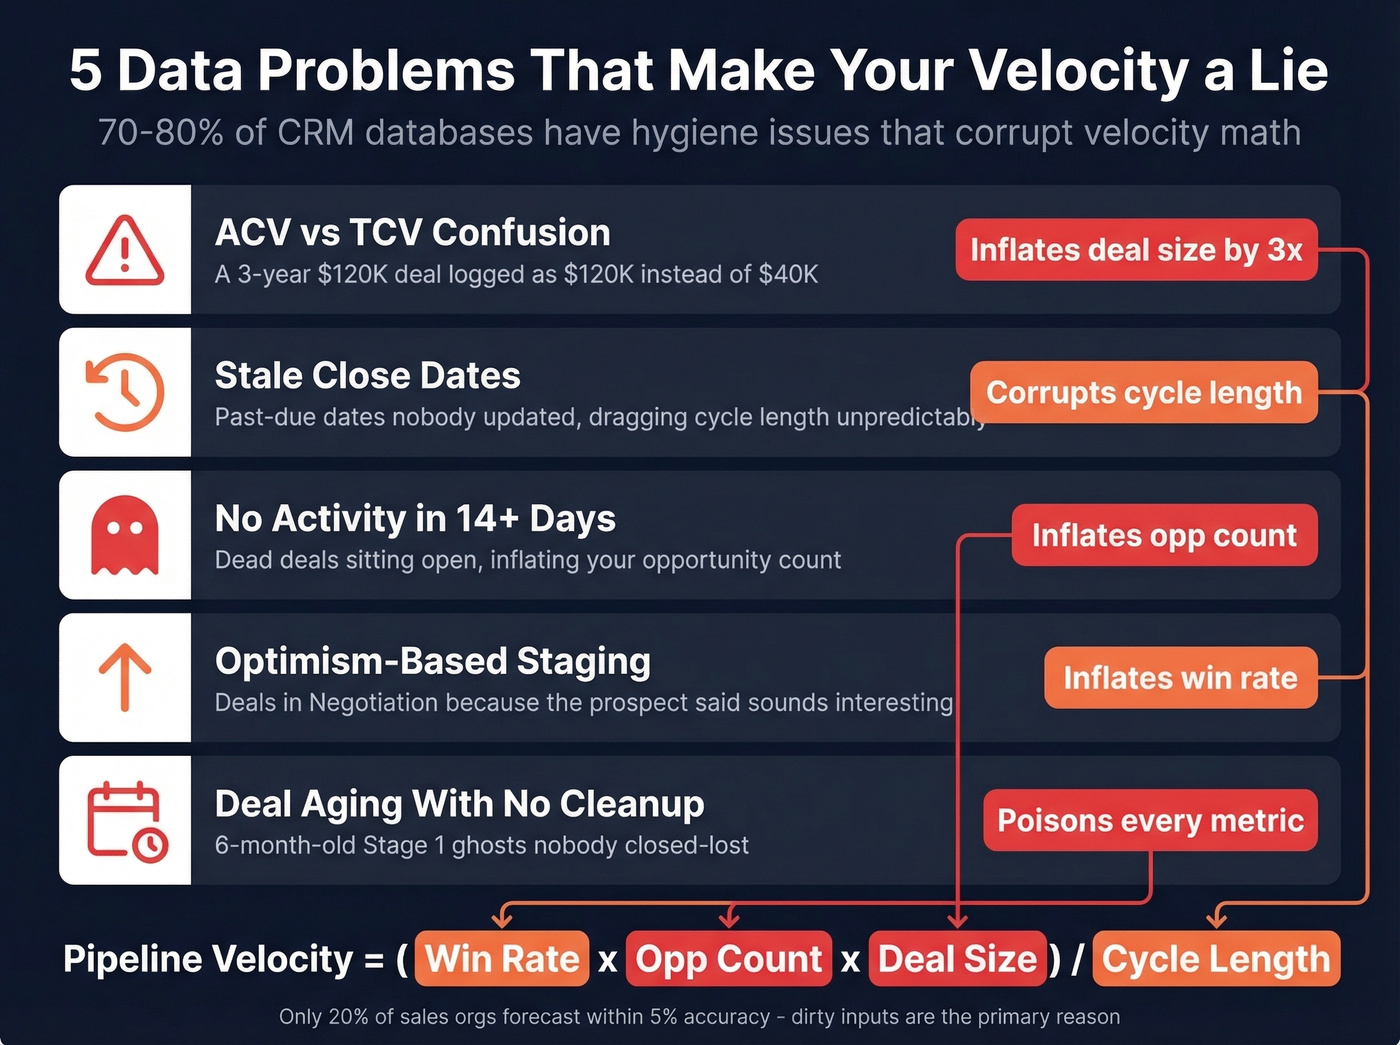
ACV vs. TCV confusion. Reps log total contract value instead of annual - a 3-year $120K deal logged as $120K triples your velocity on paper. This single mistake has wrecked more board decks than bad quota models.
Stale close dates. Deals with past-due close dates nobody updated, dragging cycle length in unpredictable directions. Use a push counter flow - auto-push 30 days and increment a counter so managers spot serial offenders.
No activity in 14+ days. Untouched deals inflating your opp count when they're effectively dead. Auto-close Stage 0 opps with no activity in 14 days.
Optimism-based staging. Deals moved to "Negotiation" because the prospect said "sounds interesting." Without evidence-based criteria, your win rate is fiction.
Deal aging with no cleanup. Six-month-old Stage 1 ghosts nobody closed-lost. They sit there, quietly poisoning every metric they touch.

There's another input problem most guides skip entirely: contact data quality. If 20% of your emails bounce, those "opportunities" never had a real chance - and they're inflating your velocity. We've seen teams discover their velocity was inflated by double digits just by cleaning up stale close dates and removing undeliverable contacts. Only 20% of sales orgs forecast within 5% accuracy, and dirty inputs are the primary reason.
How to Improve Each Lever
Each variable in the formula is a lever you can pull independently. One concrete tactic per lever:
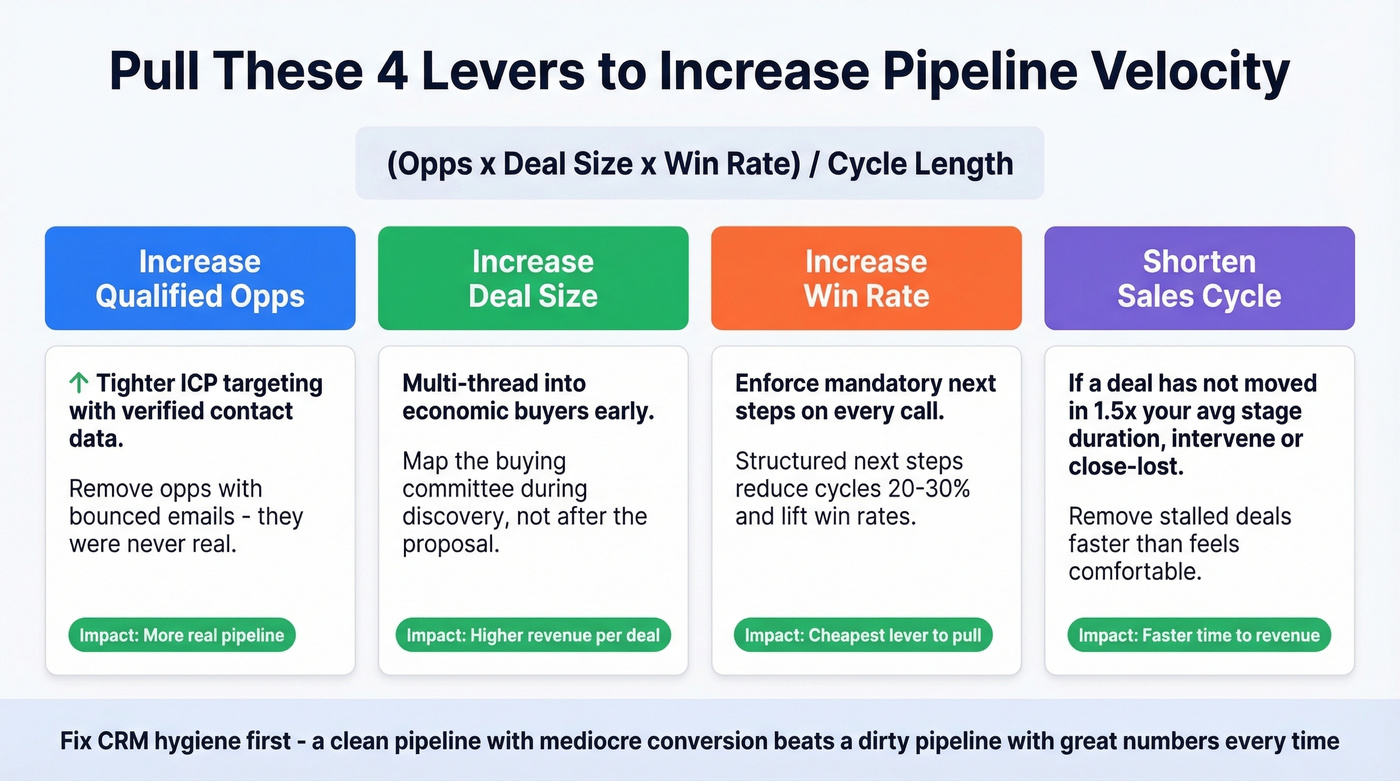
Increase qualified opportunities. Tighter ICP targeting with verified contact data. If reps are creating opportunities for prospects whose emails bounce, those opps are dead weight from day one. Tools like Prospeo with 98% email accuracy and 30+ search filters help ensure every opp in your pipeline is actually reachable.
Increase deal size. Multi-thread into economic buyers early. If you're single-threaded with a champion, you're leaving expansion revenue on the table. Map the buying committee during discovery, not after you've sent the proposal.
Increase win rate. Enforce mandatory next steps on every call. Gong's research shows structured next steps reduce sales cycles 20-30% and directly lift win rates by killing deals that were never going to close. This is the cheapest lever to pull.
Shorten sales cycle. If a deal hasn't moved stages in 1.5x your average stage duration, it needs intervention or a close-lost. Remove stalled deals faster than feels comfortable. Your instinct will be to keep them alive "just in case." Fight that instinct.
Let's be honest: pipeline velocity is the most useful metric in B2B sales, but most teams would get more value from fixing their CRM hygiene than from optimizing any single lever. A clean pipeline with mediocre conversion beats a dirty pipeline with "great" numbers every time - because the great numbers are lies.
You just read that 20% bounced emails can inflate velocity by double digits. Prospeo's 98% email accuracy and 5-step verification eliminate dead-weight opps before they corrupt your formula. 300M+ profiles, 30+ ICP filters, $0.01 per email.
Fix the input data and your velocity number finally tells the truth.
Beyond the Basic Formula
Once you've nailed the core metric, three advanced formulas diagnose where velocity breaks down:
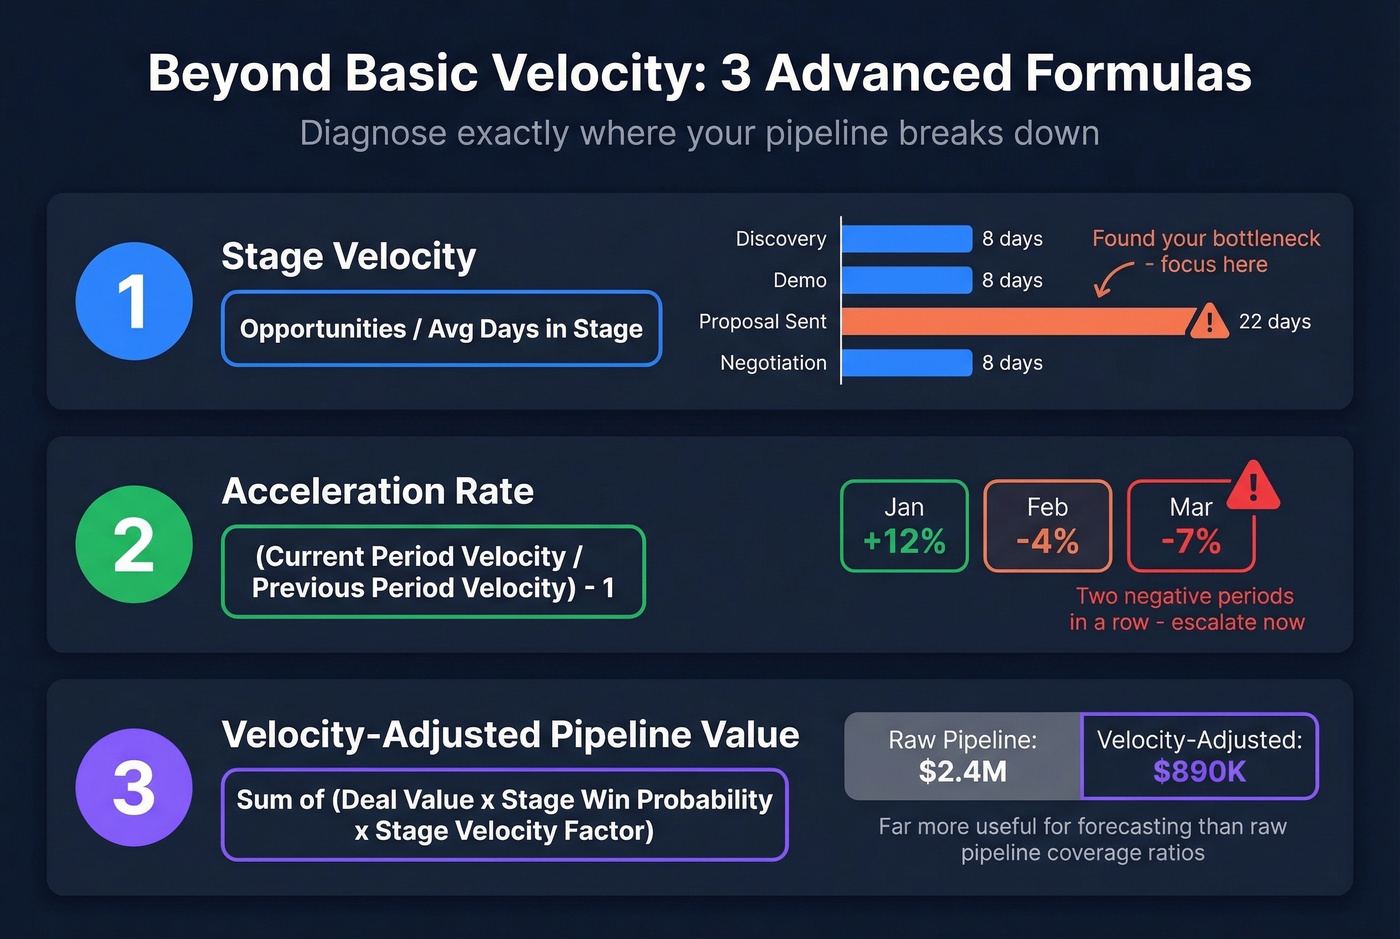
Stage Velocity = Opportunities / Average Days in Stage. If your "Proposal Sent" stage averages 22 days while everything else averages 8, you've found your bottleneck. That's where you focus - not on the overall number.
Acceleration Rate = (Current Period Velocity / Previous Period Velocity) - 1. A negative rate for two consecutive periods is a red flag worth escalating immediately. Don't wait for three.
Velocity-Adjusted Pipeline Value = Sum of (Deal Value x Stage Win Probability x Stage Velocity Factor). This gives you a weighted pipeline view that accounts for deal movement speed, not just face value, and it's far more useful for forecasting than raw pipeline coverage ratios. If you want a broader toolkit, compare sales forecasting solutions and best sales forecasting tools before you buy.
FAQ
Is pipeline velocity the same as sales velocity?
Yes - both use the identical formula: (Opportunities x Deal Size x Win Rate) / Cycle Length. "Pipeline velocity" emphasizes the funnel view while "sales velocity" emphasizes revenue output. Pick one term and stay consistent across your dashboards so nobody wastes a meeting debating semantics.
How often should I recalculate pipeline velocity?
Weekly. Teams tracking weekly see 34% revenue growth and 87% forecast accuracy vs. 11% growth and 52% accuracy for ad-hoc trackers. Set a recurring Monday morning report in your CRM - it takes five minutes once you've built the view.
What's a good velocity number for SaaS?
Median SaaS velocity is roughly $1,847/day based on a $12,400 deal size, 22% win rate, and 67-day cycle. But a $5M startup at $687/day and a $500M enterprise at $12,945/day have wildly different baselines. Always benchmark against your revenue segment, not the industry average.
How does bad contact data affect velocity?
Undeliverable emails inflate your opportunity count without adding real pipeline. We've watched teams cut bounce rates from 35% to under 4% after switching to verified contact data, which removed phantom opps and gave them a velocity number they could actually defend. If your bounce rate is above 5%, fix that before you optimize anything else.