How to Calculate Win Rate (And Why Most Teams Get It Wrong)
Your VP of Sales just asked for the team's win rate, and three people gave three different numbers. One said 47%. Another said 28%. The third mumbled something about "it depends on how you count demos." They're all technically right - and that's the problem.
Knowing how to calculate win rate correctly is the difference between useful forecasting and expensive fiction.
What You Need (Quick Version)
Win Rate = (Deals Won / Total Opportunities) x 100
Take 35 wins out of 65 total closed opportunities: that's a 53.8% win rate. Simple math, messy inputs. Your win rate calculation is only as honest as your denominator - teams can inflate theirs by 15-20 points by quietly excluding no-decision deals. And benchmarks are meaningless without segment context. A 25% win rate is strong for enterprise SaaS and weak for SMB.
Jump to the benchmarks table if you need numbers, or the six mistakes section if you suspect your reporting is off.
The Sales Win Rate Formula
Here's the formula, step by step:
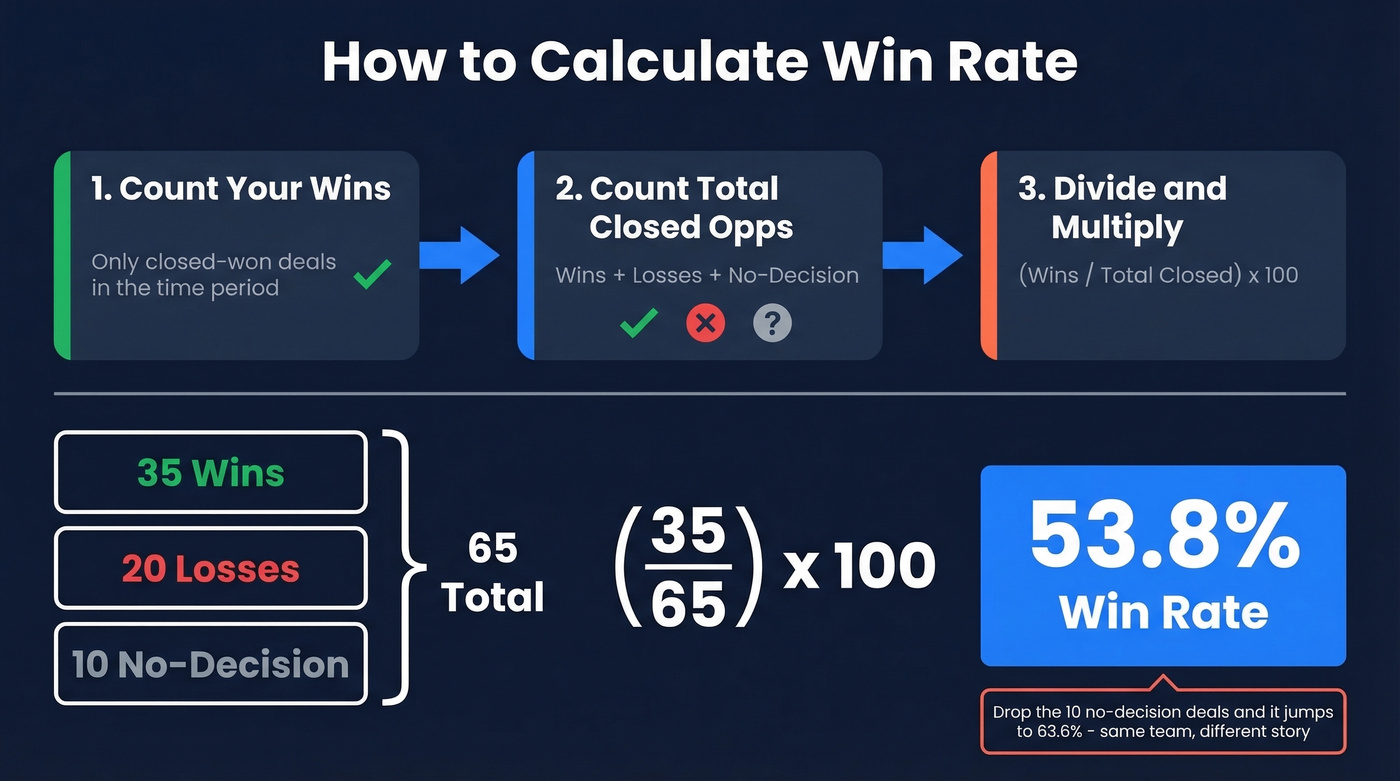
- Count your wins. Only closed-won deals in the time period you're measuring.
- Count your total closed opportunities. This includes wins, losses, and abandoned/no-decision deals. Not open deals - only those with a final outcome.
- Divide and multiply. (Wins / Total Closed Opportunities) x 100 = Win Rate %.
A worked example: your team closed 65 opportunities last quarter. 35 were wins, 20 were losses, and 10 were no-decision. Applying the formula: (35 / 65) x 100 = 53.8%.
That 10-deal no-decision bucket matters enormously. Drop it, and your win rate jumps to 63.6%. Same team, same quarter, wildly different story.
Win Rate vs. Close Rate vs. Win/Loss Ratio
These three metrics get used interchangeably, and they shouldn't.
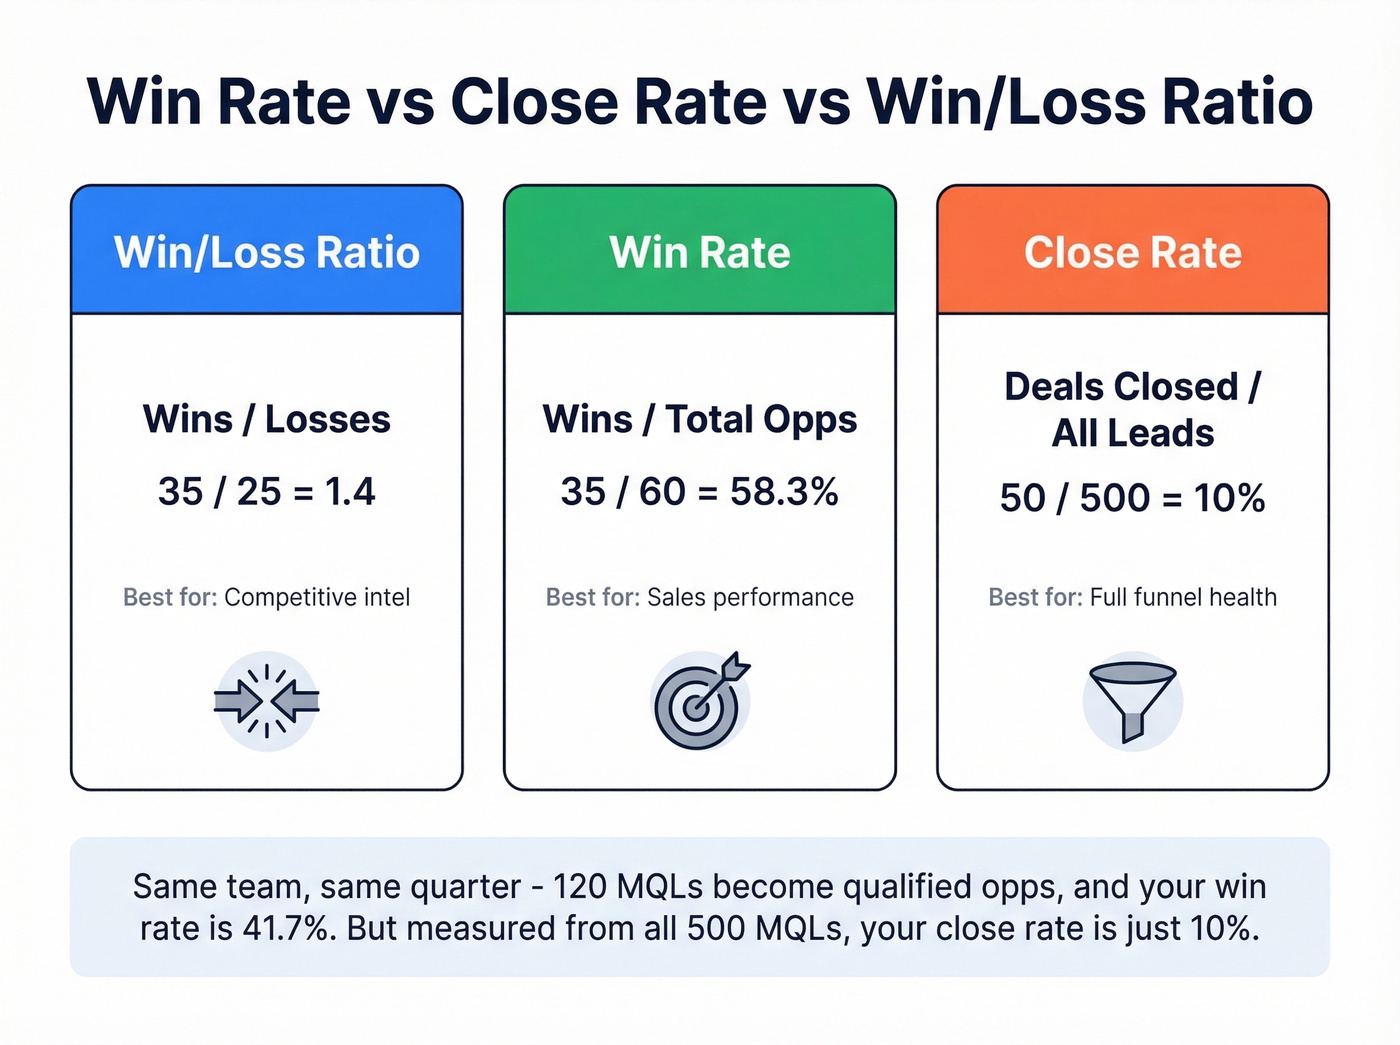
| Metric | Formula | Example (35 wins, 25 losses, 60 total opps) | Best For |
|---|---|---|---|
| Win/Loss Ratio | Wins / Losses | 35 / 25 = 1.4 | Competitive intel |
| Win Rate | Wins / Total Opps | 35 / 60 = 0.583 | Sales performance |
| Win Percentage | (Wins / Total Opps) x 100 | 58.3% | Reporting/forecasts |
This example assumes zero abandoned deals for simplicity - in practice, you'd include them in the denominator.
Win/loss ratio tells you how you perform head-to-head against competitors. Win rate tells you how efficiently you convert pipeline. Close rate is broader still: it measures deals closed out of all leads or opportunities created, including those still in progress.
The distinction matters because close rate includes your entire top-of-funnel. If you're generating 500 MQLs and closing 50 deals, your close rate is 10%. But if only 120 of those MQLs became qualified opportunities, your opportunity win rate is 41.7%. Same team, same quarter, very different diagnostic.
The Denominator Debate
The formula isn't the hard part. The hard part is agreeing on what counts as an "opportunity."
One seller on r/sales reported a 22-28% win rate at a previous company and just over 4% at their current one. Same person, same skills. The difference? At the new company, only about 30% of leads get accepted into opportunities, and that's out of the roughly 55% that even show up to discovery. The denominator swallowed the number whole.

This is the "denominator debate" - whether you start counting from MQL, demo-completed, or sales-qualified opportunity. Each choice produces a defensible calculation and a completely different story.
Membrain's framework offers the cleanest taxonomy: every qualified opportunity ends in one of three outcomes - win, lose, or abandon. All three belong in your denominator. A team with 35 wins, 30 losses, and 35 abandonments has a true win rate of 35%. Count only wins and losses, and it jumps to 54%. That's a 19-point gap, enough to make a struggling team look healthy.
Here's the thing: the moment you start cherry-picking which outcomes "count," you're not measuring performance anymore. You're managing optics.
Use this rule: if a rep spent time working the deal, it's in the denominator. Skip this rule only if you're explicitly measuring stage-specific conversion like demo-to-close or proposal-to-win, and you label it accordingly.
Win Rate Benchmarks (2026)
Benchmarks are useful as guardrails, not gospel. Your win rate depends on your market, deal size, sales cycle, and how strictly you define "opportunity."
SaaS Win Rates by Company Size
Forecastio's analysis segments SaaS win rates by company size:
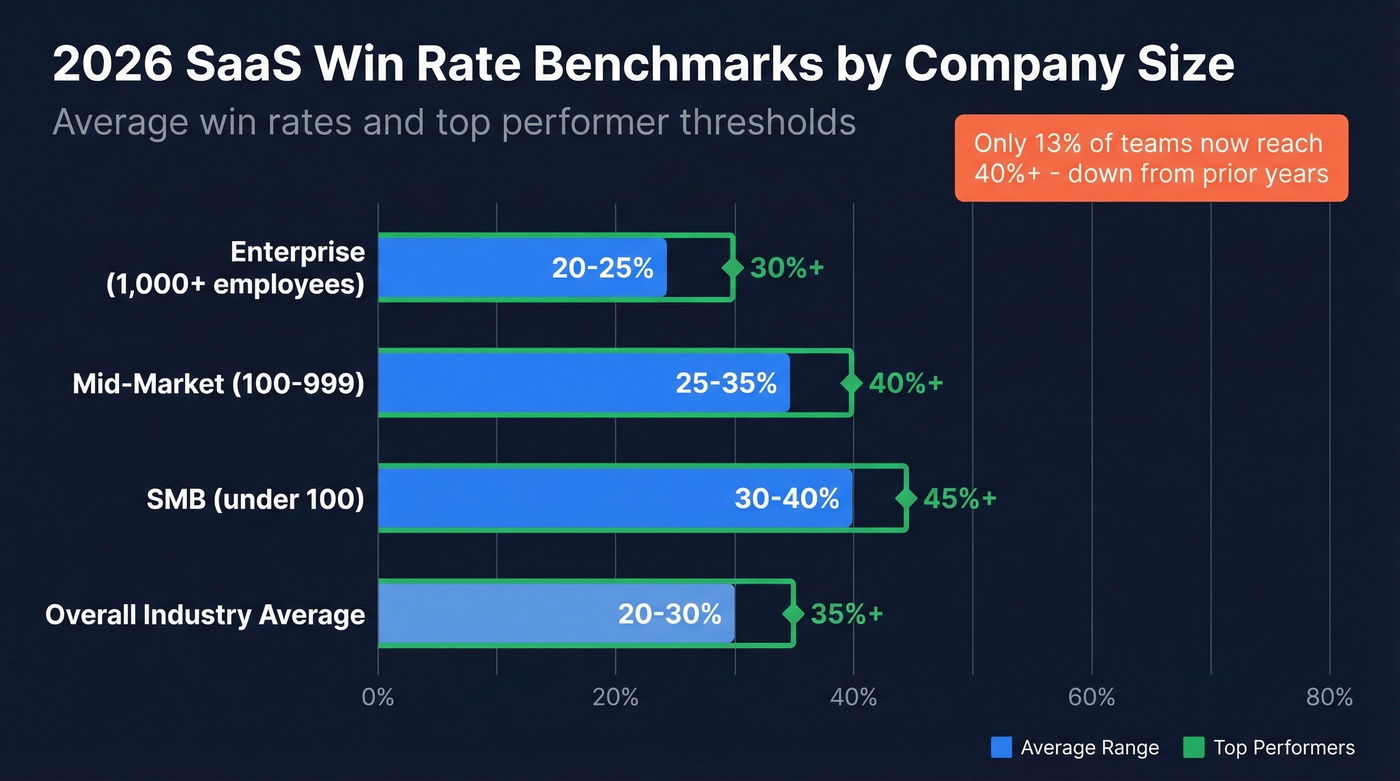
| Segment | Average Win Rate | Top Performer |
|---|---|---|
| Enterprise (1,000+ employees) | 20-25% | 30%+ |
| Mid-market (100-999) | 25-35% | 40%+ |
| SMB (<100) | 30-40% | 45%+ |
| Overall industry average | 20-30% | 35%+ |
A RAIN Group study of 472 sellers and executives found an overall average of 47%, with the top 7% hitting nearly 75% and the top 20% averaging 62%. Everyone else sat at 40%. Those numbers look high compared to the SaaS table because the RAIN Group sample spans industries and likely uses a tighter opportunity definition.
Outside SaaS, the architecture and engineering sector averages 47.8%, with top performers around 50.0% and the lower quartile at 46.5% - a much narrower band.
Win Rates Are Declining
Recent sales data flags a troubling trend: the majority of sales orgs now report win rates between 16% and 30%, with only 13% of teams reaching the 40%+ tier. Compared to prior years, the largest cohort shifted from the 31-40% bracket down to 21-25%.
Deal velocity tells part of the story. Opportunities closed within 50 days carry a 47% win rate. After 50 days, it drops to 20% or lower. Deals don't age like wine - they age like milk.
If your average deal is under $20k and your sales cycle exceeds 45 days, your win rate problem isn't closing skill. It's that you're selling to the wrong accounts or qualifying too loosely. Fix the inputs before you train the reps.
A declining win rate rarely means your reps can't close. It means they're spending cycles on accounts that were never going to buy. Prospeo's intent data tracks 15,000 topics so you target companies actively researching your solution - not cold accounts that bloat your denominator.
Stop losing deals before they start. Sell to buyers already in-market.
6 Mistakes That Inflate Your Win Rate
Most win rate guides give you a formula and call it a day. That's like giving someone a thermometer and calling it healthcare. The formula is trivial. Getting clean inputs is where teams fail.
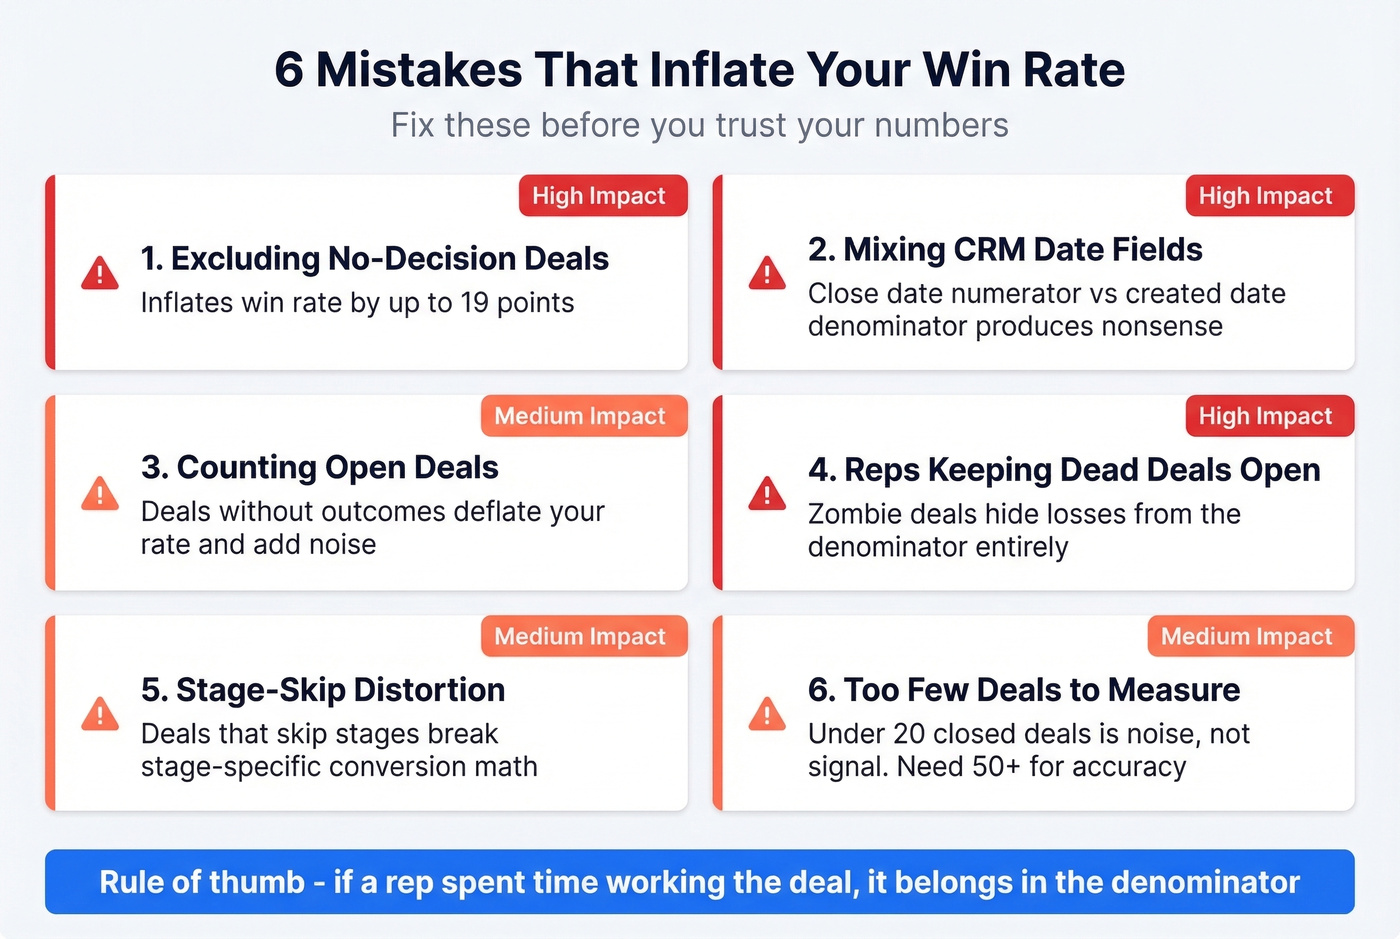
1. Excluding No-Decision Deals
This is the single biggest source of inflated win rates. If your sales ops team has been reporting without including no-decision deals, every forecast built on that number is wrong. The 19-point gap from the Membrain example above isn't theoretical - we've seen it play out in real pipeline reviews.
2. Mixing CRM Date Fields
A Power BI thread captured this perfectly: a sales ops analyst couldn't figure out why their numbers "do not appear to be correct." The problem? They were filtering the numerator by close date and the denominator by created date. When quotes sit open for 120 days - or in some cases a year overdue - mixing date contexts produces nonsense.
Pick one date field. Close date is usually the right choice for historical analysis. Created date works for cohort analysis. Never mix them.
3. Counting Open Deals
This sounds obvious, but it's shockingly common. The HubSpot community flags it explicitly: "Make sure to add a filter to take out any open deals, you only want to look at won and lost." Open deals haven't reached an outcome yet. Including them deflates your rate artificially and makes it fluctuate wildly as deals move through stages.
4. Reps Keeping Dead Deals Open
The behavioral cousin of mistake #3, and more insidious. Reps who know their performance is tracked will keep zombie deals "open" instead of marking them lost - pushing losses out of the denominator entirely.
Set an auto-close rule tied to your sales cycle. Many teams treat about 45 days of inactivity as dead in faster cycles, or 3x your average sales cycle plus 30 days for longer ones. Treat it accordingly.
5. Stage-Skip Distortion
One r/sales thread asked about calculating "demo to close rate" and immediately hit a wall: out of 92 clients, 6 had never had a demo and still closed. If you're measuring stage-specific conversion rates, deals that skip stages break your math. Either exclude them from stage-specific metrics and note the exclusion, or measure overall win rate instead.
6. Too Few Deals to Measure
A win rate calculated from 8 deals is a coin flip, not a metric. We use this heuristic: fewer than 20 closed deals is noise. 50+ gives you directional accuracy. 100+ per cohort is where you can start segmenting by rep, deal size, or source and trust the numbers. If you're slicing your data so thin that each segment has 12 deals, you're reading tea leaves.
How to Calculate Win Rate in Your CRM
HubSpot
Create a deals funnel report. Set the stages from "Deal Record Created" to "Closed Won" to see conversion at each step. Filter out open deals - only include won and lost. Use rolling time ranges like trailing 90 days rather than fixed calendar periods so your report stays current. HubSpot's Sales Analytics report bundles win rate with push rates, velocities, and waterfalls in a single dashboard.
Salesforce
Build an Opportunities report filtered to Closed Won + Closed Lost stages. Use the Report Type "Opportunities" and add a summary formula field: Won:SUM / RowCount. Group by owner for rep-level win rates, by close date for trends, and by product line or deal size for segmentation. Tracking the opportunity-to-win ratio at the rep level helps managers spot coaching opportunities before pipeline reviews.
Spreadsheet
If you're still in Google Sheets, use a closed-only formula like:
=COUNTIF(status_range,"Won")/(COUNTIF(status_range,"Won")+COUNTIF(status_range,"Lost"))
But honestly, if you're calculating win rate in a spreadsheet, you've already outgrown it.
How to Improve Your Win Rate
Qualify Harder
The fastest way to raise your win rate isn't closing better - it's disqualifying faster. Frameworks like MEDDICC and BANT exist for a reason. Every unqualified deal that lingers in your pipeline for 60 days before going dark drags your numbers down and wastes rep time. We've seen teams raise win rates by double digits just by tightening their stage-one qualification criteria. Improving your opportunity-to-win ratio starts with saying no to the wrong deals earlier.
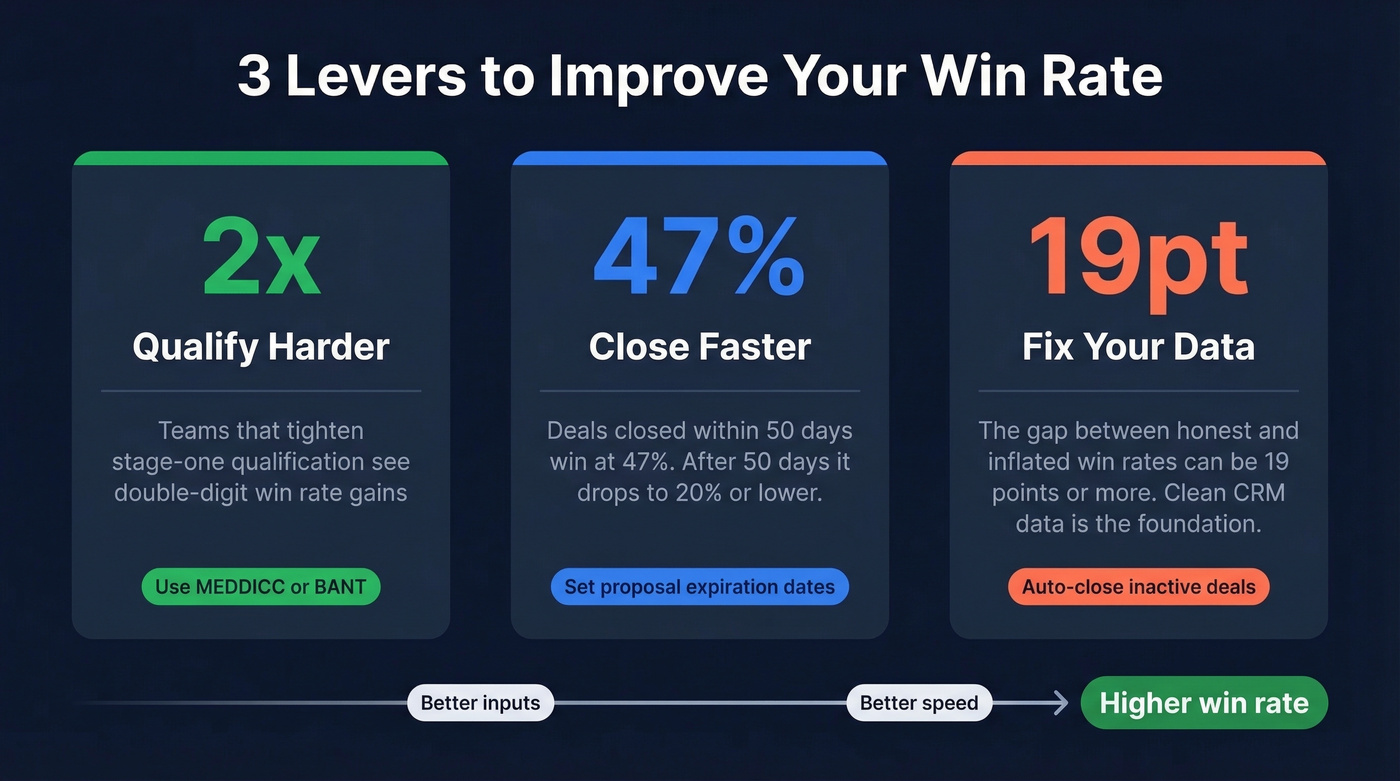
Close Faster
Deals closed within 50 days have a 47% win rate. After 50 days, it drops to 20% or lower. If your average sales cycle is stretching, the problem isn't your closers - it's your process. Map where deals stall, build mutual action plans, and set hard expiration dates on proposals. Speed is a win rate lever most teams underuse.
Fix Your Data
Let's be honest about something most win rate guides skip entirely: bad contact data creates phantom opportunities. If 30% of your emails bounce, those "opportunities" were never real prospects - they just inflate your pipeline and drag down your win rate when they inevitably go nowhere.
Prospeo verifies emails at 98% accuracy on a 7-day refresh cycle, which means your pipeline reflects actual reachable humans. Snyk's team went from a 35-40% bounce rate to under 5% after switching, and AE-sourced pipeline jumped 180%. When every contact in your CRM is verified, your win rate reflects selling skill, not data quality problems.

Segment Everything
A single company-wide win rate is almost useless. Break it down by rep, deal size, lead source, product line, and sales cycle length. You'll find that your inbound win rate might be 45% while outbound sits at 18% - and that's not a problem, it's just two different motions with different baselines.
Segment-level win rates tell you where to invest. Company-level win rates tell you almost nothing.
Calculate Wins Needed to Hit Target
Want to know exactly how many more deals you need? Use this reverse formula:
Additional Wins Needed = (Target Rate x Total Opps) - Current Wins
If you have 100 total opportunities, 30 current wins, and a target of 40%: (0.40 x 100) - 30 = 10 more wins. That turns an abstract percentage into a concrete number your team can rally around.
Deals that drag past 50 days see win rates crater to 20%. The fix isn't better follow-up - it's reaching the right decision-maker on day one. Prospeo gives you 125M+ verified mobile numbers with a 30% pickup rate, so reps connect directly instead of chasing gatekeepers for weeks.
Shorter sales cycles start with direct dials to real decision-makers.
Win Rate in Trading and Sports
The win rate formula shows up well beyond sales. In trading, a 35% win rate can be highly profitable if the average win is 3x the average loss. The expectancy formula captures this: (win rate x average win) - (loss rate x average loss). Trend-following strategies routinely operate at 30-40% win rates; mean reversion strategies target 60%+. The number alone means nothing without risk-reward context.
In sports, it's more straightforward: wins divided by games played. Some leagues handle ties as half-wins in standings, and no-contests are typically excluded entirely. Unlike sales, there's no denominator debate - a game played is a game played.
Win Rate FAQ
What's a good win rate?
For SaaS enterprise teams, 20-25% is average and 30%+ is strong. Mid-market averages 25-35%, SMB 30-40%. The RAIN Group study found an overall average of 47% across 472 sellers, with elite performers hitting nearly 75%. Always compare against your segment, not a universal benchmark.
Should I include no-decision deals?
Yes. Always. Excluding abandoned deals can inflate your win rate by roughly 19 percentage points. Include every deal that consumed rep time. A reliable formula always accounts for no-decision outcomes in the denominator.
What's the difference between win rate and close rate?
Win rate measures deals won out of qualified opportunities. Close rate measures deals closed out of all leads or opportunities created, including those still in progress. Win rate is narrower and more useful for diagnosing sales execution problems.
How many deals do I need for a meaningful win rate?
At least 50 closed deals for directional accuracy. Below 20, the number is statistical noise. For stable, segmentable measurement, aim for 100+ closed deals per cohort before drawing conclusions or comparing reps.
Can bad contact data affect my win rate?
Directly. If 30% of your emails bounce, those "opportunities" were never real - they inflate your pipeline and drag down your numbers. Cleaning your data with a verified source removes phantom opportunities so your win rate reflects actual selling performance.