How to Create a Sales Forecast That's Actually Accurate
4 in 5 sales and finance leaders missed a quarterly forecast in the past year. Over half missed it two or more times. And yet only 45% of sales leaders say they're confident in their forecasts. The problem isn't that building a sales forecast is impossible - it's that most teams build forecasts on shaky data using the wrong method for their stage.
Let's fix that.
What You Need (Quick Version)
Three things determine whether your forecast is useful or fiction:
- Method fit - the right model for your data maturity and deal complexity
- Data quality - garbage pipeline data produces garbage forecasts, regardless of method
- Review cadence - a forecast you check quarterly is a wish, not a tool
Here's the thing: data quality matters more than method choice. A simple weighted pipeline model fed with clean, current contact data will outperform an AI model running on a CRM full of stale records. If you've got 6+ months of pipeline data, start with weighted pipeline forecasting and upgrade from there.
What Is a Sales Forecast?
A sales forecast is a data-driven estimate of revenue over a defined period, based on pipeline deals, their likelihood to close, and expected timing. It's not a quota. It's not a target. It's your best prediction of what will actually land - and the gap between prediction and reality tells you where your process is broken.
Six Forecasting Methods Compared
Not all methods are created equal. An Optifai benchmark across 939 companies shows dramatic variance depending on which approach you use:
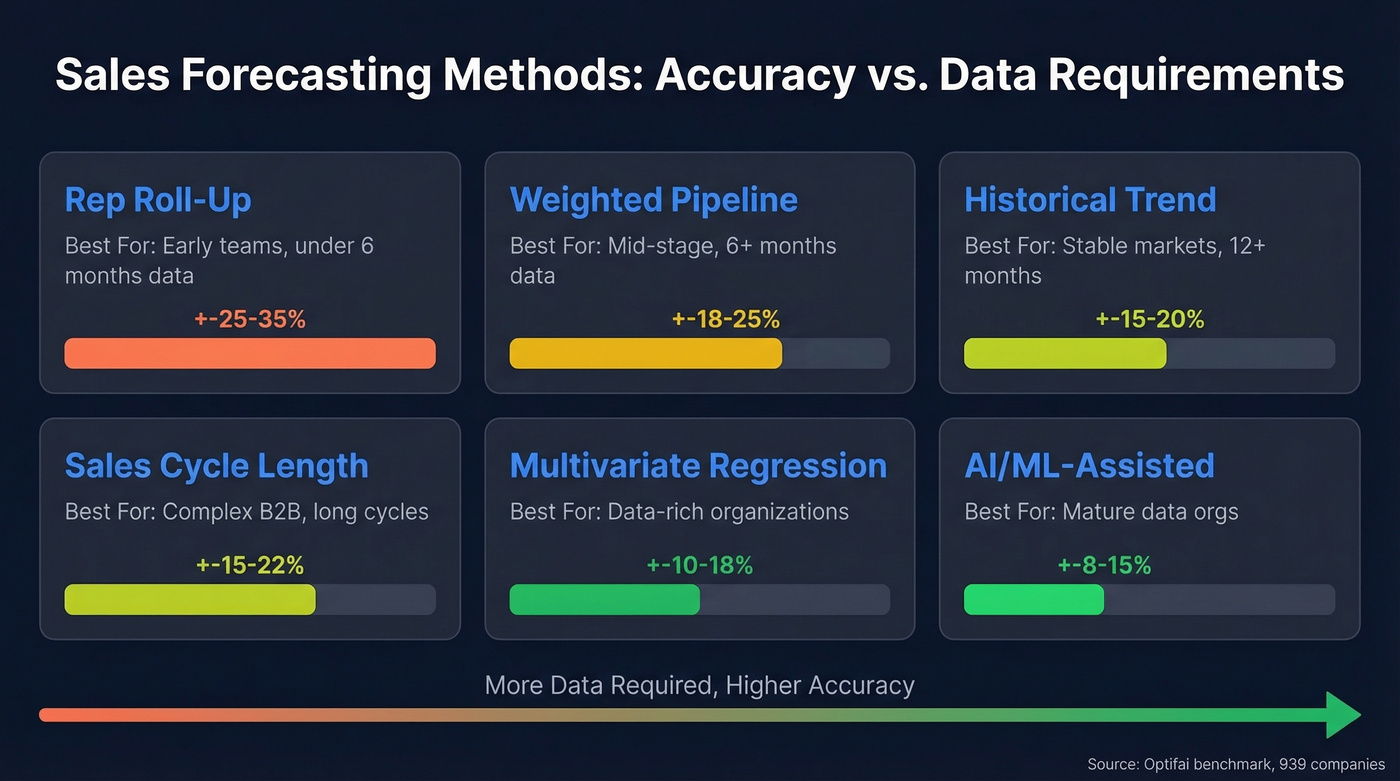
| Method | Best For | Data Required | Typical Variance |
|---|---|---|---|
| Rep roll-up | Early teams, <6 mo data | Rep judgment | ±25-35% |
| Weighted pipeline | Mid-stage, 6+ mo data | Stage probabilities | ±18-25% |
| Historical trend | Stable markets, 12+ mo | Revenue history | ±15-20% |
| Sales cycle length | Complex B2B, long cycles | Cycle timing data | ±15-22% |
| Multivariate regression | Data-rich orgs | Multiple variables | ±10-18% |
| AI/ML-assisted | Mature data orgs | All of the above | ±8-15% |
If you're pre-revenue or under six months of pipeline data, rep roll-up is your only honest option - just know it's the least accurate. Once you've got a quarter or two of closed-won data, weighted pipeline gives you the best accuracy-to-effort ratio. Historical trending works when your market is stable and you've got 12+ months of revenue data to draw from.
Most teams jump to AI forecasting tools too early. If your average deal size is under $25K and your pipeline has fewer than 200 deals per quarter, weighted pipeline with clean data will match or beat any AI model you bolt on. The gap between ±18% and ±8% variance lives in data quality and dark funnel signals - pricing page revisits, documentation reads, community engagement - not in the sophistication of your algorithm.
How to Build a Sales Forecast Step by Step
Here's a complete bottom-up forecast for a SaaS company. We'll thread real numbers through every step so you can see exactly how the math works.
Define Your Timeline and Goal
Pick a forecast horizon that matches your planning cycle. Many B2B teams forecast the current quarter weekly and next quarter monthly. Annual forecasts are useful for budgeting but decay fast as the horizon extends - a 90-day forecast is only 65-75% accurate, compared to 85-90% for a 30-day window.
For our example: we're forecasting Q3 new ARR for a SaaS company with a $15,000 ACV and a 60-day sales cycle.
Gather Pipeline and Historical Data
You need three data sets: current pipeline by stage, historical stage-to-stage conversion rates, and lead volume trends. 66% of teams cite reporting systems that can't access historical CRM data as a top roadblock - so if this step feels painful, you're in the majority.
Our example company generates 1,000 leads/month, growing 10% month-over-month. Historical conversion rates: 10% lead-to-demo, 20% demo-to-closed-won.
Account for Variables
Before you run any numbers, pressure-test your assumptions. Seasonality, market shifts, pipeline velocity changes, and rep capacity all bend your forecast. If Q4 historically converts 20% higher than Q2, your stage probabilities need to reflect that.
We're using weighted pipeline with a bottom-up build. Here's our stage probability ladder:
- Discovery: 10%
- Demo completed: 35%
- Final proposal: 75%
- Legal/contracting: 90%
These probabilities should come from your own historical win rates by stage, not industry averages. If you don't have enough data yet, these are reasonable starting points for B2B SaaS.
Run the Numbers (Worked Example)
Month 1 activity: 1,000 leads -> 100 demos -> 20 expected closed-won deals. With a 60-day sales cycle, those 20 deals close in Month 3, generating $300,000 in new ARR ($25,000 new MRR).
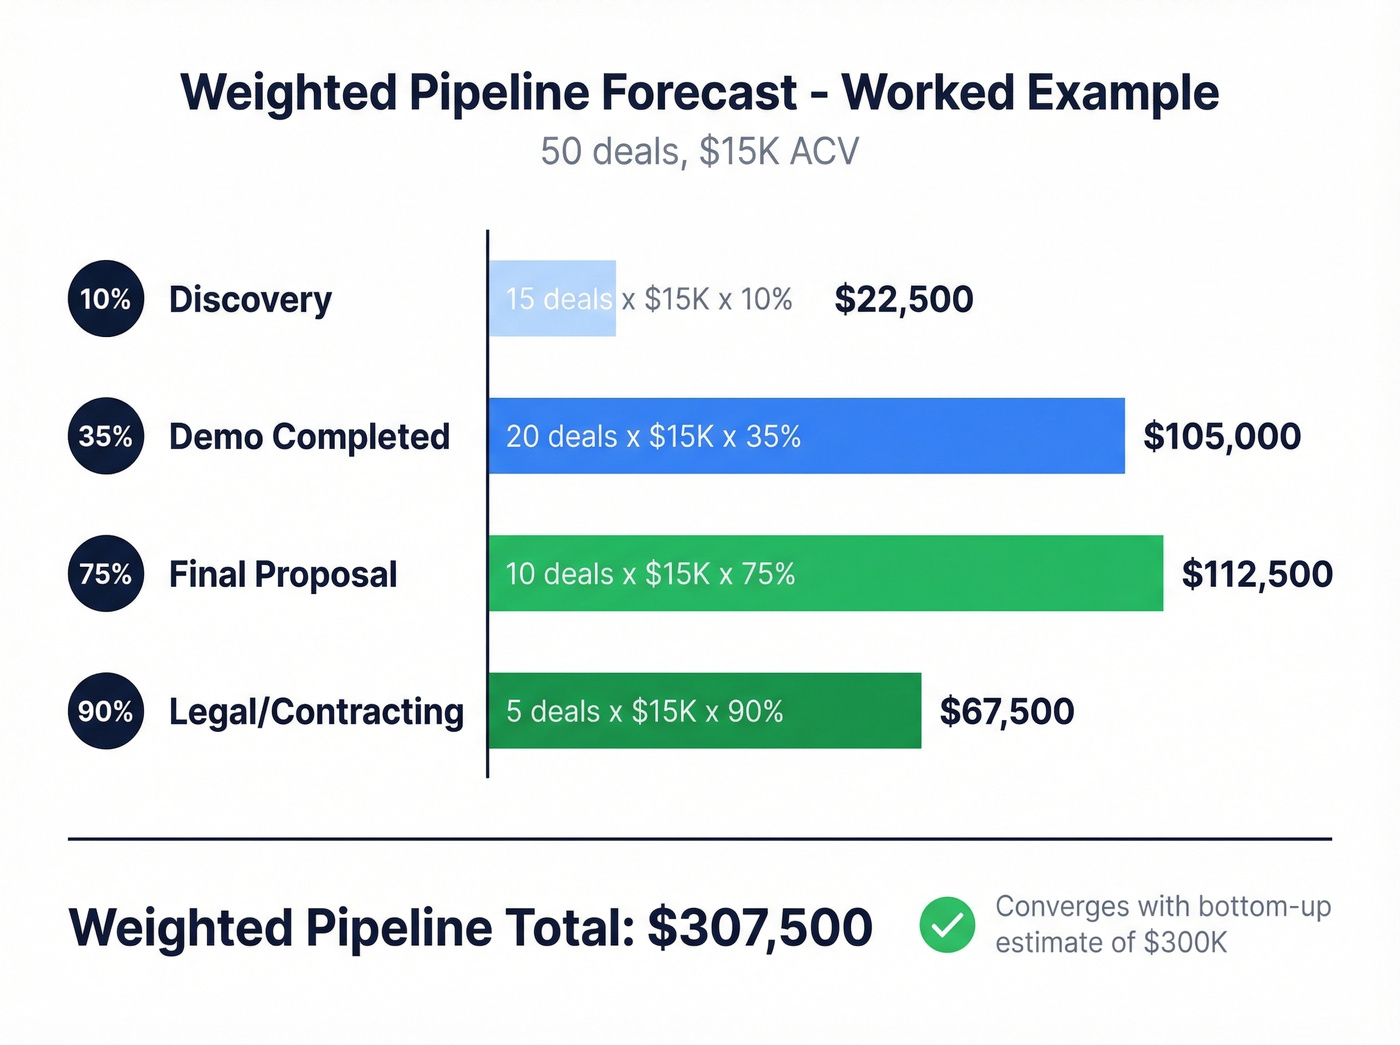
Now apply the weighted pipeline lens. Say you've got 50 deals currently in pipeline:
- 15 in Discovery: 15 x $15K x 10% = $22,500
- 20 at Demo: 20 x $15K x 35% = $105,000
- 10 at Final Proposal: 10 x $15K x 75% = $112,500
- 5 in Legal: 5 x $15K x 90% = $67,500
Weighted pipeline total: $307,500. That's your expected revenue from current pipeline. Compare it to the bottom-up calculation ($300K) - when both methods converge, your confidence goes up.
Run a top-down sanity check using TAM/SAM/SOM. Start from total market size and work down. If your forecast implies capturing 40% of your serviceable market in Year 1, something's wrong with your assumptions. When the bottom-up and top-down numbers converge, you've got a forecast worth defending.
Build Scenarios
Never present a single number. Build three scenarios by adjusting your key variables:
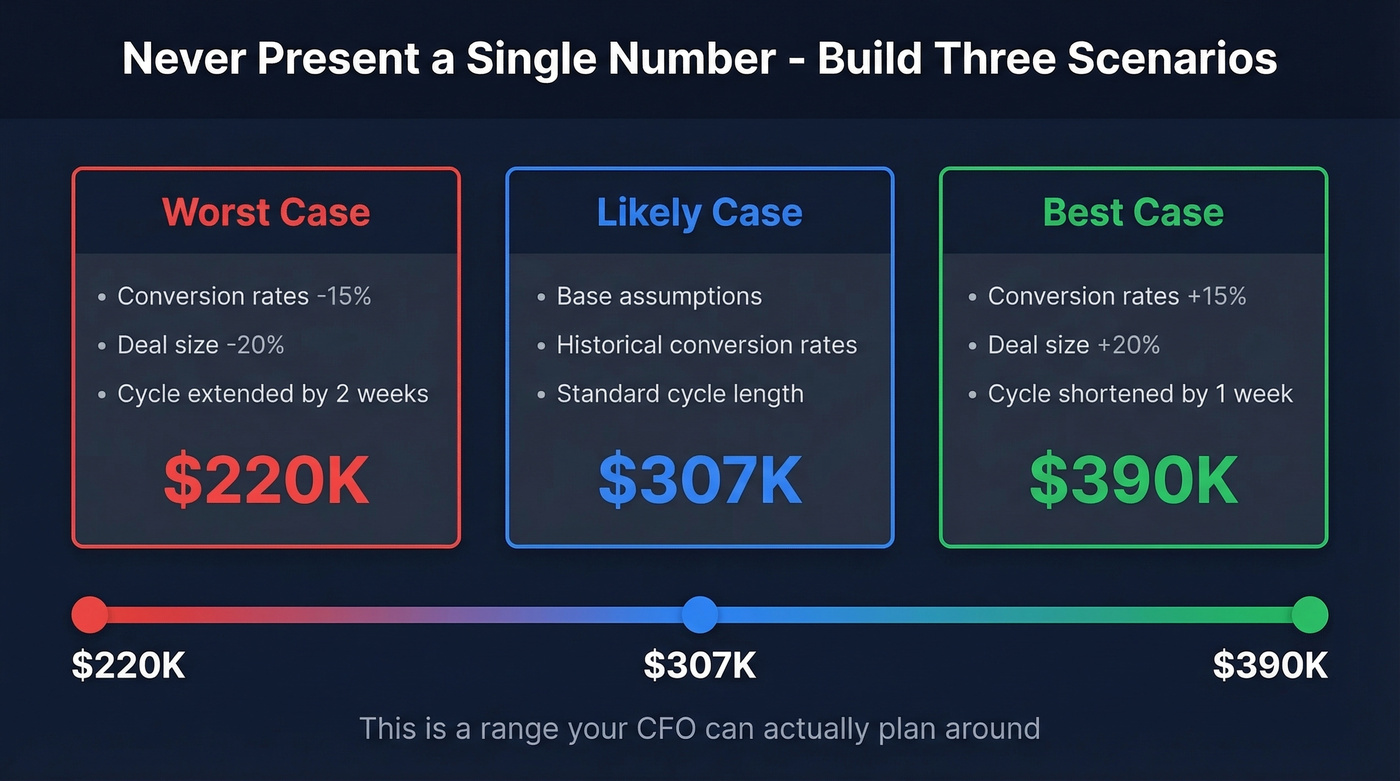
- Best case: conversion rates +15%, deal size +20%, cycle shortened by 1 week
- Worst case: conversion rates -15%, deal size -20%, cycle extended by 2 weeks
- Likely case: your base assumptions
For our example, that's a range of roughly $220K to $390K in new ARR - a spread your CFO can actually plan around. The Xappex scenario template lets you toggle between conservative, baseline, and aggressive scenarios in a single spreadsheet with automatic dashboard updates.
Set a Review Cadence
Weekly for the current quarter. Monthly for next quarter. Quarterly for annual. Forecast accuracy decays fast: 30-day forecasts land at 85-90% accuracy, 60-day at 75-80%, and 90-day at 65-75%. If you're only reviewing monthly, you're flying blind for the period that matters most.
You just read it: 66% of teams can't access clean historical CRM data. Stale contacts, bounced emails, and dead leads poison every forecast you build. Prospeo enriches your CRM with 50+ data points per contact at a 92% match rate - refreshed every 7 days, not every 6 weeks.
Fix your pipeline data and your forecast fixes itself.
How to Measure Forecast Accuracy
Most teams use MAPE (Mean Absolute Percentage Error). The problem: MAPE misleads in sales because small denominators inflate percentage error. If you forecast $10K for a segment that closes $5K, MAPE says you're 100% off. But if you forecast $500K and close $495K, MAPE barely registers the $5K miss.
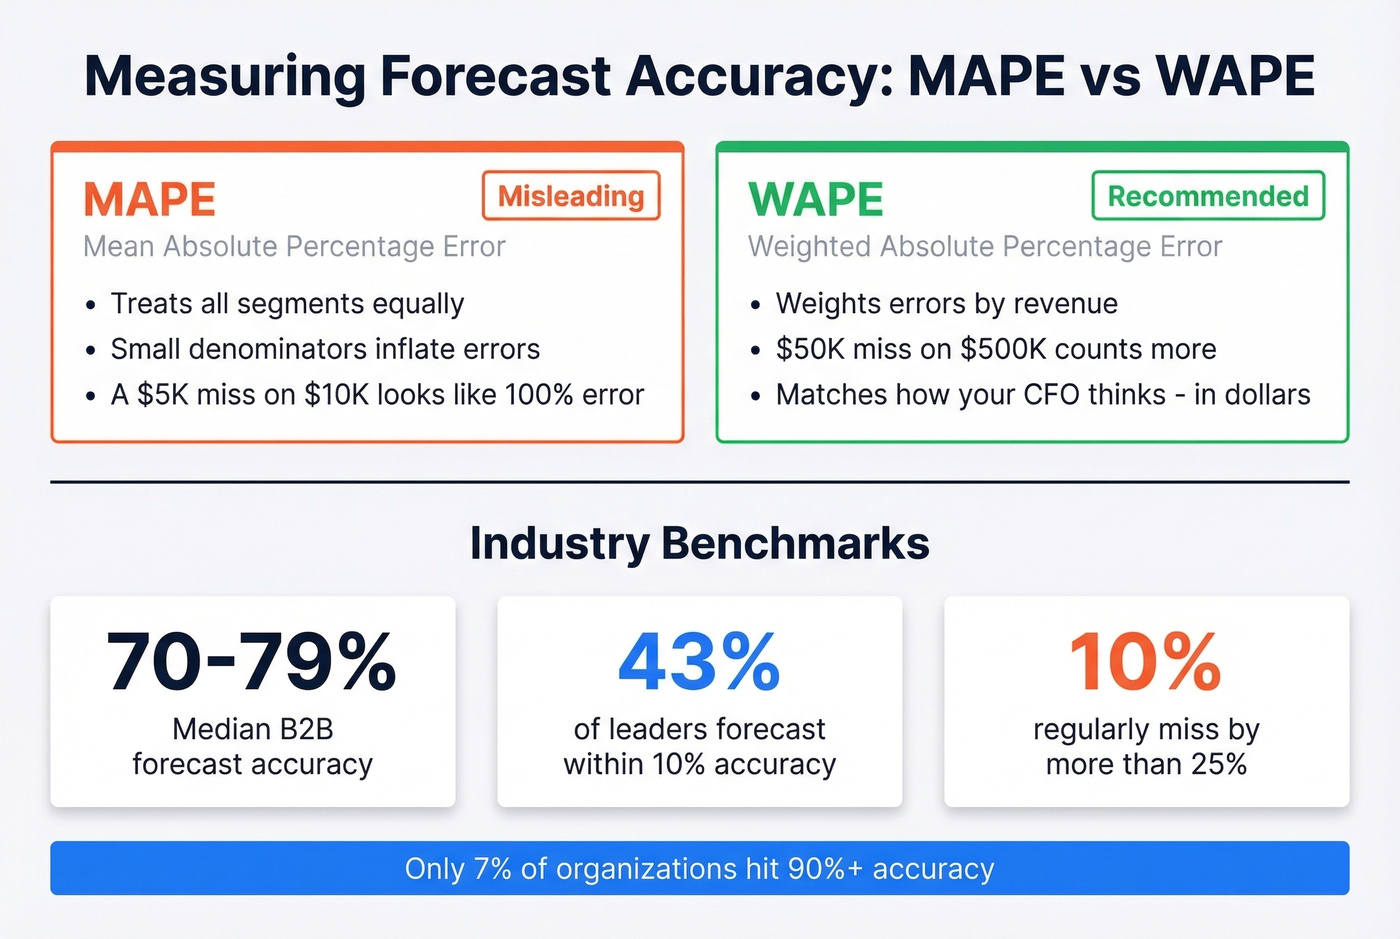
Use WAPE (Weighted Absolute Percentage Error) instead. WAPE weights errors by revenue, so a $50K miss on a $500K segment counts more than a $5K miss on a $10K segment. That's how your CFO thinks about accuracy - in dollars, not percentages.
The benchmarks are sobering. Median B2B forecast accuracy sits at 70-79%, and only 7% of organizations hit 90%+. 43% of sales leaders forecast within 10% accuracy, while 10% regularly miss by more than 25%. If you're in the 70-80% range, you're performing at the median. The goal is getting above it.
Nine Mistakes That Kill Accuracy
Every one of these is fixable. In our experience, most teams are making at least four simultaneously.
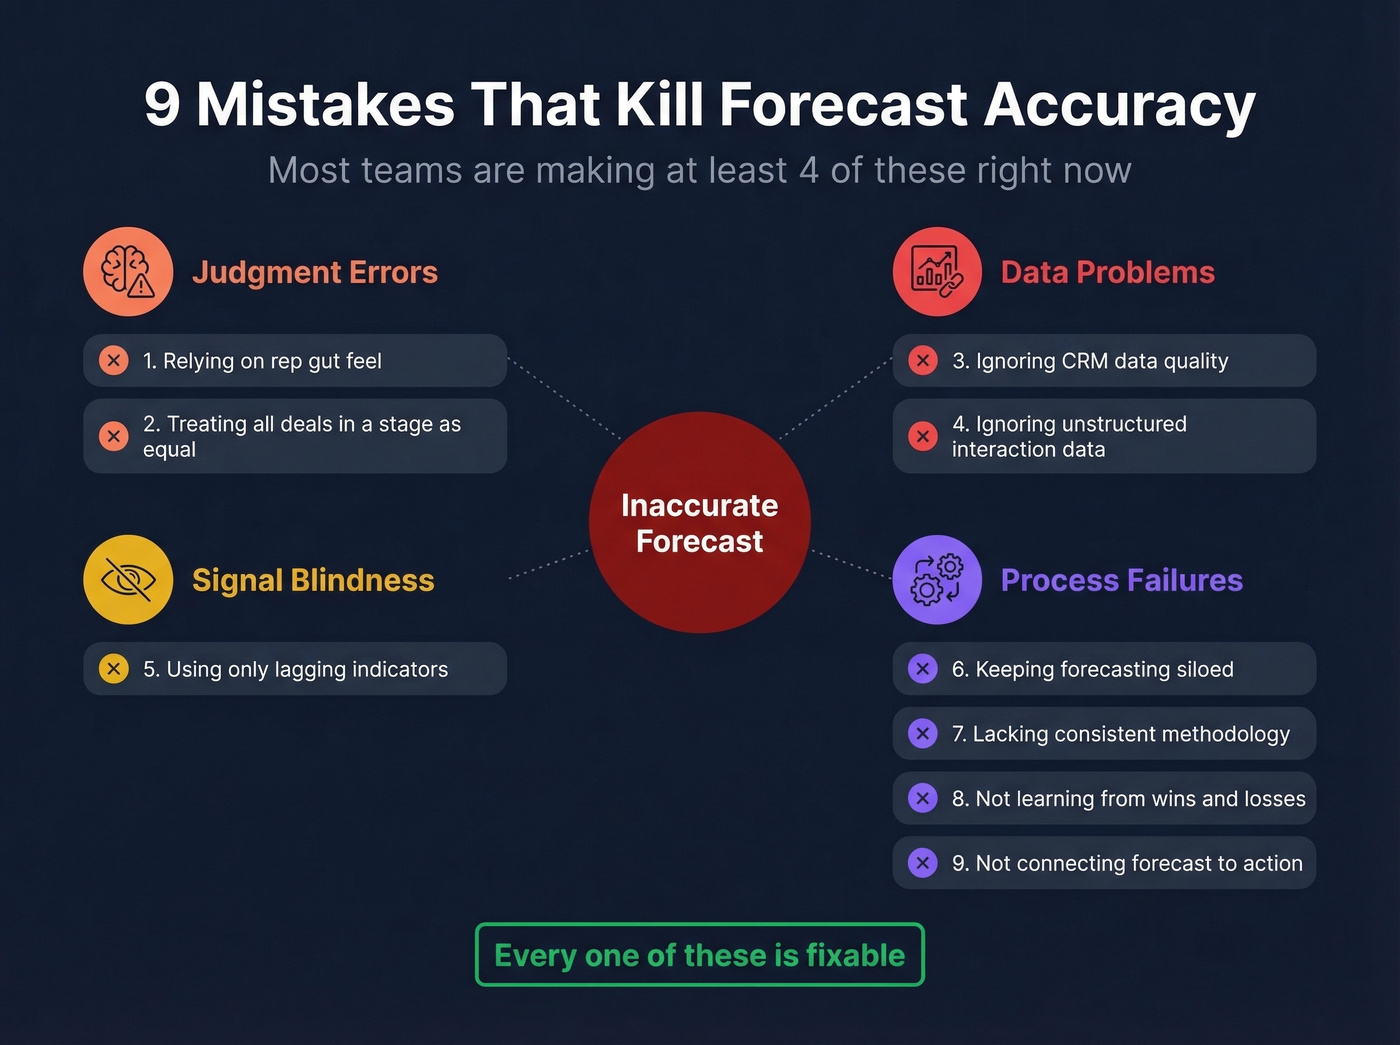
Judgment Errors
Relying on rep gut feel. Reps are optimistic by nature - it's what makes them good at selling and terrible at predicting. Use stage-weighted probabilities, not "I feel good about this one."
Treating all deals in a stage as equal. A $200K deal at Demo with three stakeholders engaged isn't the same as a $200K deal at Demo where only an SDR has responded. Layer engagement signals into your stage probabilities - multi-threading depth, executive involvement, and response velocity all matter.
Data Problems
Ignoring CRM data quality. If a meaningful chunk of your pipeline contacts have bad emails or have changed jobs, your weighted pipeline forecast is built on sand. We've seen teams shave 10-15% off their forecast miss rate just by cleaning contact data on a weekly refresh cycle rather than letting it rot for months.
Ignoring unstructured interaction data. Email reply sentiment, call recordings, and meeting frequency all predict outcomes better than stage labels alone. Teams often default back to spreadsheets even when they have a CRM and conversation intelligence tools, because the underlying data is too messy to trust.
Signal Blindness
Using only lagging indicators tells you what happened, not what's happening. Track leading indicators like new meetings booked, multi-threading depth, and proposal-to-close velocity. If your forecast only looks at stage labels and closed-won history, you're driving with a rearview mirror.
Process Failures
Keeping forecasting siloed. When sales forecasts live in a spreadsheet that finance, marketing, and customer success never see, misalignment is guaranteed. 97% of leaders in the Xactly survey agree sales and finance need to work better together - but the best-performing teams extend that alignment to marketing for pipeline generation and CS for expansion and churn inputs. Shared dashboards with a single source of truth fix this.
Lacking consistent methodology. If every rep forecasts differently, your roll-up is noise. Standardize on one method and train the team. A documented process that everyone follows consistently improves forecast reliability far more than switching tools.
Not learning from wins and losses. Skip this and your probabilities never improve. Run quarterly win/loss reviews that update your stage conversion rates.
Not connecting forecast to action. A forecast that doesn't trigger decisions - hiring, territory changes, pipeline generation sprints - is just a number on a slide. Tie forecast gaps to specific operational responses with clear owners and deadlines.
Forecasting With No Historical Data
If you're pre-revenue or early-stage, your first 10 customers are liars. Not intentionally - they came through your founder network, got white-glove onboarding, and churned at rates that won't hold once you scale.
Build from testable assumptions instead: top-of-funnel capacity x conversion rate x ACV. Show ranges - if you assume 10% conversion, model what happens at 5% and 20%. Treat every forecast as a hypothesis updated monthly, not a prediction carved in stone.
The churn assumption is the most dangerous variable for early-stage companies. Founders underestimate churn because their personal attention doesn't scale. Model it conservatively and you'll thank yourself in six months.
Tools for Sales Forecasting
You don't need expensive software to forecast well. Here's the stack by maturity:
Spreadsheets (free). Still the most common tool for teams under 50 reps. Zapier offers five free templates - simple, daily, monthly, 1-year, and 5-year - in Google Sheets and Excel. They're a great starting point. Graduate to CRM-native forecasting when maintenance becomes a bottleneck.
CRM-native forecasting. Salesforce (~$25-300/user/mo depending on edition), HubSpot (free CRM; Sales Hub starts around ~$20/user/mo), and Pipedrive (~$14-99/user/mo) all include basic forecasting. Good enough for most mid-market teams.
Dedicated platforms. Clari (~$30-50K+/year) and Gong Forecast (~$100-150/user/mo) add AI-driven deal inspection and pipeline analytics. Worth it when your pipeline is complex enough that spreadsheet formulas can't capture deal health. Skip these if you're under 20 reps - the ROI doesn't pencil out until you've got enough deal volume to train the models.
Data quality layer. Every tool on this list produces better forecasts when the underlying contact data is clean. Prospeo's enrichment API returns 50+ data points per contact at a 92% match rate, with a 7-day refresh cycle that keeps your CRM current. Free tier available, no contracts. If you're evaluating vendors, start with a quick scan of data enrichment services.
That last point is the unsexy truth nobody wants to hear: the tool matters less than the data feeding it.
Garbage pipeline data is why 4 in 5 leaders miss their forecast. Every deal sitting on a bounced email or wrong contact inflates your weighted pipeline with phantom revenue. Prospeo delivers 98% email accuracy and 125M+ verified mobile numbers so your pipeline reflects reality.
Stop forecasting on contacts that don't exist.
FAQ
What's the most accurate sales forecasting method?
AI/ML-assisted forecasting delivers the tightest variance at ±8-15%, but weighted pipeline (±18-25%) offers the best balance of accuracy and simplicity for most teams. Method matters less than data quality - a clean weighted pipeline beats a dirty AI model every time.
How often should I update my forecast?
Weekly for the current quarter, monthly for next quarter, quarterly for annual planning. A 30-day forecast runs 85-90% accurate, but a 90-day forecast drops to 65-75%. The closer the horizon, the more frequently you should review.
Can I create a sales forecast in a spreadsheet?
Yes - spreadsheets work well for teams under 50 reps. Zapier offers five free templates in Google Sheets and Excel covering daily, monthly, and multi-year horizons. Move to CRM-native forecasting when spreadsheet maintenance starts eating more time than the forecasting itself.
How do you forecast sales for a new business?
Build from testable assumptions: top-of-funnel capacity x conversion rate x average deal size. Model optimistic and conservative scenarios, then update monthly as real data replaces guesses. Don't extrapolate from your first 10 customers - they aren't representative of your eventual market.
How does bad contact data affect forecast accuracy?
Outdated emails, wrong titles, and stale accounts directly degrade your pipeline coverage and deal ownership assumptions. If 15% of your pipeline contacts have changed jobs since you last checked, your weighted forecast is overstating reality by that same margin. A weekly data refresh cycle is the single highest-leverage fix for teams whose forecasts consistently miss because pipeline data has decayed.