How to Improve Forecast Accuracy: A Practitioner's Guide
It's the quarterly board meeting. Someone asks, "How accurate were our forecasts last quarter?" The room goes quiet. Nobody knows - because nobody measured. This isn't an edge case. A thread on r/SalesOperations laid it bare: most teams talk about forecasting constantly but never formally track how close they land to actuals. They're flying blind and calling it strategy.
Learning how to improve forecast accuracy isn't about buying a fancier tool or hiring a data scientist. It's about fixing the boring stuff first, measuring relentlessly, and knowing when more precision doesn't even matter.
The Short Version
If you're pressed for time, these three moves cover 80% of the value:
- Measure forecast vs. actuals every period. Most teams skip this entirely. You can't improve what you don't track.
- Clean your input data before touching your model. Academic research confirms that data quality drives forecast accuracy, which in turn drives business performance. Bad data beats good algorithms every time.
- Stop chasing a single accuracy number. A simulation study across 32,000+ time series found that 80% of forecast accuracy improvements had zero economic impact. Focus on forecast value, not forecast precision.
Why Accuracy Matters (But Not How You Think)
The payoff isn't a prettier dashboard. It's operational.
McKinsey estimates that AI-driven demand forecasting can reduce forecast errors 30-50%, cut lost sales from stockouts up to 65%, and enable inventory reductions of 20-50%. For any team trying to reduce forecast errors at scale, those numbers represent real cash freed up and revenue protected.
A recent academic study using SEM-PLS modeling confirmed the causal chain: data quality improves forecasting accuracy, and forecasting accuracy mediates the effect on business performance. Better data, better forecasts, better outcomes. The chain breaks at any weak link. Invest in accuracy without fixing data quality upstream and you're wasting effort. Fix data quality but never measure accuracy and you're leaving money on the table.
What "Good" Actually Looks Like
Universal Accuracy Targets Don't Work
If someone tells you "aim for 80-85% forecast accuracy," ask them: for which products? At what aggregation level? Over what time horizon?
A single accuracy target across an entire portfolio is meaningless without context. ToolsGroup's benchmark analysis makes this point well - aggregate accuracy can mask wild SKU-level variability, and bias can hide behind a number that looks fine on a slide. An older but still instructive industry survey found average forecast errors of ~39% in CPG and ~36% in chemicals (measured by WMAPE). Those numbers shock people who assume "good" means 85%+. Reality is messier.
Benchmarks by Demand Type
Instead of one target, set expectations by demand pattern:
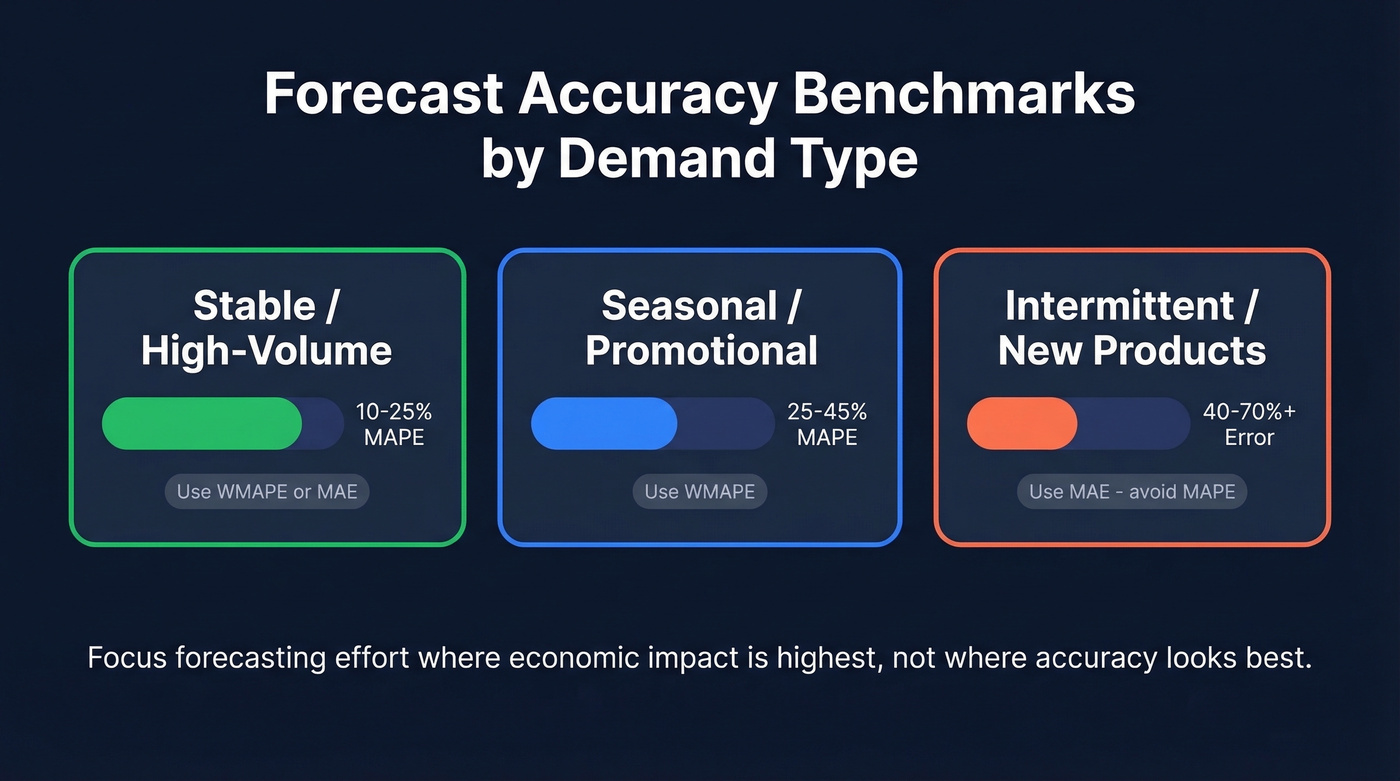
| Demand Type | Typical Error Band | Recommended Metric |
|---|---|---|
| Stable / high-volume | 10-25% MAPE | WMAPE or MAE |
| Seasonal / promotional | 25-45% MAPE | WMAPE |
| Intermittent / new | 40-70%+ | MAE (avoid MAPE) |
Your stable, high-volume products should be tight. Your new product launches and intermittent SKUs? Accept wider bands and focus forecasting effort where the economic impact is highest.
Choosing the Right Metric
The metric you pick changes which forecast "wins." We've seen teams argue for weeks about accuracy when the real problem was they were using MAPE on a portfolio full of low-volume items - where MAPE breaks completely.
A Quick Worked Example
Imagine a forecast of 100 vs. actual of 80 for Product A, and a forecast of 10 vs. actual of 5 for Product B. MAPE says Product B is the bigger miss (100% error vs. 25%). MAE says Product A is worse (20 units vs. 5 units). Which matters more depends entirely on your business - and that's why metric selection isn't academic. It changes what you optimize for.
When to Use Each Metric
| Metric | Best For | Watch Out For |
|---|---|---|
| MAPE | Cross-scale communication | Breaks at zero; biases low |
| MAE | Robust general-purpose | Doesn't penalize big misses |
| RMSE | When large errors are costly | Sensitive to outliers |
| WMAPE | Business-weighted accuracy | Requires volume data |
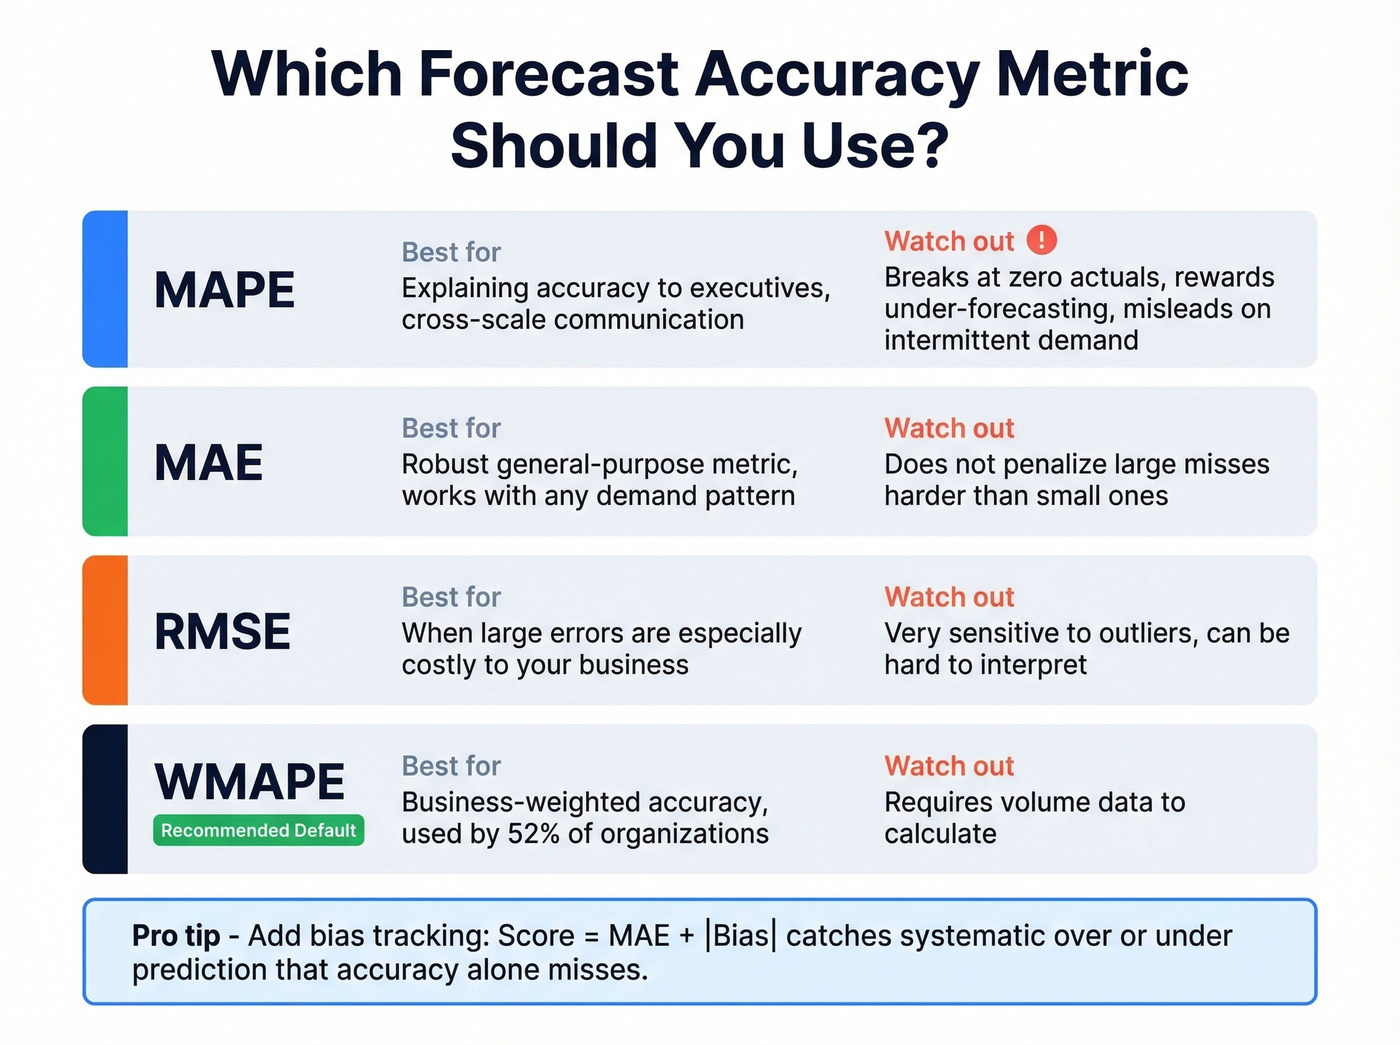
WMAPE is the most common in practice - 52% of organizations use it - and for good reason. It weights errors by volume, so a 50% miss on a product you sell 10 units of doesn't drown out a 5% miss on your top seller. If you're only going to pick one metric, WMAPE is the safest default.
MAPE is the easiest to explain to executives but the most dangerous to rely on. It can't handle zero actuals, and it tends to reward under-forecasting. If your portfolio includes intermittent demand, MAPE will mislead you.
The Combined Score Worth Adopting
Nicolas Vandeput proposes a combined metric: Score = MAE + |Bias|. This tracks accuracy and systematic error simultaneously. A forecast can have low MAE but consistently over-predict - the bias component catches that. If you implement one metric change this quarter, make it this one.
You just read it: data quality drives forecast accuracy, and forecast accuracy drives business performance. The chain breaks at any weak link. Prospeo refreshes 300M+ profiles every 7 days with 98% email accuracy - so your CRM reflects reality, not stale records from six weeks ago.
Fix your pipeline data and your forecasts fix themselves.
The Uncomfortable Truth: Accuracy Doesn't Equal Value
Here's where most forecast improvement articles stop being useful. They assume more accuracy always equals better outcomes. The data says otherwise.
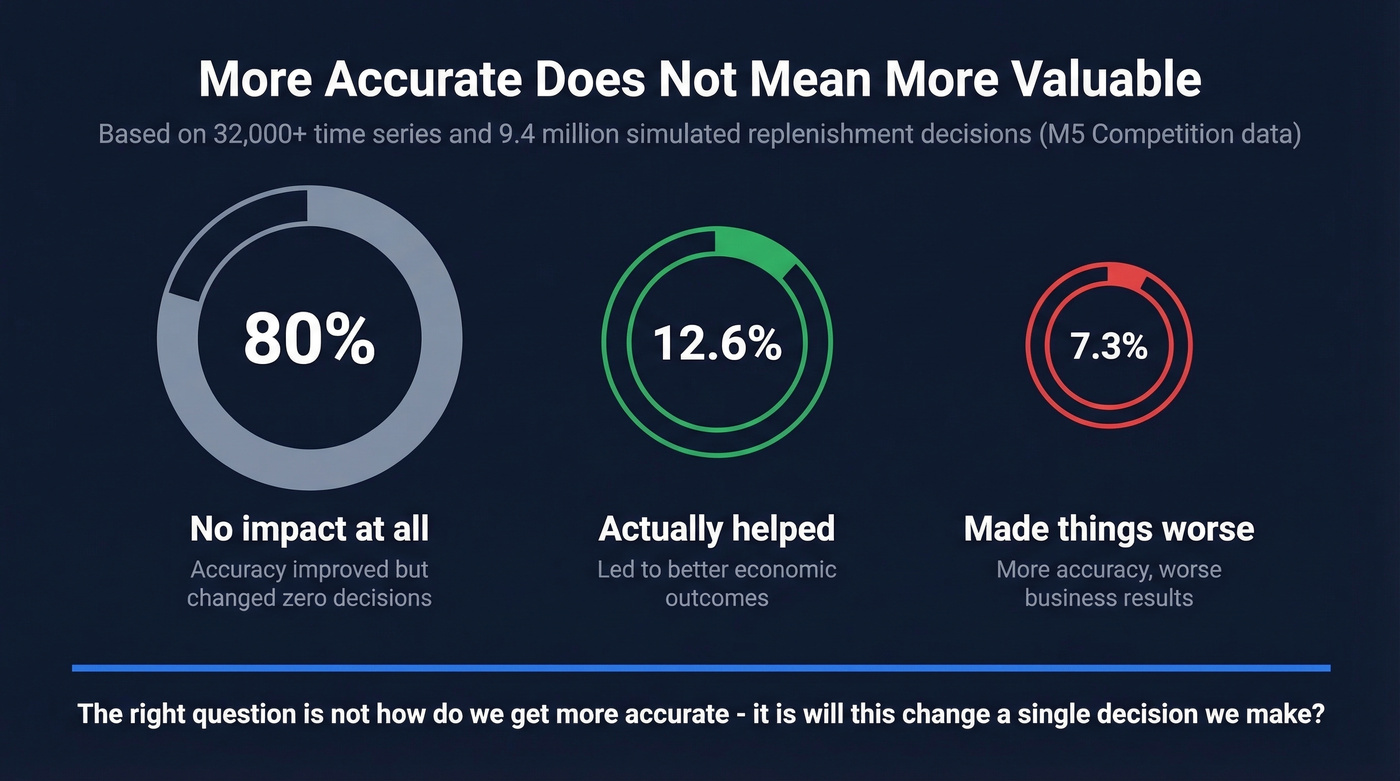
A simulation study using M5 competition forecast sets - a well-known forecasting benchmark spanning 32,000+ time series and 9.4 million simulated cases - tested what happens when you plug a "more accurate" forecast into actual replenishment decisions:
- 80% of accuracy improvements had no impact on decisions or economics
- 12.6% led to better economic performance
- 7.3% actually worsened performance
Read that again. Nearly one in thirteen accuracy improvements made things worse. Four out of five didn't matter at all.
This doesn't mean accuracy is irrelevant - it means chasing precision for its own sake is a trap. The question isn't "how do we get from 75% to 85%?" It's "will going from 75% to 85% change a single decision we make?" If the answer is no, spend your time elsewhere.
Here's the thing: if your deals average under $15K, you probably don't need 90th-percentile forecast accuracy. The cost of achieving it will exceed the cost of being wrong. Invest in speed and pipeline coverage instead.
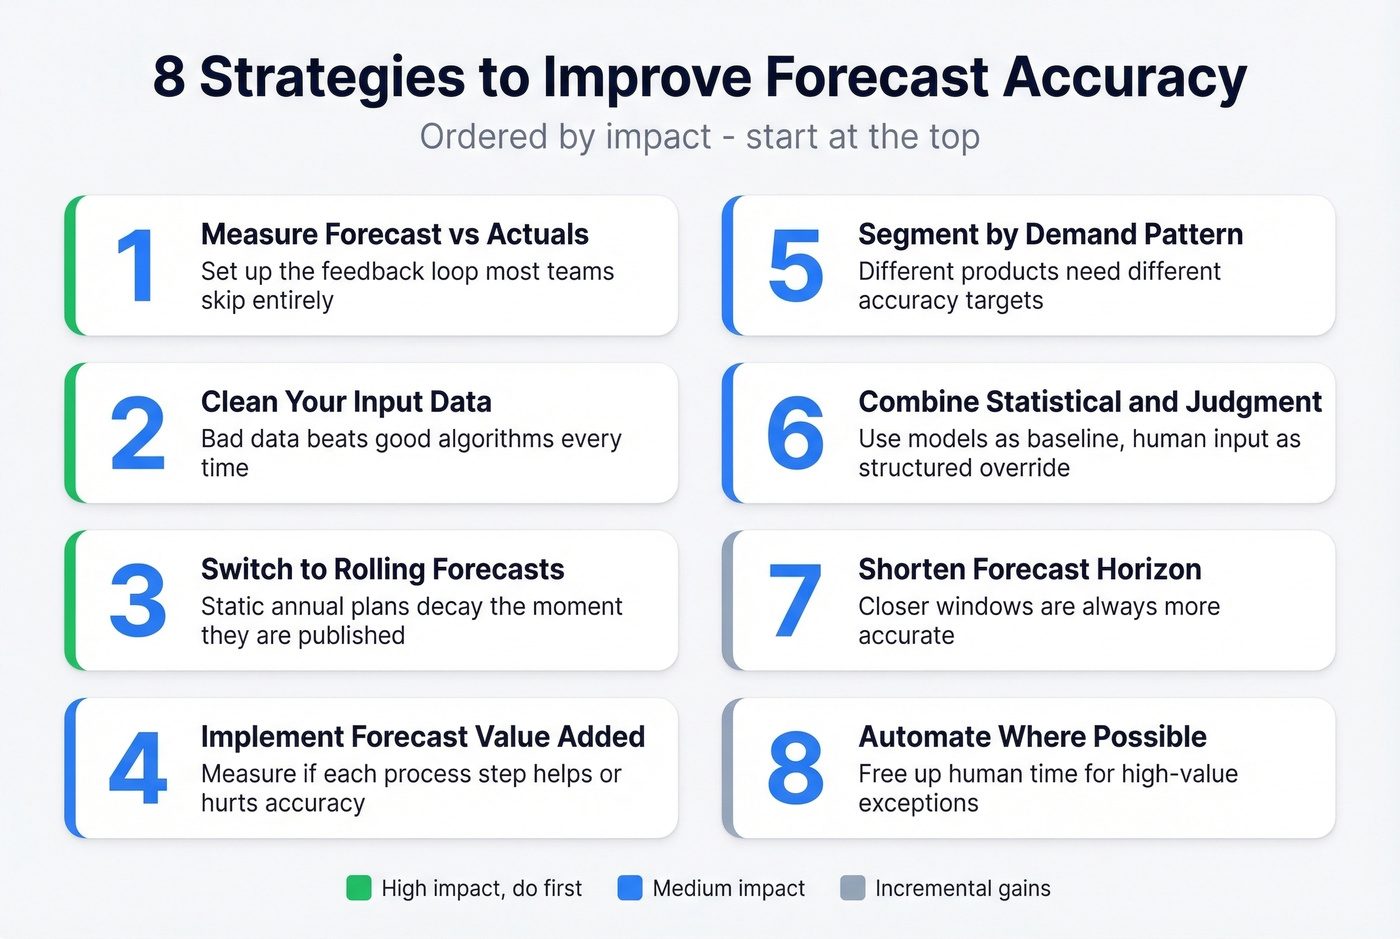
8 Strategies That Actually Work
1. Measure Forecast vs. Actuals Every Period
This is the feedback loop most teams skip. The r/SalesOperations consensus is that most orgs don't consistently track forecast-to-actual variance. Set up a simple comparison at the same aggregation level you forecast - SKU, region, product family, deal stage - and review it every cycle. Monthly at minimum.
One critical nuance most guides miss: align your accuracy measurement window to your actual lead time. Comparing current period demand with the forecast isn't appropriate; apply a lag offset, usually lead time. The goal is to test whether your forecast was useful when decisions were made - not whether you can "remember" what just happened.
A DTC brand applied this discipline alongside data cleanup and went from 50% forecast accuracy to 80% in 30 days, virtually eliminating stockouts in the process. That's not a multi-year transformation. That's one month of measuring, cleaning, and iterating.
2. Clean Your Input Data First
The academic evidence is unambiguous: data quality drives forecast accuracy, which drives business performance. Before you touch your model, handle the basics - deduplicate records, validate contact information, remove stale entries, and verify that deals in your pipeline are real.
For demand forecasting, this means constructing "true demand history" by adjusting for lost sales, promotions, substitutions, and returns before feeding data into your models. Raw sales history understates true demand whenever you had stockouts.
For sales forecasting specifically, CRM data quality is one of the biggest levers. If roughly a quarter of your contacts have changed jobs, emails bounce, or phone numbers are disconnected, you're forecasting on phantom deals. Your deal flow looks full, but it's inflated with ghosts. Any enrichment tool that keeps your CRM current - verifying emails, refreshing job titles, flagging departed contacts - will do more for prediction quality than a model upgrade. When Snyk rolled out Prospeo for systematic data hygiene across 50 AEs, their bounce rate dropped from 35-40% to under 5%, and AE-sourced pipeline jumped 180%.
3. Switch to Rolling Forecasts
Static annual plans decay the moment they're published. By Q2, your January assumptions about hiring pace, market conditions, and pipeline coverage are already stale.
Rolling forecasts - typically on a 12- to 18-month horizon, updated monthly or quarterly - adapt to reality. This is one of the most commonly cited anti-patterns in finance forecasting: teams build a plan once and then spend the year explaining variance instead of re-forecasting. Switching to a rolling cadence is one of the simplest ways to sharpen predictions without touching your model at all.
4. Implement Forecast Value Added (FVA)
Instead of setting absolute accuracy targets ("hit 85%"), set FVA targets: "be 10% more accurate than the statistical baseline." This reframes the conversation from arbitrary benchmarks to measurable improvement - and it's the single most underused management technique in forecasting.
FVA measures whether each step in your process - statistical baseline, sales override, management adjustment - actually improves accuracy or makes it worse. SAS's FVA whitepaper lays out the implementation: compare each layer's output against a naive baseline like a simple moving average. If your sales team's manual overrides consistently make the forecast less accurate, you've found your problem.
Advanced models can often outperform moving averages by 20-40%, which gives you a realistic ceiling for what "good" looks like in your specific context. If your model can't beat a simple moving average, fire it.
5. Segment Your Portfolio
Not every product deserves the same forecasting effort. High-volume, stable items (A/X in ABC/XYZ classification) need tight statistical models. Intermittent, low-volume items (C/Z) might not be worth forecasting at all - safety stock rules may outperform any model. Triage your portfolio so your team spends time where accuracy improvements actually change decisions and economics.
Skip this if your catalog is under 50 SKUs. The overhead of segmentation won't pay off until you have enough products for meaningful groupings.
6. Layer Scenario Planning
Single-point forecasts create false confidence.
Build multiple scenarios - base, upside, downside - and attach probabilities. Use a framework like PESTEL to systematically scan external variables: political shifts, economic cycles, social trends, technology disruption, environmental regulation, and legal changes. This doesn't replace your point forecast; it wraps it in context that makes it useful for decision-making rather than just measurement. When stakeholders can see the range of outcomes and their likelihoods, they make better bets.
7. Know When to Invest in AI/ML
"Should we use machine learning?" is the wrong first question. The right one: "Have we exhausted process improvements?"
ML reduces forecasting errors 20-50% vs. traditional methods, and 88% of businesses using ML hit forecast accuracy targets compared to 64% using spreadsheets. Lennox Residential used ML with clustering across 200 micro-climates and saw service levels jump 16% with inventory turns up 25%.
But implementation costs $75K-$500K+, with ROI typically arriving in 12-24 months. Clean data, proper metrics, FVA, rolling forecasts - these are free or cheap and often deliver more impact than a six-figure ML project built on top of dirty data.
8. Use Cross-Functional Input (Carefully)
Breaking silos between finance, sales, and operations improves forecasts - in theory. One practitioner on Reddit reported their margin of error dropped from ~15% to ~5% after changing how sales calls were scored and analyzed. That's a real signal.
But more input doesn't always help. A case study where customer forecasts were added as ML features showed only a ~3% improvement - noise, not signal. Test whether additional data sources actually improve your baseline before building complex cross-functional pipelines. The overhead of collecting, cleaning, and integrating data from three departments isn't free.
Mistakes That Kill Accuracy
The two most destructive anti-patterns are overfitting and confirmation bias. Overfitting means your model perfectly predicts the past and fails on the future - simpler models often generalize better. Confirmation bias means adjusting forecasts to match what leadership wants to hear, not what the data says. Both are invisible until you measure forecast vs. actuals rigorously.
Beyond those, watch for:
- Ignoring seasonality. Surprisingly common, especially in SaaS where teams assume linear growth.
- Static models. Building once and never updating. Markets change; your forecast should too.
- Data integrity neglect. If your CRM is full of stale contacts and phantom deals, no model saves you.
- Unrealistic assumptions. For SaaS teams without historical data, use industry benchmarks as starting points: SMB churn runs 5-7% monthly, mid-market 2-4%, enterprise 0.5-1.5%. Don't assume zero churn because it feels optimistic.
Tools Worth Considering
This isn't a tools article, but the right stack matters. Think in categories:
ERP/demand planning: NetSuite, SAP IBP, or ToolsGroup for supply chain forecasting. CRM forecasting: Salesforce or HubSpot's native forecast modules handle pipeline-based forecasting for most sales teams (see Salesforce options and tradeoffs). Pipeline data quality: Prospeo keeps CRM data current with 98% email accuracy and a 7-day refresh cycle, so your pipeline numbers reflect real deals rather than stale contacts (compare data enrichment services if you're evaluating vendors). Free tier available, integrates with Salesforce and HubSpot. FP&A: Anaplan, Adaptive Planning, or Pigment for financial forecasting and scenario modeling.
Let's be honest: the tool matters less than the process. A team with clean data and disciplined measurement in a spreadsheet will outforecast a team with a $200K platform and dirty inputs every single time.
80% of forecast accuracy improvements had zero economic impact - because the underlying data was already broken. Prospeo's 5-step verification and 92% enrichment match rate ensure every deal in your pipeline maps to a real buyer with real contact data. That's the input quality your forecast model actually needs.
Stop optimizing models built on bad data. Fix the inputs first.
The thread that opened this article - the one where nobody tracked accuracy - doesn't have to describe your team. Start with one habit: compare your forecast to actuals next month. Then clean the data feeding it. Those two foundations are how to improve forecast accuracy before anything else. Everything after is optimization.
FAQ
What's a realistic forecast accuracy target?
There's no universal number. Set targets by demand segment. Stable, high-volume products can hit 75-90% accuracy (WMAPE), while intermittent or new products may only reach 30-60%. Use FVA targets - improvement over a naive baseline - rather than arbitrary absolute thresholds to measure real progress.
How often should I measure forecast accuracy?
Every forecast cycle, monthly at minimum. Compare forecast vs. actuals at the same aggregation level you forecast (SKU, region, product family, deal stage) and apply a lead-time offset. If you're not measuring consistently, you're guessing, not forecasting.
Can bad CRM data really affect sales forecasts?
It's one of the most common sources of forecast inflation. When roughly 25% of pipeline contacts have changed jobs or carry invalid emails, you're projecting revenue against phantom deals. Regular data enrichment and verification catch these gaps before they silently corrupt your numbers.
What is forecast value added (FVA)?
FVA measures whether each step in your forecasting process - statistical baseline, sales override, management adjustment - makes the forecast more or less accurate compared to a naive model. It's the best way to identify which human overrides help and which ones consistently make things worse.
Does machine learning improve forecast accuracy?
In most cases, yes. ML reduces errors 20-50% vs. traditional methods, and 88% of ML-using businesses hit accuracy targets vs. 64% on spreadsheets. But ML built on dirty data underperforms a clean spreadsheet. Exhaust process improvements first, then layer in ML where the $75K-$500K+ cost is justified by the decision impact.