How to Prevent Churn Before It Shows Up in Your Board Deck
You're staring at the Q1 board deck. Revenue churn ticked up again - third quarter in a row. The CS team says engagement is "fine," but three mid-market accounts ghosted renewal calls last month. If you're trying to figure out how to prevent churn, you're probably already behind.
Here's the thing: you don't have a churn problem. You have a measurement problem, an onboarding problem, and a data problem, and they're compounding. Your team is patching the gaps with three or four disconnected tools across feedback collection, billing recovery, and cancellation flows - each with its own dashboard, none talking to each other. That fragmentation is the real enemy.
Most teams treat churn like a single metric to report. It's not. It's a system of failures, each with a different root cause and a different fix.
Three Moves That Matter Most
If you're short on time:
- Separate voluntary from involuntary churn in your reporting today. They require completely different interventions. Lumping them together guarantees you'll misdiagnose the problem.
- Build a health score with leading indicators, not lagging ones. Login counts don't predict churn. Feature adoption depth and champion engagement do.
- Fix your first 90 days. Onboarding is your highest-leverage retention lever - 40-60% of early cancellations trace directly to it.
Every one of these depends on reaching the right people with accurate data. Your save campaigns, QBR invitations, and renewal outreach are only as good as the contact information behind them.
What Causes Customer Churn
Voluntary churn is a customer decision. They cancel because of poor fit, a competitor, bad experience, or shifting priorities. This is the churn most teams obsess over, and it's the hardest to fix because it's a product and relationship problem wrapped together.
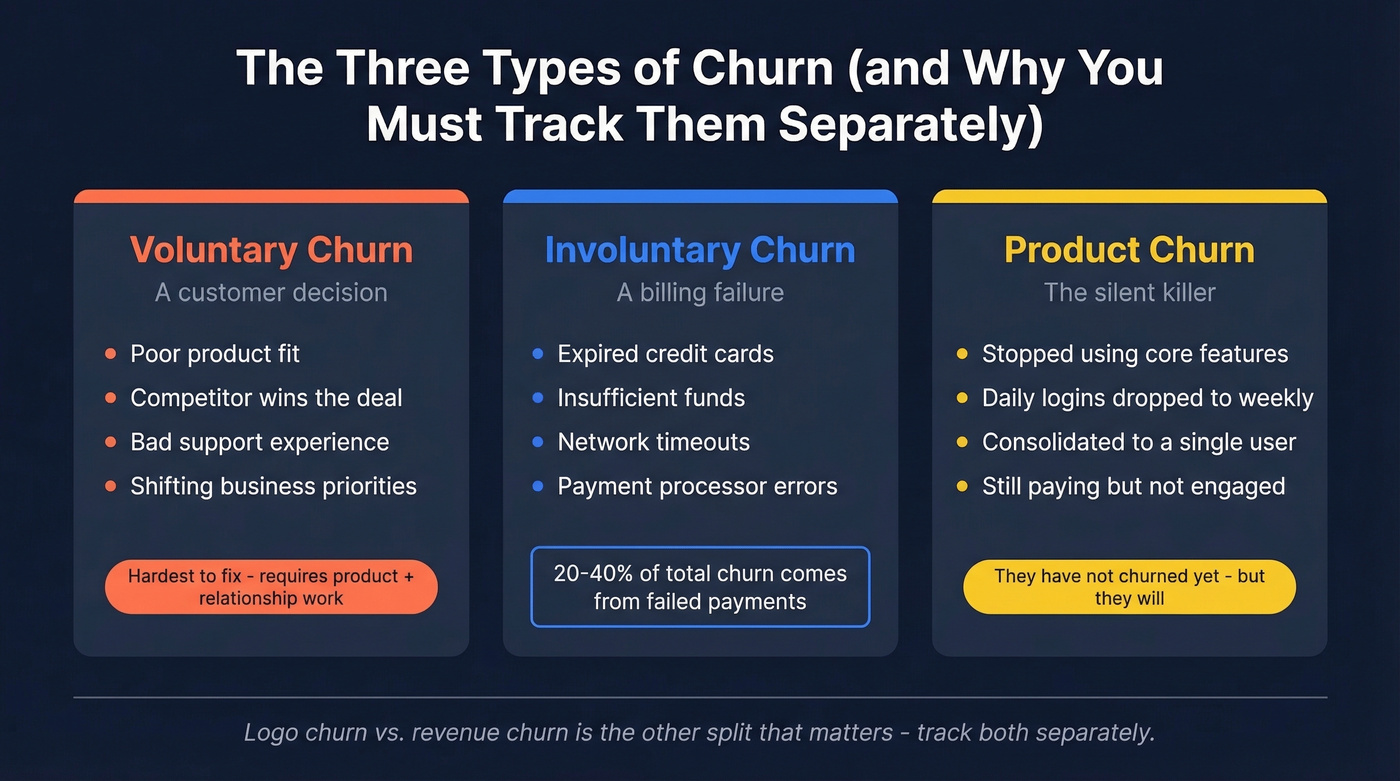
Involuntary churn is a billing failure. Expired cards, insufficient funds, network timeouts. Practitioners on r/SaaS consistently flag that involuntary churn is "bigger than people think" - 10-20% of churn from failed payments alone. In subscription businesses overall, involuntary churn often accounts for 20-40% of total churn.
Product churn is the early warning nobody tracks. The customer is technically still paying but has stopped using core features, dropped from daily to weekly logins, or consolidated usage to a single user. They haven't churned yet. They will.
Logo churn vs. revenue churn is the other split that matters. Losing ten $500/mo accounts hurts differently than losing one $50,000/mo account, even if the logo count is identical. Track both.
How to Measure Churn Correctly
The formulas are simple. Getting them right is where teams stumble.
Logo churn rate = Customers lost during period / Customers at start of period
Revenue churn rate = (Lost MRR - Expansion MRR) / Starting MRR
A worked example: you start the month with $100,000 MRR. You lose $3,000 to cancellations and $2,000 to downgrades, but add $4,000 in expansion revenue from existing customers. Your net revenue churn is ($5,000 - $4,000) / $100,000 = 1.0%. That's a very different story than the 5% gross number.
The common mistakes we see over and over:
- Mixing new sales into the denominator. New customers acquired during the period don't belong in your churn calculation. They distort the rate.
- Combining logo and revenue churn into one number. They tell different stories. Report them separately.
- Counting trial users as customers. If they never converted, they didn't churn. They just didn't buy.
- Ignoring segment differences. Your enterprise churn rate and your SMB churn rate are two different businesses. Blending them hides the signal.
2026 Churn Benchmarks
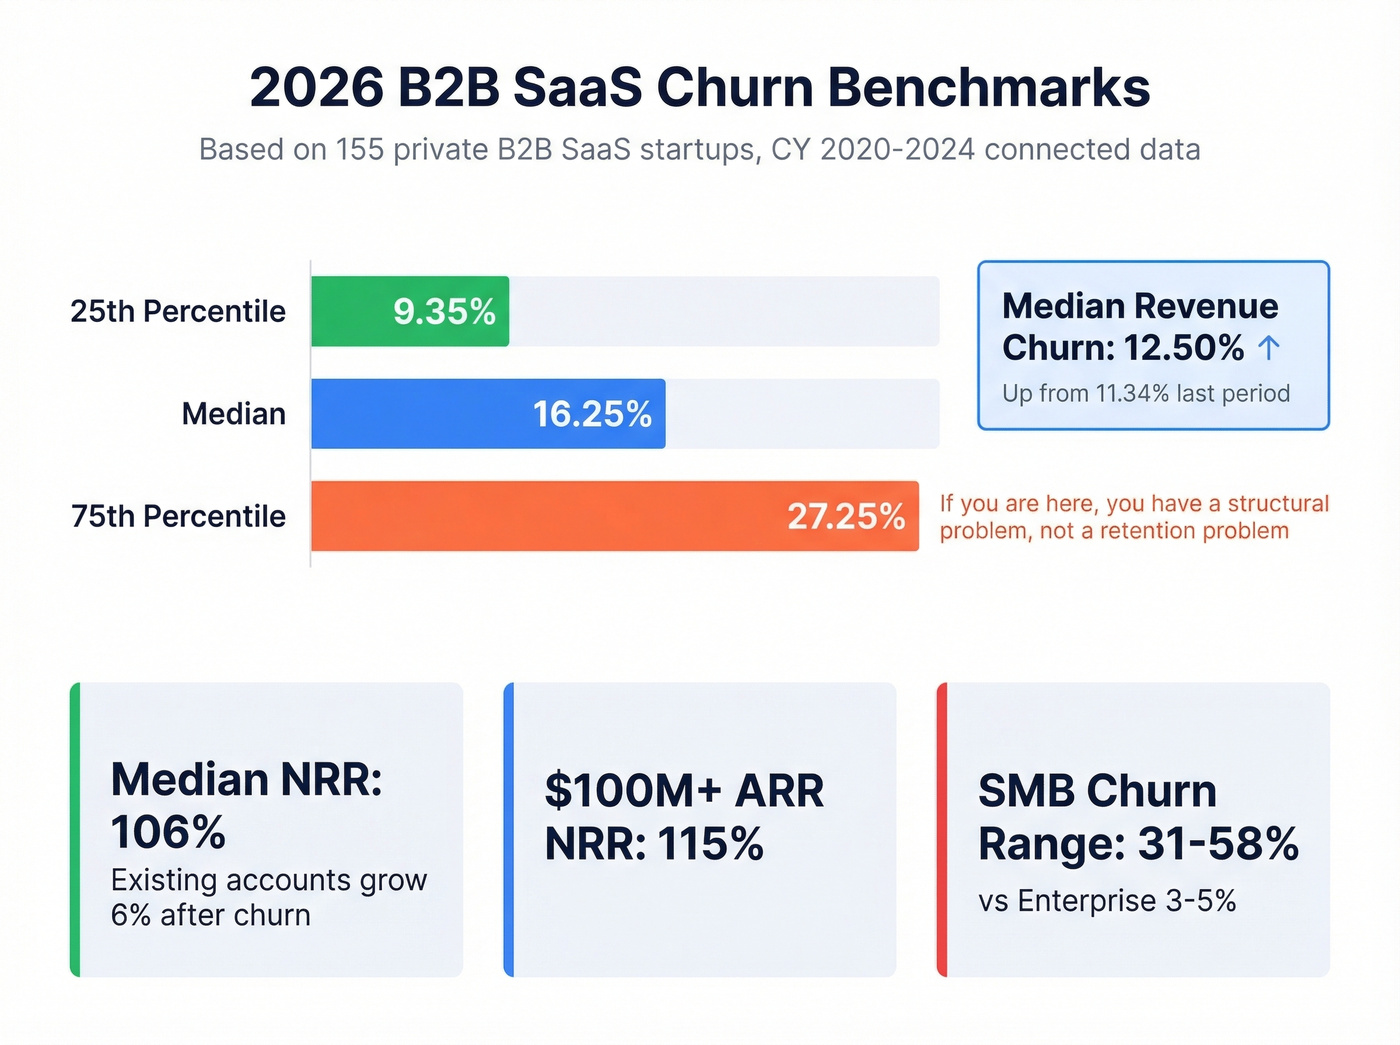
Let's ground this in real numbers. Lighter Capital's benchmark study analyzed 155 private B2B SaaS startups using connected business data (not a survey), covering CY 2020-2024.
| Percentile | Annual Customer Churn | Annual Revenue Churn |
|---|---|---|
| 25th | 9.35% | - |
| Median | 16.25% | 12.50% |
| Mean | 20.46% | - |
| 75th | 27.25% | - |
Median revenue churn increased from 11.34% to 12.50% between reporting periods. That's not a blip - it's a trend worth watching.
The metric you should actually care about is Net Revenue Retention. Median NRR across private SaaS sits at 106%, meaning the average company grows existing accounts by 6% annually even after churn. Companies above $100M ARR hit a median NRR of 115%. If your NRR is below 100%, you're shrinking from within - no amount of new logo acquisition fixes that.
The range across verticals is enormous. Enterprise software companies typically see 3-5% annual churn. SMB-focused products run 31-58%. Education technology revenue churn jumped 71% year over year, and customer churn doubled from 11% to 22%. Healthcare revenue churn spiked 67%.
Look, if your average deal size is under $5k and you're spending six figures on churn prevention tooling, you're solving the wrong problem. Your unit economics don't support the intervention cost. Fix your ICP and pricing first - the churn will follow.
If you're above the 75th percentile at 27.25% annual customer churn, you don't have a retention problem. You have a structural problem. Either your ICP is wrong, your product isn't delivering value, or your onboarding is broken. Probably all three.
Your churn problem might be a data problem. When QBR invitations bounce and renewal emails hit dead inboxes, at-risk accounts slip away silently. Prospeo's 98% verified emails and 125M+ direct dials mean your CS team reaches the right champion before the account goes dark.
Stop losing accounts to outdated contact data.
Build a Health Score That Predicts Churn
A health score that reports churn after it happens is useless. You need one that predicts it 90-180 days out.
The Four-Category Framework
Start by reverse-engineering your churned accounts. Compare them against renewed and expanded accounts, looking back 90, 180, and 270 days for leading signals. You'll find patterns across four categories:
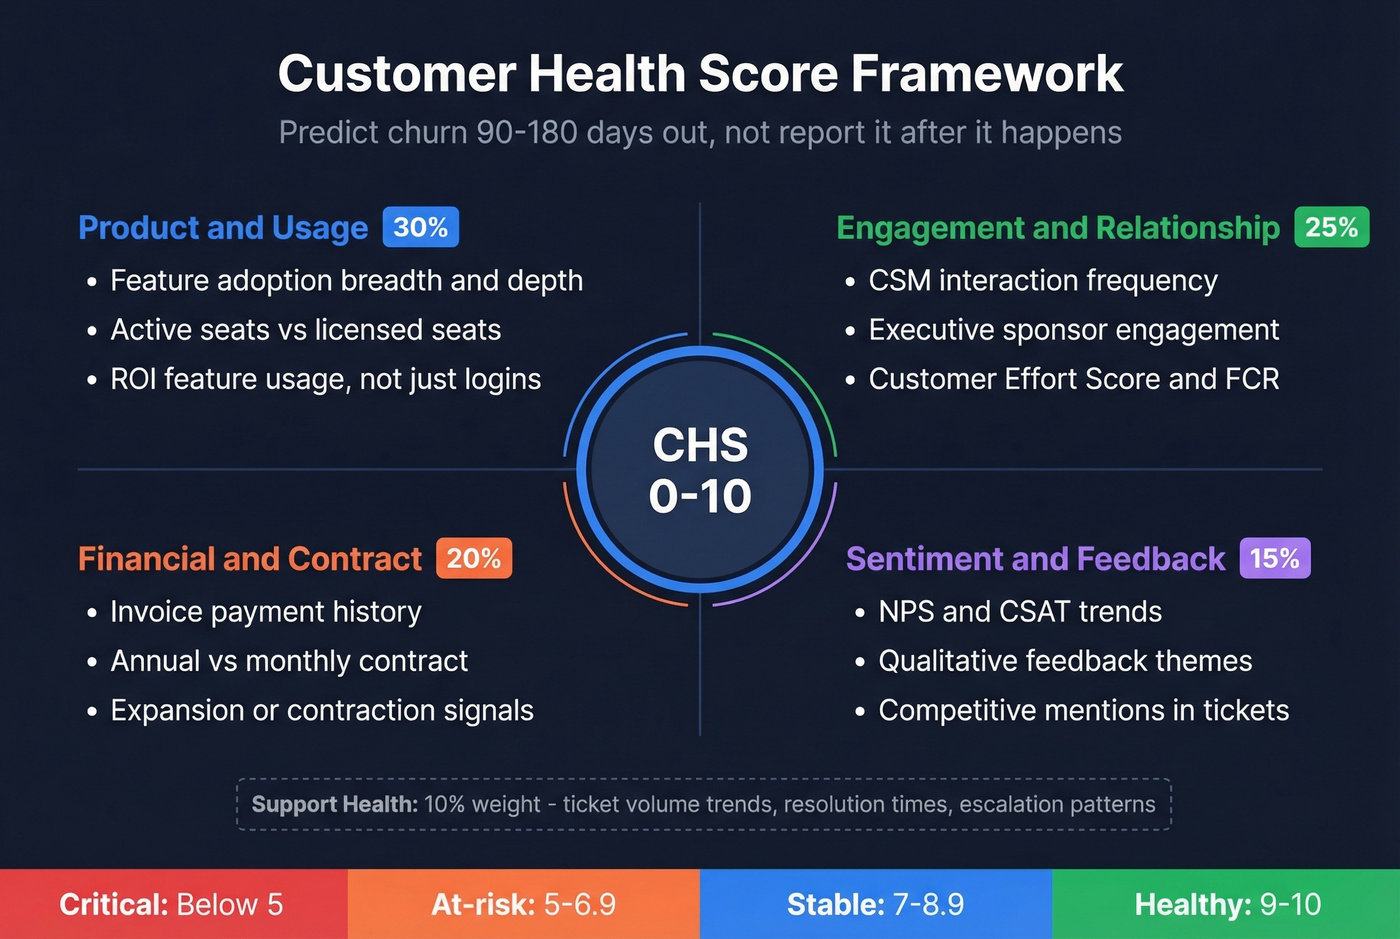
- Product/usage - Feature adoption breadth and depth, not just logins. Are they using the features that correlate with retention? How many seats are active vs. licensed?
- Engagement/relationship - CSM interaction frequency, support ticket trends, executive sponsor engagement. Customer Effort Score and First Contact Resolution rate belong here too - they're the leading indicators most teams ignore.
- Financial/contract - Invoice payment history, contract structure (annual vs. monthly), expansion or contraction signals.
- Sentiment/feedback - NPS and CSAT scores, qualitative feedback themes, competitive mentions in support tickets.
A Starter Formula
Don't buy a platform before you've validated the model in a spreadsheet. Start with a weighted composite:
CHS = (Usage x 0.30) + (Engagement x 0.25) + (Financial x 0.20) + (Sentiment x 0.15) + (Support x 0.10)
Score each category 0-10, then set threshold bands: 9-10 Healthy, 7-8.9 Stable, 5-6.9 At-risk, below 5 Critical. The weights are illustrative - calibrate them against your actual churn data. Teams with data science resources eventually graduate to ML models, but a spreadsheet gets you 80% of the value.
Mistakes That Kill Your Score
Watch out for lagging indicators masquerading as predictions. If your health score only drops after a customer cancels, it's a report, not a predictor. Vanity metrics like total logins and total documents created tell you nothing; depth of ROI-feature usage and org-wide adoption tell you everything. And never use one-size-fits-all scoring - an enterprise account and an SMB account have completely different healthy usage patterns.
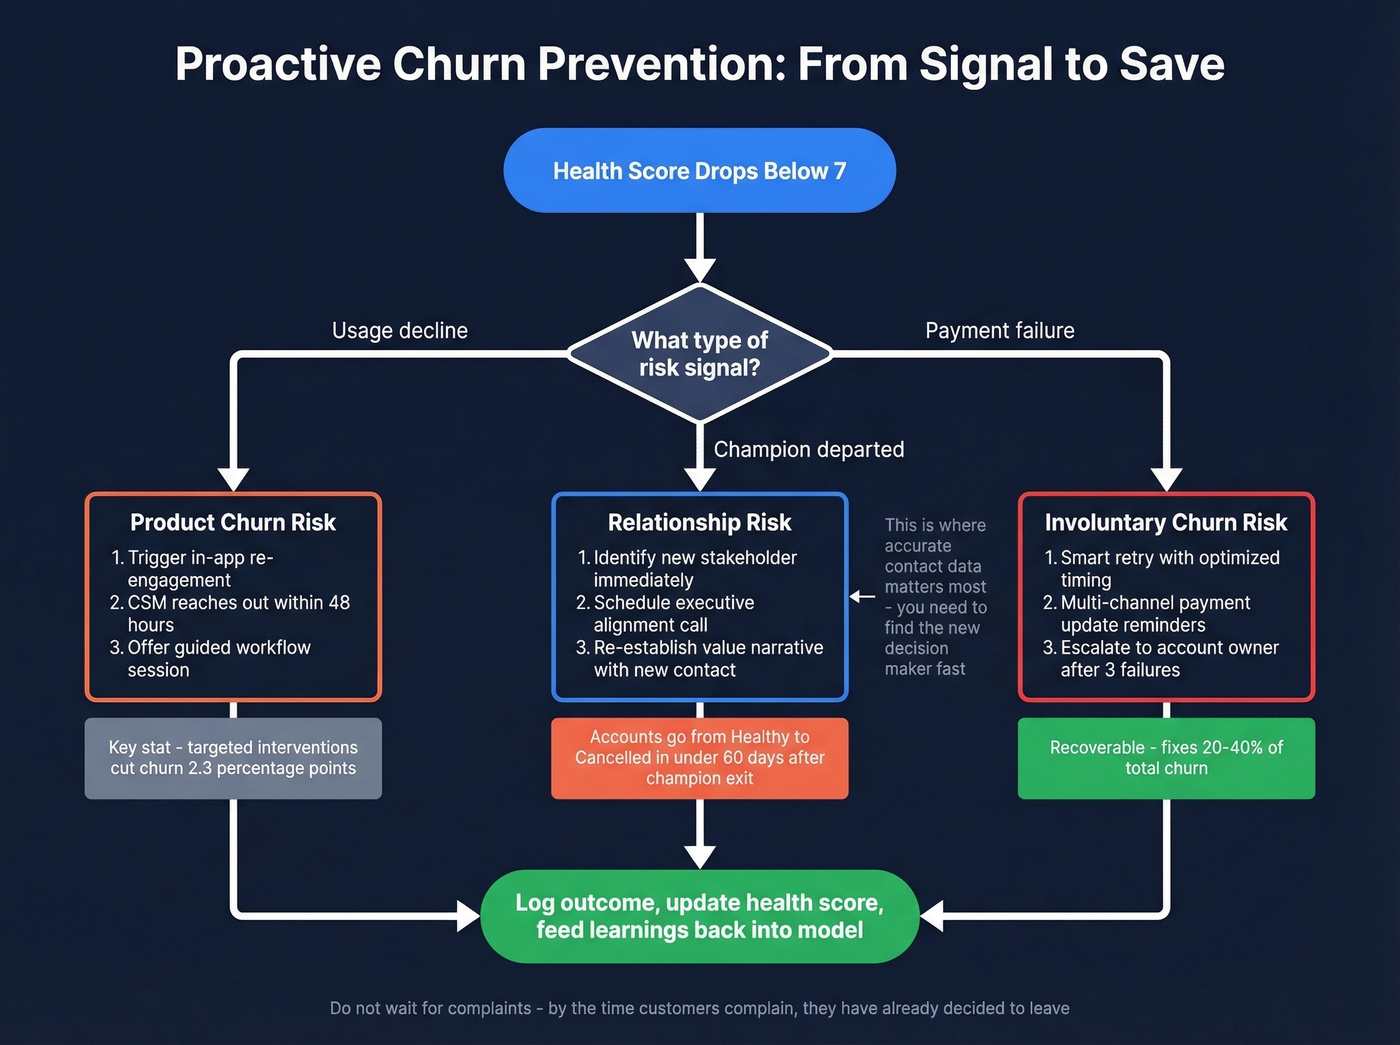
The signal that experienced CSMs catch but quantitative models miss: champion departure. When your internal advocate leaves the company, the clock starts ticking. We've seen accounts go from "Healthy" to "Cancelled" in under 60 days after a champion exit, with zero change in product usage metrics during that window. Competitive tool mentions in support tickets and declining executive engagement are the other qualitative signals that deserve manual tracking until your model can capture them.
Fix the First 90 Days
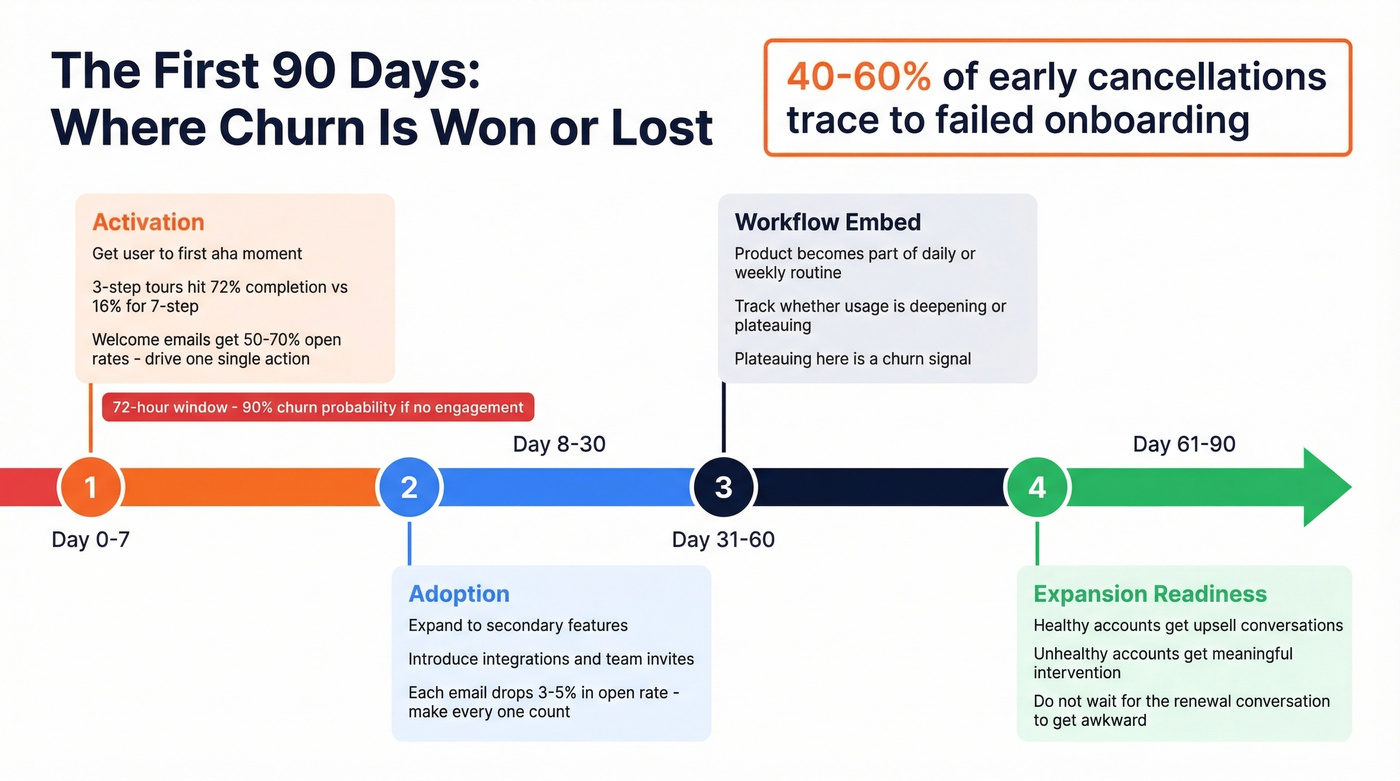
Onboarding is where churn is won or lost. 40-60% of early SaaS cancellations trace to failed onboarding, and 75% of new users abandon within the first week if they don't reach value quickly. Users who don't engage within 72 hours carry a 90% churn probability.
That's your window.
Day 0-7: Activation. Get the user to their first "aha" moment. Strip your onboarding to the minimum viable workflow - 3-step tours hit 72% completion while 7-step tours crater to 16%. Welcome emails in this window hit 50-70% open rates, so use them to drive a single action, not dump a feature list.
Day 8-30: Adoption. Expand from the core workflow to secondary features. Introduce integrations, team invites, and workflow customization. Each subsequent email drops 3-5% in open rate, so make every touchpoint count.
Day 31-60: Workflow embed. The goal is making your product part of their daily or weekly routine. Track whether usage is deepening or plateauing. Plateauing here is a churn signal.
Day 61-90: Expansion readiness. Healthy accounts get upsell conversations. Unhealthy ones get a meaningful intervention before the renewal conversation gets awkward.
Proactive Churn Prevention Tactics
Build proactive engagement triggers based on your health score. Don't wait for a customer to complain - by the time they do, they've already decided to leave. The consensus on r/SaaS is that short, well-timed cancellation surveys are "gold" for understanding why customers leave. Use that data to fix root causes, not just save individual accounts.
Tighten your ICP. The cheapest churn to prevent is the churn you never acquire. If you're closing customers who don't fit your product, you're buying churn. Every account that churns in the first 90 days is an acquisition failure, not a retention failure.
Design a cancellation flow with save offers - but target them. A 12-week controlled study using uplift modeling reduced voluntary churn by 2.3 percentage points, cut average discount depth by 14%, and increased incremental renewals per 1,000 contacts by 22%. The key insight: predicting who's at risk isn't the same as predicting who'll respond to an intervention. Blanket save offers waste money. Targeted ones work.
Call your churned customers. Not to win them back (though sometimes you will), but to learn. Treat the cancellation call as an end-of-journey research conversation. The patterns you surface across 20-30 of these calls will tell you more about your retention gaps than any dashboard.
Skip reactive "we're sorry to see you go" emails after a cancellation request - the intervention window closed weeks ago. Skip offering discounts to everyone who hits the cancel button, too. You'll train customers to threaten cancellation for a discount. And skip elaborate loyalty programs before fixing your onboarding. Loyalty rewards don't compensate for a product that never delivered value.
The Churn You're Not Tracking
Involuntary churn accounts for 20-40% of total subscription churn, and most teams barely track it. Up to 12% of card-on-file transactions fail, and a single payment hiccup can drive 35% of users to cancel outright. This is revenue walking out the door because of expired credit cards and network timeouts - not because anyone decided to leave.
The failure-reason breakdown matters because each bucket needs a different recovery strategy. Insufficient funds make up roughly 40-60% of failures. Expired cards and card-related issues account for 10-25%. Everything else - network timeouts, bank security blocks, incorrect billing details - fills the remainder.
The numbers on fixing this are compelling. GoCardless data shows credit card failure rates of 7.9% vs. account-to-account payment failure rates of 2.9%. Stripe Smart Retries deliver a $9 return for every $1 invested. Fixing payment failures alone can boost revenue by 8.6% in the first year.
The frustrating part? Most billing platforms have smart retry logic built in. Teams just never turn it on, or they're running static retry schedules from 2019. If you haven't audited your dunning flow in the last 12 months, do it this week.
Clean Data - The Silent Churn Lever
Your CS team identifies 500 at-risk accounts. They build a save campaign - personalized emails, QBR invitations, renewal incentives. They hit send. 180 emails bounce. Another 90 land in the inbox of someone who left the company six months ago. Your "save campaign" just reached 46% of its intended audience.
Bad contact data is the silent killer of every churn prevention tactic in this article. Your health scores, onboarding sequences, and proactive outreach all depend on reaching an actual human at the account.
We've seen this play out firsthand. Prospeo's 7-day data refresh cycle and 98% email accuracy keep CRM records current instead of decaying, and the enrichment engine matches 83% of leads with verified contact data - returning 50+ data points per contact. Native integrations with Salesforce and HubSpot mean enrichment runs automatically, no manual CSV uploads or quarterly "data cleanup" projects.
One proof point that stuck with our team: Snyk's 50-person sales org was running bounce rates of 35-40% before switching. After enrichment, bounces dropped under 5%, and AE-sourced pipeline jumped 180%. That's the difference between outreach that works and outreach that evaporates.

Structural churn starts with a broken ICP. Prospeo's 30+ filters - buyer intent, technographics, headcount growth, funding - let you target accounts that actually fit your product. Data refreshed every 7 days, not 6 weeks, so your health scores reflect reality.
Fix churn at the source: build pipeline with the right accounts from day one.
FAQ
What's a good churn rate for B2B SaaS?
Median annual customer churn is 16.25% for private B2B SaaS startups, based on Lighter Capital's benchmark of 155 companies. Enterprise products typically see 3-5% annual churn; SMB-focused products run 31-58%. Above 27.25% signals a structural issue, not a retention tactics problem.
How do you calculate churn rate?
Logo churn = customers lost / customers at start of period. Revenue churn = (lost MRR - expansion MRR) / starting MRR. Track both separately, segmented by plan size and customer type. Never mix new sales into the denominator.
What's the difference between voluntary and involuntary churn?
Voluntary churn is a customer decision - they cancel due to poor fit, bad experience, or a competitor win. Involuntary churn is a billing failure: expired cards, insufficient funds, network errors. Involuntary churn accounts for 20-40% of total subscription churn and requires completely different tactics - dunning sequences and smart retries, not save offers.
How do you build a customer health score?
Combine four metric categories - product usage, engagement, financial signals, and sentiment - into a weighted 0-10 score. Set thresholds: 9-10 Healthy, 5-6.9 At-risk, below 5 Critical. Segment by customer size and lifecycle stage. Start with a spreadsheet before buying a platform.
Can bad contact data cause churn?
Yes - save campaigns, QBR invitations, and renewal outreach fail silently when emails bounce or reach departed contacts. Keeping CRM data current with verified emails and a fast refresh cycle ensures retention outreach actually lands. Snyk cut bounce rates from 35-40% to under 5% after enrichment, which translated directly into more pipeline and more saved accounts.