Pipeline Bottlenecks: How to Find and Fix Them in 2026
Your VP of Sales just asked why pipeline is up 30% but revenue is flat. Every rep says deals are moving forward. The Monday pipeline review looks clean. But somewhere between "interested" and "closed-won," pipeline bottlenecks are quietly killing revenue - and nobody can point to exactly where.
Quick version: At any given time, one constraint limits your pipeline throughput. Calculate pipeline velocity (formula below), check time-in-stage for each deal phase, and look for the stage where conversion drops or deals age out. The fix is almost never "add more leads" - it's removing friction at the constraint.
Your Pipeline Looks Healthy. Revenue Says Otherwise.
More opportunities created, but decisions drag on. Buyers engage, take meetings, ask for proposals - then pause. The pipeline swells with "active" deals that aren't actually moving. Coverage ratios look great on paper, while silent constraints choke revenue behind the scenes.
Here's the core problem: nearly half of platform teams don't measure pipeline success at all, and a quarter collect data but never analyze it. Call it dashboard blindness - teams confuse visible metrics with real constraints. Traditional pipeline reviews track activity, managers see stages populated, and everyone stays busy. But a fat pipeline isn't a healthy one.
What Is a Pipeline Bottleneck?
A pipeline bottleneck is any point where deals slow down, pile up, or die at a disproportionate rate. Usually it's a specific stage where conversion craters or cycle time balloons. The same principle applies in data engineering and CI/CD pipelines: wherever work queues up, that's your constraint.
40-60% of deals are lost because the customer fails to make any decision at all. Your biggest competitor isn't a competitor. It's "no decision." Bottlenecks create the conditions for indecision to win.
The One Framework That Works
Stop trying to optimize the whole pipeline at once. Fix the one thing that's actually limiting throughput.
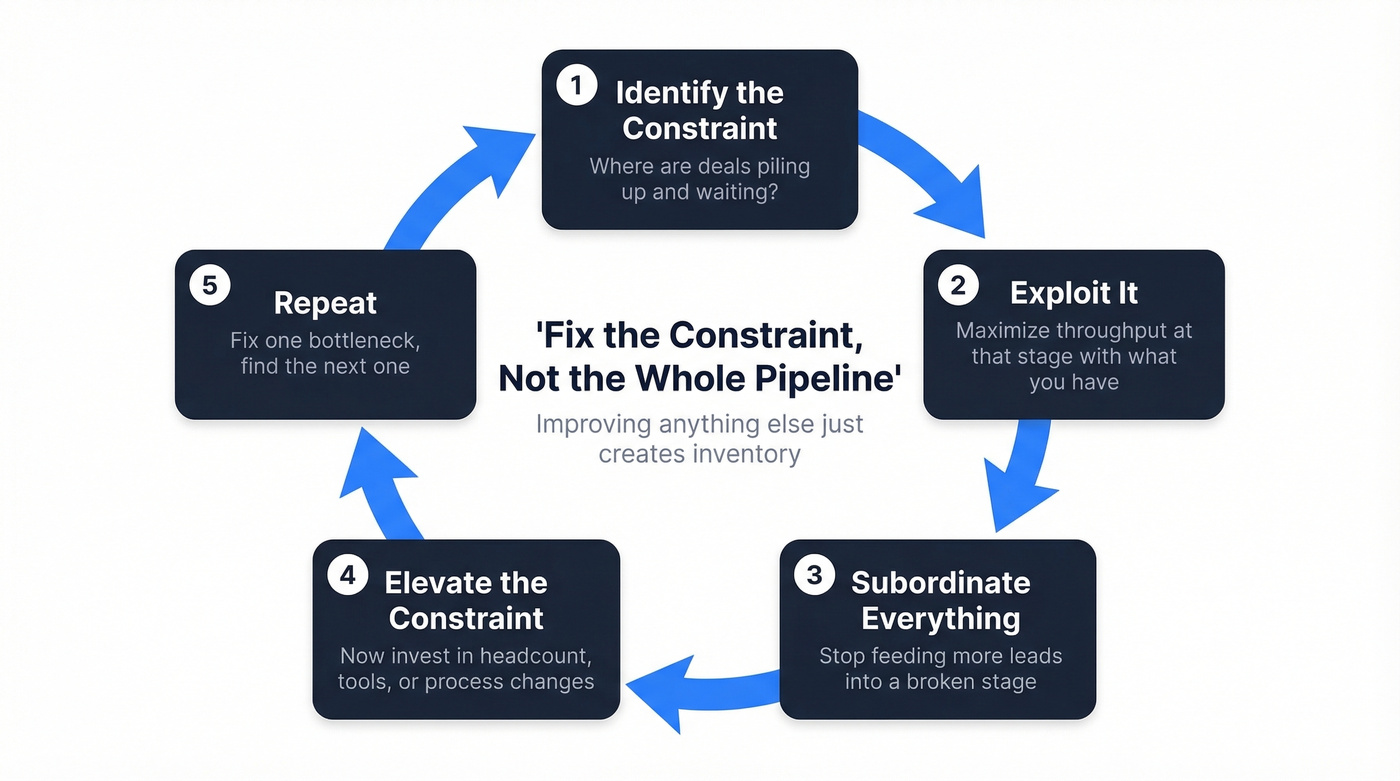
Goldratt's Theory of Constraints gives you a repeatable system. The core premise: at any given time, one primary constraint limits throughput. Improving anything else just creates inventory - deals piling up before the choke point. We've seen teams pour money into top-of-funnel lead gen while their qualification stage leaks like a sieve, and it's one of the most expensive mistakes in B2B sales.
- Identify the constraint. Where are deals waiting?
- Exploit it. Maximize throughput at that stage with existing resources.
- Subordinate everything else. Feeding more leads into a broken qualification stage just makes things worse.
- Elevate the constraint. Now invest - headcount, tooling, or process changes.
- Repeat. Once you fix one bottleneck, a new one emerges.
You just read that fixing the constraint matters more than adding leads. But what if the constraint is data quality? Prospeo's 5-step verification and 7-day refresh cycle eliminate phantom pipeline before it starts - 98% email accuracy, 30% mobile pickup rate, at $0.01 per email.
Stop feeding bad data into a pipeline you're trying to unclog.
Where Bottlenecks Hide by Stage
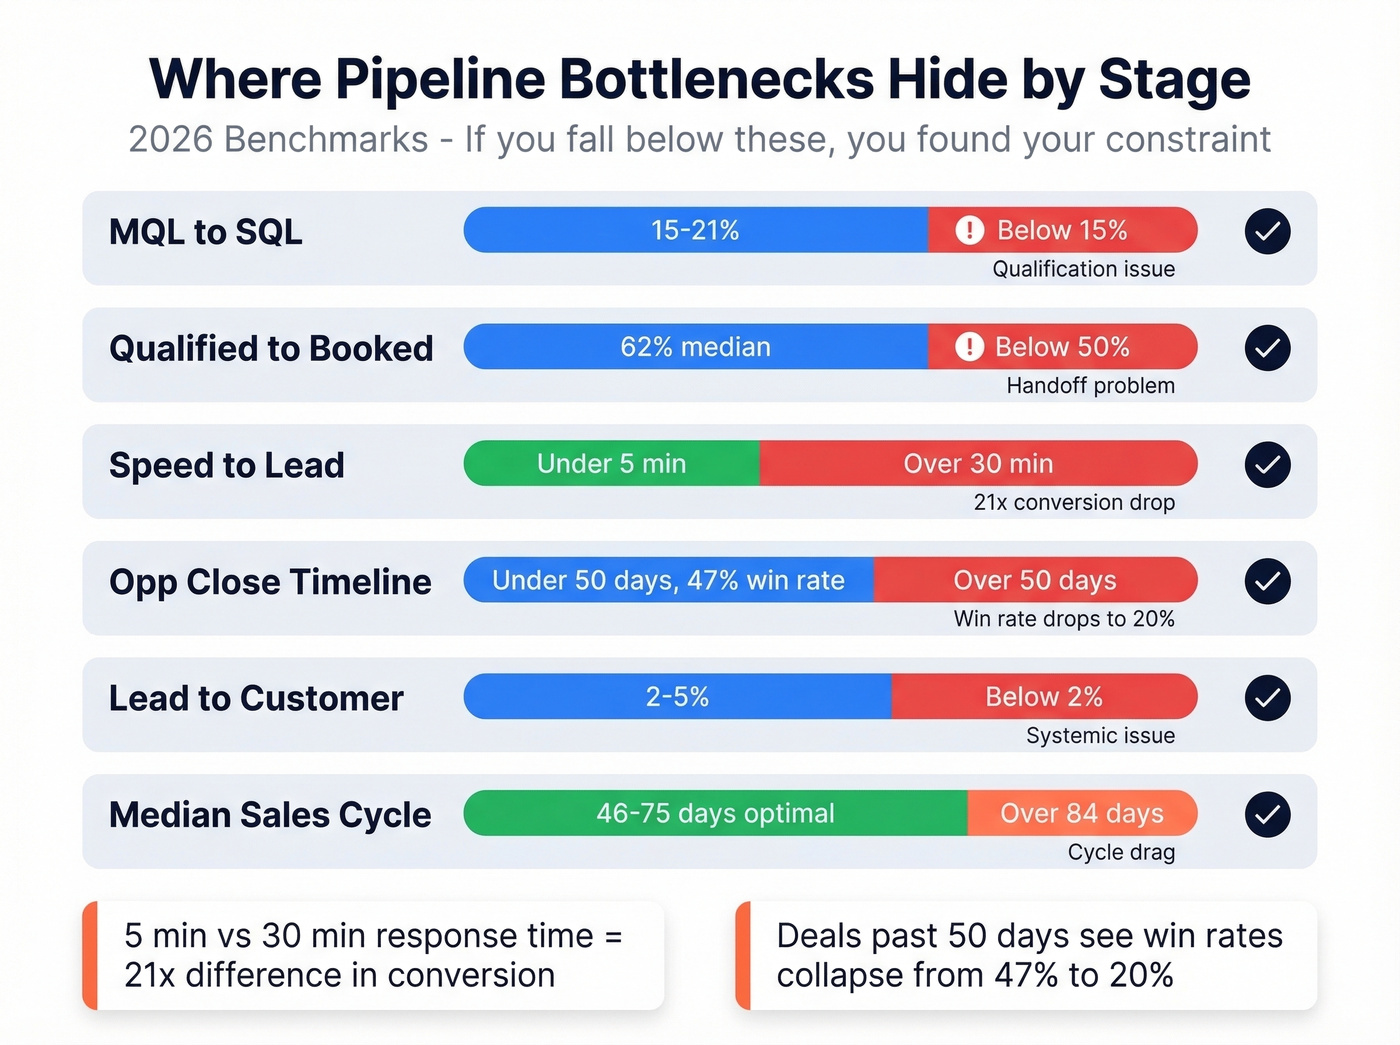
The table below shows stage-by-stage benchmarks from a 2026 benchmark compilation. If your numbers fall below these thresholds, you've found your constraint.
| Stage / Metric | Benchmark | Bottleneck Signal |
|---|---|---|
| MQL to SQL | 15-21% | Below 15% = qualification issue |
| Qualified to Booked | 62% median | Below 50% = handoff problem |
| Speed-to-lead | Under 5 minutes | Over 30 min = 21x conversion drop |
| Opp close under 50 days | 47% win rate | Over 50 days = win rate drops to 20% or lower |
| Lead to Customer | 2-5% | Below 2% = systemic issue |
| Median sales cycle | 84 days | Optimal: 46-75 days |
Two numbers jump out. Leads contacted within five minutes convert at 21x the rate of those contacted after 30 minutes - that's not a minor inefficiency, it's a structural constraint. And opportunities stretching past 50 days see win rates collapse from 47% to 20% or lower. Every day past that mark compounds the probability of a loss.
Pipeline Velocity Exposes Everything
Most pipeline bottlenecks stay invisible because teams track activity instead of velocity. Pipeline velocity is the only metric that combines volume, value, win rate, and speed into a single signal:
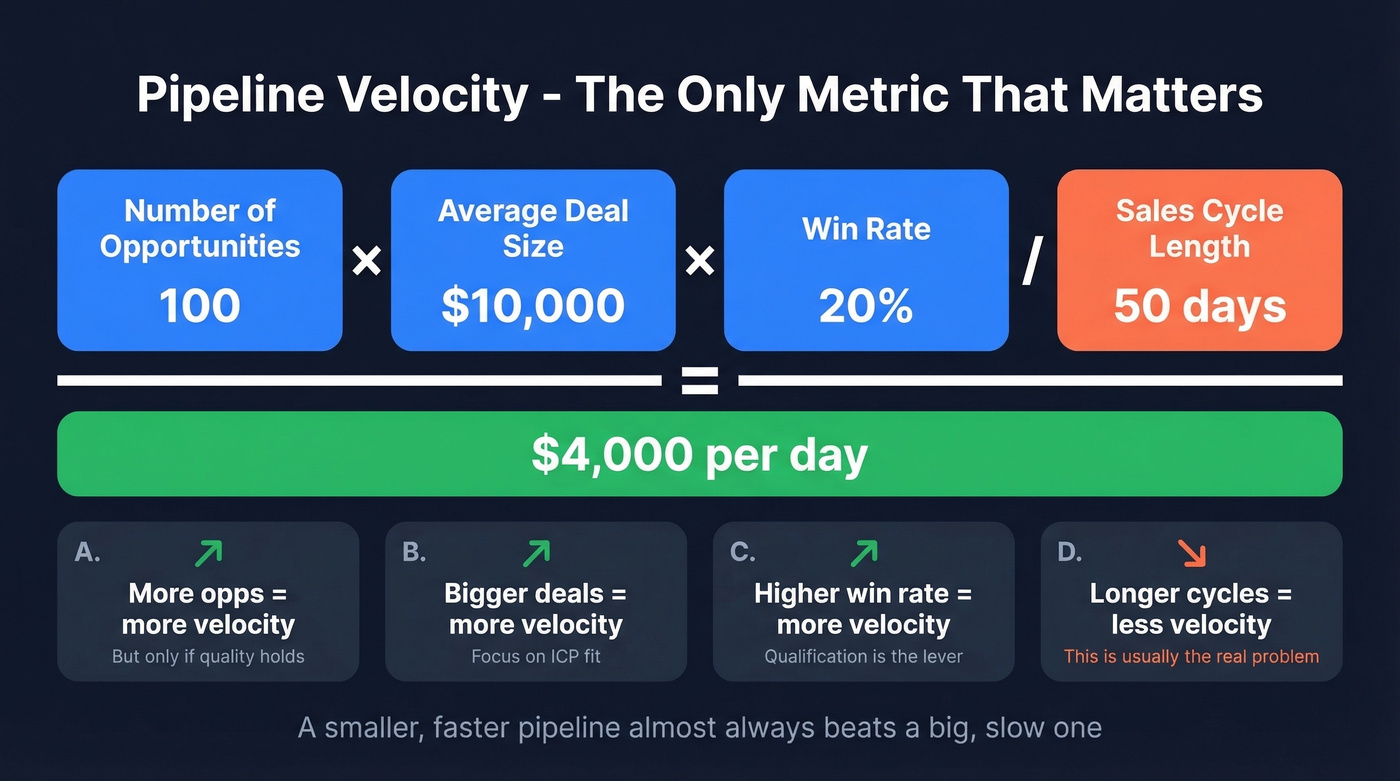
(Number of Opportunities x Average Deal Size x Win Rate) / Sales Cycle Length
Example: 100 opportunities x $10,000 x 20% win rate / 50 days = $4,000/day.
Track this monthly. When velocity drops, decompose it to find which lever moved. In our experience, most teams obsess over opportunity count when the real problem is cycle length - a smaller, faster pipeline almost always beats a big, slow one.
How to Diagnose Stalled Deals
You don't have a pipeline problem. You have a systems problem. The consensus on r/B2BSaaS is that most B2B companies don't need more effort - they need better system design. Sales funnel bottleneck identification starts with three data points: time-in-stage, stage-over-stage conversion, and deal age relative to your median cycle.
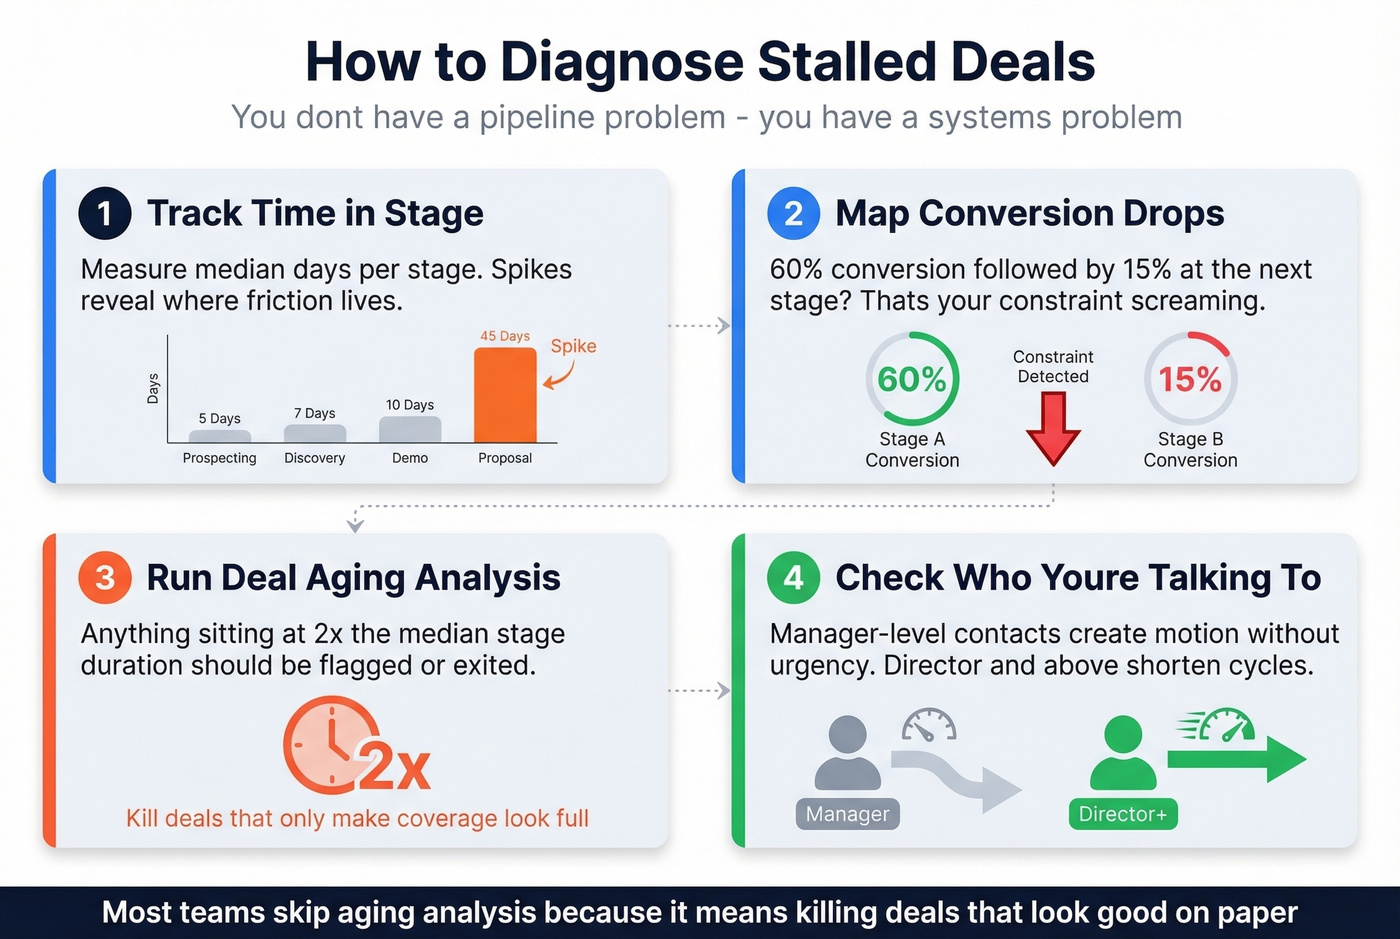
- Track time-in-stage. Median days per stage. Spikes reveal where friction lives.
- Map conversion drops. A 60% conversion at one stage followed by 15% at the next is your constraint screaming at you.
- Run deal aging analysis. Anything sitting 2x the median stage duration should be flagged or exited.
- Check who you're talking to. An analysis of 18,000+ sales conversations found that engagement with managers creates motion without urgency. When director-level and above engage, cycles get materially shorter. Single-threaded into mid-level contacts? That's a hidden bottleneck.
Let's be honest: most teams skip the aging analysis because it means killing deals that make the pipeline look full. But vanity coverage ratios don't close revenue. Ruthless pipeline hygiene does.
The Bottleneck Nobody Talks About
Here's a contrarian take: stop optimizing your pipeline. Start subtracting from it.
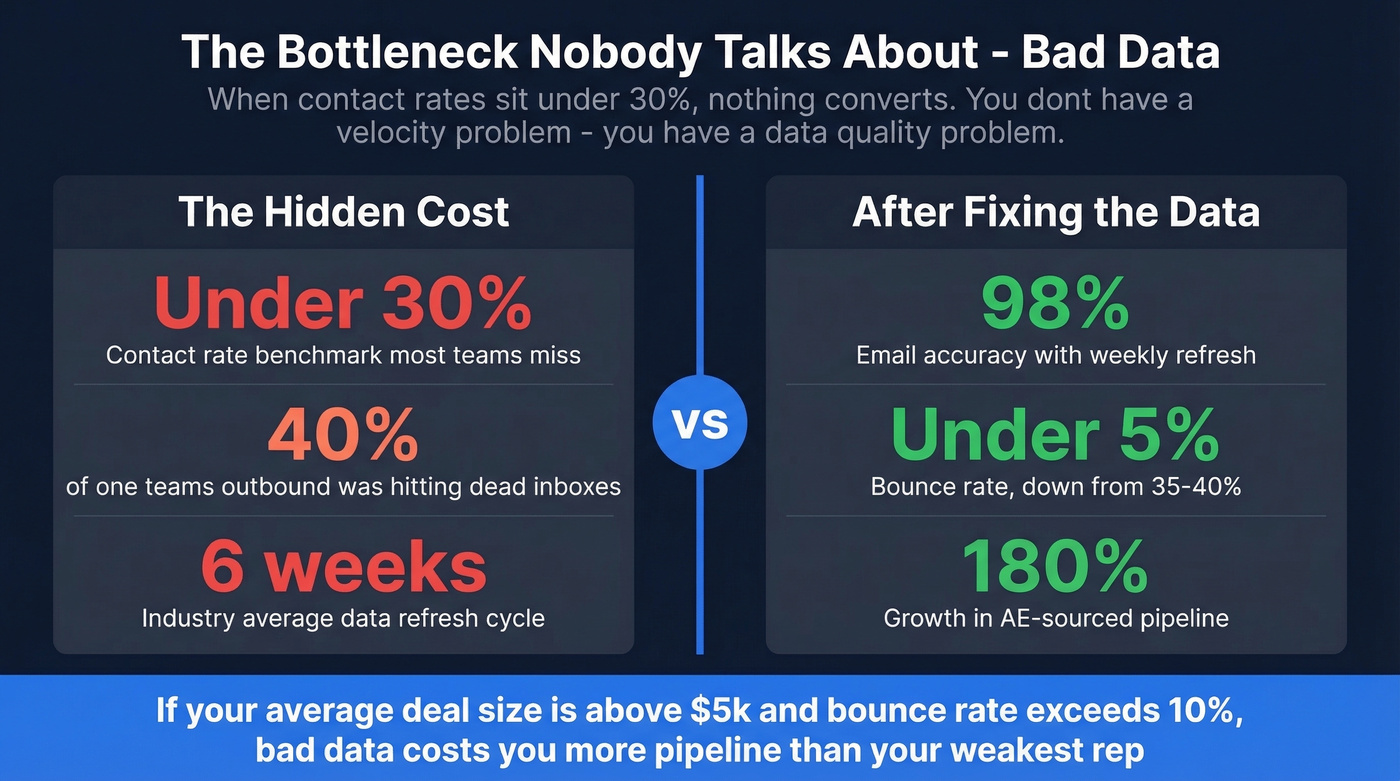
Reps chasing bounced emails and disconnected numbers creates phantom activity. Pipeline looks busy, but when contact rates sit under the 30% benchmark, nothing converts. You don't have a velocity problem - you have a data quality problem masquerading as one. We watched one team spend an entire quarter "fixing" their demo-to-proposal conversion rate before realizing 40% of their outbound was hitting dead inboxes.

This is where data verification earns its keep. Prospeo catches bad contacts before they enter your CRM - 98% email accuracy on a 7-day data refresh cycle versus the 6-week industry average. Snyk saw this firsthand: bounce rate dropped from 35-40% to under 5%, and AE-sourced pipeline jumped 180%. That's the difference between a pipeline that converts and one that just looks full.
If your average deal size is above $5k and your bounce rate exceeds 10%, bad data is costing you more pipeline than your weakest rep. Fix the data first.
Snyk dropped bounce rates from 35-40% to under 5% and grew AE-sourced pipeline 180% - by fixing the data bottleneck nobody was measuring. Prospeo's 143M+ verified emails on a weekly refresh cycle mean your reps contact real buyers, not dead inboxes.
Kill the bottleneck hiding inside your contact data.
FAQ
What's the most common sales pipeline bottleneck?
The MQL-to-SQL handoff, where conversion typically drops to 15-21%. Leads stall before qualification due to poor scoring, slow follow-up, or misaligned ICP criteria between marketing and sales. Audit speed-to-lead and scoring thresholds first.
How do you calculate pipeline velocity?
Pipeline velocity = (Opportunities x Average Deal Size x Win Rate) / Sales Cycle Length. Track it monthly to spot slowdowns before they hit revenue. Decompose each variable when the number dips - that tells you which lever broke.
Can bad contact data cause pipeline bottlenecks?
Yes. Reps chasing invalid contacts creates phantom activity - pipeline looks busy but nothing converts. Verified contact data eliminates dead contacts at the source, while providers running 4-6 week refresh cycles let stale records pile up and quietly erode your conversion rates.