The QBR Template Executives Actually Read
It's Thursday afternoon. Your customer QBR is Monday. You don't have a template, the last CSM left zero notes, and half the CRM data hasn't been touched since last quarter. Every QBR template you find online is either a signup gate or generic advice that doesn't distinguish between a customer review and an internal one. Meanwhile, 72% of senior executives already think QBRs are a waste of time - and decks built in a panic are exactly why.
This is the guide that should've existed when you needed it. Customer QBRs, internal QBRs, KPI lists by department, and a delivery framework that keeps the room awake.
What You Need (Quick Version)
If you run customer QBRs, use the 9-section framework below. If you run internal QBRs, use the 4-phase structure. Not sure which you need? You need both - they're fundamentally different meetings with different audiences, different agendas, and different outcomes.
Why Quarterly Reviews Still Matter
The stat everyone cites is the 72% number - most executives think QBRs waste time. But that's a problem with execution, not the format. Companies that hold regular customer reviews see 60-70% higher retention than those that don't. B2B customers with strong executive participation are 2.5x more likely to renew. And 87% of business buyers want reps to act as trusted advisors - a well-run QBR is where that trust gets built.
Gartner ranks executive QBRs among the top three practices B2B vendors use to retain enterprise accounts. The meeting itself isn't broken. The prep is. A quarterly business review with the right structure turns a status update into a strategic conversation, and that's where renewals, expansions, and real cross-team alignment actually happen. Some top-performing CS teams even charge for QBRs - positioning them as a deliverable, not a courtesy.
Mistakes That Make Execs Tune Out
Most QBR problems are upstream of the meeting itself. The pattern is always the same: these six failures, repeated quarter after quarter.
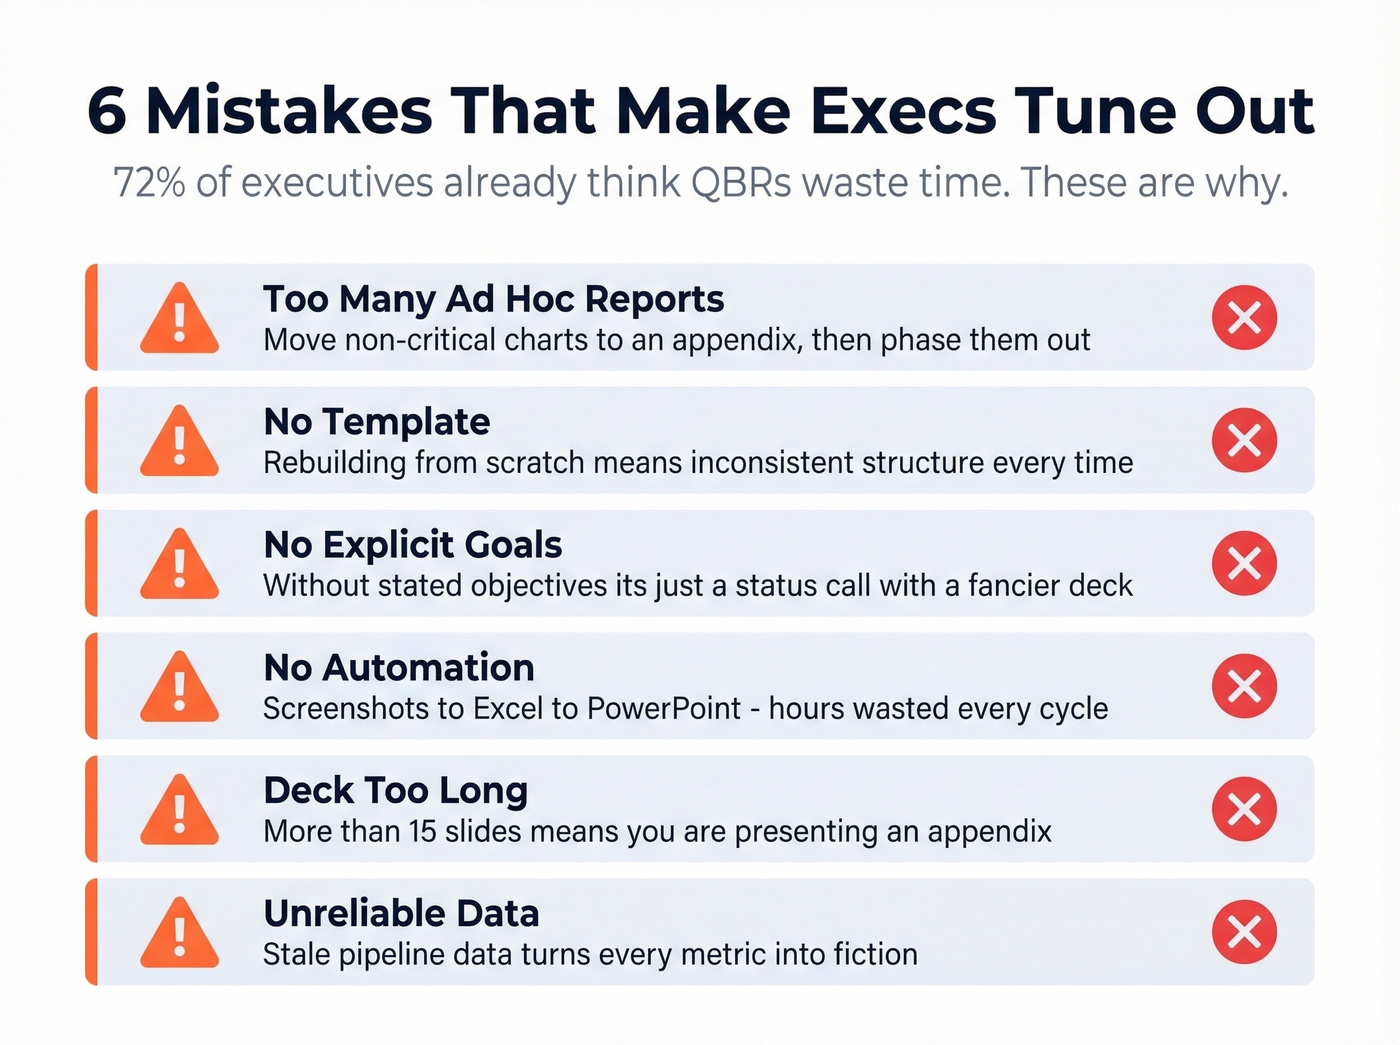
Too many ad hoc reports. Every stakeholder wants "just one more chart." The fix: move anything that isn't mission-critical into an appendix. Then phase out appendix items over time as people stop asking for them.
No template. Rebuilding from scratch every quarter means inconsistent structure, missed sections, and wasted hours. Pick a structure once, iterate quarterly.
No explicit goals. A QBR without stated objectives is a status call with a fancier deck. Define what success looks like for the meeting itself - are you confirming renewal readiness, surfacing expansion opportunities, or diagnosing churn risk? Without that anchor, every slide floats.
No automation. Screenshots pasted into Excel, reformatted into PowerPoint, then manually updated when the numbers change. Automate your reporting pipeline - tools like Rollstack or even a basic data-engineering workflow save hours per cycle.
Deck too long. If you're consistently above ~15 slides, you're presenting an appendix. Executives skim. Every slide needs to answer "so what?" - and if it can't, it goes to the back.
Unreliable data. Here's the thing: your QBR metrics are fiction if the pipeline data feeding them is stale. Half those "sent" emails bounced, and your reply rates are calculated against ghosts. Cleaning your contact data before the review - through a verification tool like Prospeo - fixes this at the source.

Internal QBR vs. Customer QBR
Confusing these two meetings is a major reason QBRs feel pointless.
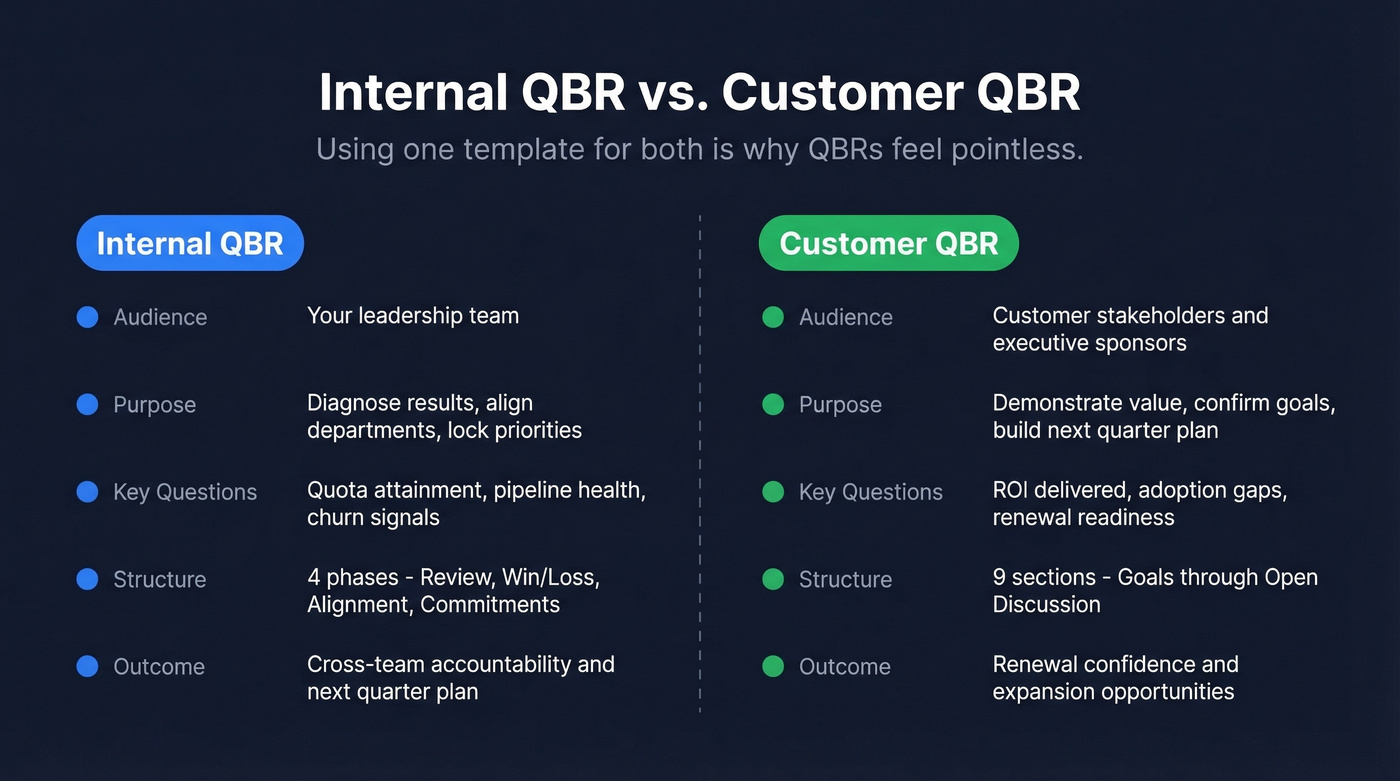
An internal QBR diagnoses what drove results, gets departments on the same page, and locks in priorities for next quarter. The audience is your leadership team. The questions are about quota attainment, pipeline health, churn signals, and whether repeated customer feedback is actually being acted on.
A customer QBR demonstrates value delivered, confirms goal alignment, and builds the next-quarter plan together. The audience is your customer's stakeholders - and getting an economic buyer or VP in the room is what makes it strategic instead of tactical. Without that executive sponsor, you're running a status call.
Using one template for both is a huge reason QBRs feel pointless. CSMs talk about this constantly on r/CustomerSuccess - the "how do I make QBRs not suck" threads almost always trace back to someone cramming internal metrics into a customer-facing deck, or vice versa. Let's break each one down.
Customer QBR Template: 9 Sections
This 9-section structure, adapted from Gong's QBR framework, covers everything a customer-facing review needs. Aim for 10-15 slides in the core deck - anything beyond that belongs in an appendix. Copy these nine sections into your slide tool of choice and you've got your template.
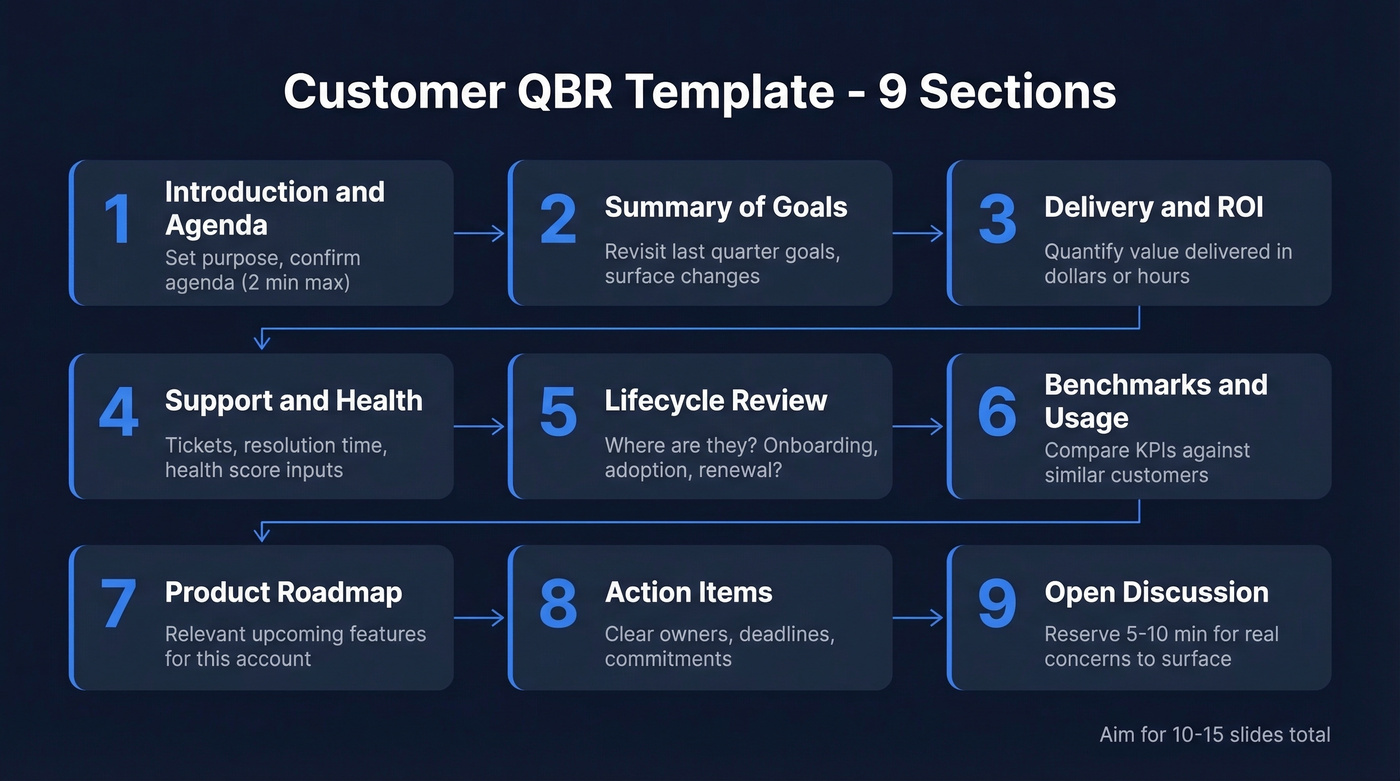
1. Introduction & Agenda
Two minutes max. State the meeting's purpose, confirm the agenda, and set expectations for what you'll cover and what you won't.
2. Summary of Goals
Revisit the goals set last quarter. Ask directly: have priorities changed? Are these goals still relevant? New business changes or emerging goals should surface here, not buried in slide 14.
3. Delivery & ROI
Show what you delivered against those goals. Quantify ROI wherever possible - dollars saved, hours recovered, revenue influenced. If you can't quantify it, you haven't done the work. Even directional estimates ("we reduced onboarding time by roughly 30%") beat vague claims about "improved efficiency."
4. Support Usage & Customer Health
These two sections work best presented together. Lead with the numbers - ticket volume, resolution times, open cases - then layer in the health score with the inputs that drive it: adoption, engagement, support sentiment, NPS.
A concrete example: "You submitted 2 tickets this quarter - resolved in 36 hours and 13 hours respectively, averaging 24.5 hours. Your health score is green, driven primarily by 94% feature adoption and an NPS of 72." Don't just show a green/yellow/red dot. Show why it's that color.
5. Lifecycle Review
Where is this customer in their journey? Onboarding complete? Fully adopted? Approaching renewal? This section frames the rest of the conversation and determines how much of the meeting should focus on expansion vs. stabilization.
6. Benchmarks, KPIs & Product Usage
Compare their usage and outcomes against similar customers. Benchmarking data is powerful because it shows whether they're getting full value or leaving features on the table. Structure this as a quick scorecard:
- Feature adoption: 78% (peer average: 65%)
- Monthly active users: 142 (peer average: 98)
- Support tickets/quarter: 2 (peer average: 7)
Numbers in context tell a story. Numbers alone don't.
7. Product Roadmap
Share what's coming that's relevant to their use case. Don't dump the entire roadmap - filter it to what matters for this account.
8. Action Items & Next Steps
Every QBR ends with clear owners, deadlines, and commitments. If you leave without documented next steps, the meeting didn't happen.
9. Open Discussion
Reserve 5-10 minutes for unstructured conversation. This is where the real concerns surface - the ones that don't fit neatly into any slide. Skip this section at your own risk.
Your QBR slides show pipeline health, reply rates, and outreach volume - but those numbers are fiction if half your contacts bounced. Prospeo's 98% email accuracy and 7-day data refresh mean the metrics you present in your next quarterly review actually reflect reality.
Stop presenting QBR metrics built on stale, unverified contact data.
Internal QBR Template: 4 Phases
Internal QBRs follow a tighter structure. The goal isn't to impress anyone - it's to diagnose, align, and commit. Many teams start with a general quarterly business review template and customize it per department, which is the right approach.
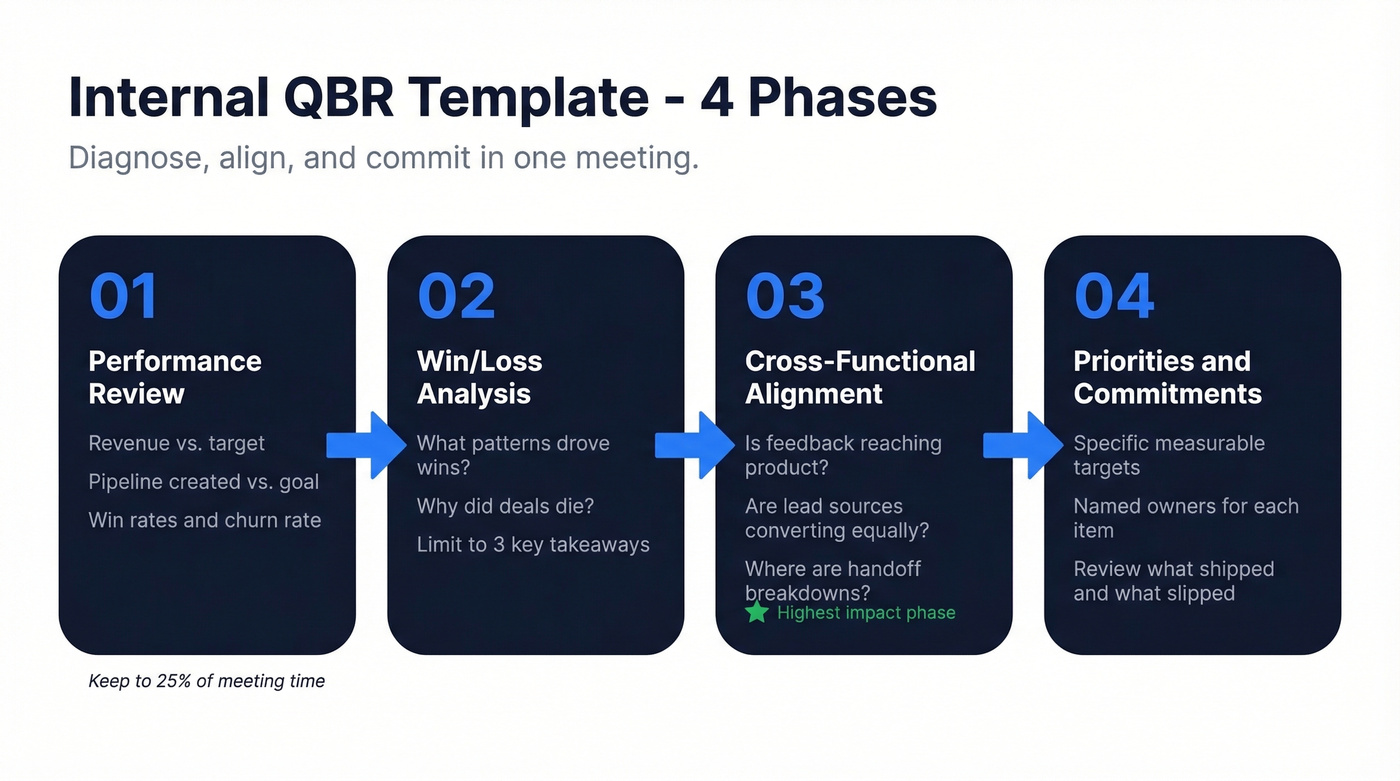
Phase 1: Performance Review
Revenue vs. target, pipeline created vs. goal, win rates, churn rate. Key operational metrics like cycle time, ramp time, and support load. Keep this factual and fast - the "what happened" phase shouldn't consume more than 25% of the meeting.
Phase 2: Win/Loss Analysis
Deals that closed: what patterns drove the wins? Deals that died: price, timing, product gaps, or competitive displacement? Surface 2-3 actionable insights, not a full deal-by-deal autopsy. We've found that teams who limit this section to three key takeaways actually act on them, while teams that review every lost deal end up acting on none.
Phase 3: Cross-Functional Alignment
Is repeated customer feedback reaching product? Are marketing-sourced leads converting at the same rate as outbound? Where are the handoff breakdowns between sales and CS?
This is where internal QBRs earn their keep. In our experience, this phase consistently surfaces the highest-impact fixes - the kind that don't show up in any single team's dashboard.
Phase 4: Priorities & Commitments
Not "improve pipeline" - instead, "increase outbound pipeline by 20% by adding two SDRs and launching the EMEA sequence." Each commitment gets an owner and a measurable target. Review last quarter's commitments first: what shipped, what slipped, and why.
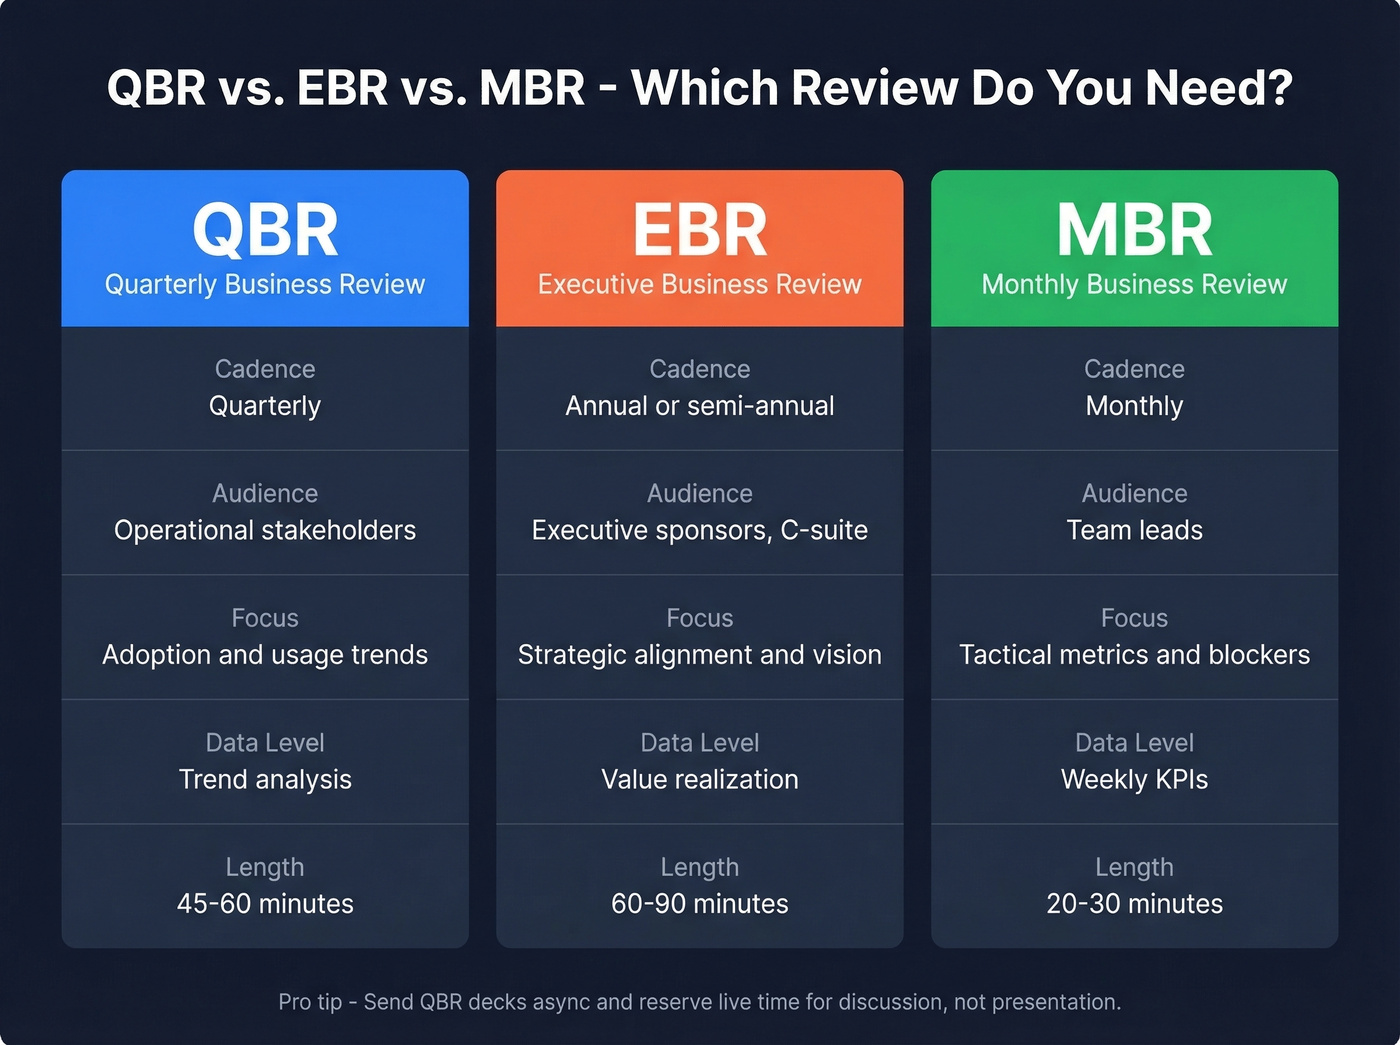
QBR vs. EBR vs. MBR
These three reviews serve different purposes:
| QBR | EBR | MBR | |
|---|---|---|---|
| Cadence | Quarterly | Annual/semi-annual | Monthly |
| Audience | Operational stakeholders | Executive sponsors | Team leads |
| Focus | Adoption & usage | Strategic alignment | Tactical metrics |
| Data level | Trend analysis | Value realization | Weekly KPIs |
| Length | 45-60 min | 60-90 min | 20-30 min |
Teams increasingly deliver QBRs asynchronously - automated decks or digital summaries sent ahead of time, with the live meeting reserved for discussion rather than presentation. If your QBR is mostly reading slides aloud, make this shift.
Pick the Right Format
Not every quarterly business review needs the same structure. Match the format to your audience.
Executive Summary Dashboard
Condense to 5-7 vital KPIs with visual cues - trend arrows, color coding, and brief annotations for variances. This format works when your audience is C-suite and you have less than 30 minutes. Every data point earns its spot or gets cut.
Functional Deep-Dive
Department-specific templates that explicitly call out interdependencies. Schedule pre-review meetings so each team arrives aligned. This works for internal QBRs where the "why" matters more than the "what."
OKR-Based Review
Used by companies like Google and Intel, this format centers on objectives paired with measurable key results. Each objective gets a score, and the conversation focuses on what moved the needle and what didn't. Best for organizations already running on OKRs - skip this if your team doesn't think in those terms, because forcing the framework creates more confusion than clarity.
Department KPIs for Your QBR
The right metrics depend on who's in the room. Here's a starter list by department, drawn from common sales KPI frameworks and standard SaaS benchmarks.
Sales: Dials/day, conversations/day, pipeline created vs. target, win rate, average deal size, sales cycle length. Before you report outbound activity metrics, verify your contact data is current - stale emails inflate send counts and deflate reply rates, making your pipeline look healthier than it is.
Customer Success: GRR/NRR, churn rate, customer health score, NPS, time-to-value.
Marketing: MQL-to-SQL conversion, CAC, pipeline sourced by marketing, conversion rates by channel.
Product: Activation rate, retention cohorts, feature adoption, time-to-first-value.
Finance: ARR, gross margin, burn multiple, revenue per employee.
Pick 5-7 metrics per department for your review deck. More than that and you're back to the data-dump problem.
Present Without Losing the Room
The template is 20% of the work. Delivery is the other 80%.
Hit the nine-minute mark. Deliver your executive summary in under nine minutes. We've watched rooms check out at the twelve-minute mark - front-load the insights that matter most.
Send pre-reads 48 hours early. Share the deck two days before the meeting. Attendees arrive with questions instead of spending the first 20 minutes catching up. This single habit transforms QBR quality more than any template change.
Visuals over text. A chart with a trend arrow communicates faster than a paragraph on a slide. If you're reading bullets aloud, you've already lost.
Timebox every topic. A 45-minute QBR with five sections gets nine minutes each - that's tight, and tight is good.
Define presenter roles. The CSM covers health and support, the account exec covers commercial, the product lead covers roadmap. Variety keeps energy up.
Filter for the audience. Nancy Duarte's principle applies perfectly: "audience over ambitions." Every slide should pass the test of "does this person care about this number?"
If you want a tighter agenda and better prompts, use these QBR questions to guide the discussion.
The best QBR template in the world can't fix bad data. If your CRM hasn't been enriched recently, your adoption rates, outreach stats, and pipeline numbers are misleading leadership. Prospeo enriches your CRM with 50+ data points per contact at a 92% match rate - so your next QBR tells the truth.
Build your next QBR on data that's 7 days fresh, not 6 weeks stale.
FAQ
How long should a QBR meeting be?
45-60 minutes live. Front-load the executive summary in the first nine minutes - that's when you have full attention. Anything beyond 60 minutes signals your deck needs editing, not more time.
How many slides should a QBR deck have?
10-15 slides for the core deck. Move supporting data and backup analysis into an appendix for async review. Every slide in the main deck should answer "so what?" - if it can't, cut it.
Who should attend a customer QBR?
Your CSM or account manager, the customer's day-to-day contact, and at least one executive sponsor from each side. Without an economic buyer in the room, the QBR stays tactical and decisions get deferred.
Can I use a quarterly business review template in Word?
Yes - a Word-based template works well for teams that prefer written narratives over slide decks. Export key metrics, add commentary per section, and share as a pre-read. Some CS teams find written formats force clearer thinking, though you'll still want a visual summary for the live meeting.
How do I fix bad data before a QBR?
Run your contact lists through a verification tool at least one week before the review. Stale records inflate your activity metrics and make pipeline numbers look healthier than they are. Clean data means your outbound KPIs reflect reality, not ghosts.