Qualitative Sales Forecasting: The Practitioner's Guide for 2026
It's Q4 planning and your company is launching a product line with zero sales history. You can't run a regression on data that doesn't exist. Your CFO still needs a number by Friday.
That's the moment qualitative sales forecasting stops being the "soft" option and becomes the only option - and most teams have no structured process for it. 63% of sales leaders say forecasting is extremely critical to their business, yet only 27% say it actually produces accurate results. Meanwhile, 4 in 5 sales and finance leaders missed a quarterly forecast in the past year, with over half missing it two or more times.
The problem with qualitative forecasting isn't that it's subjective. It's that most teams don't treat it as a discipline.
Decision Tree: Pick Your Method
Here's the quick version:
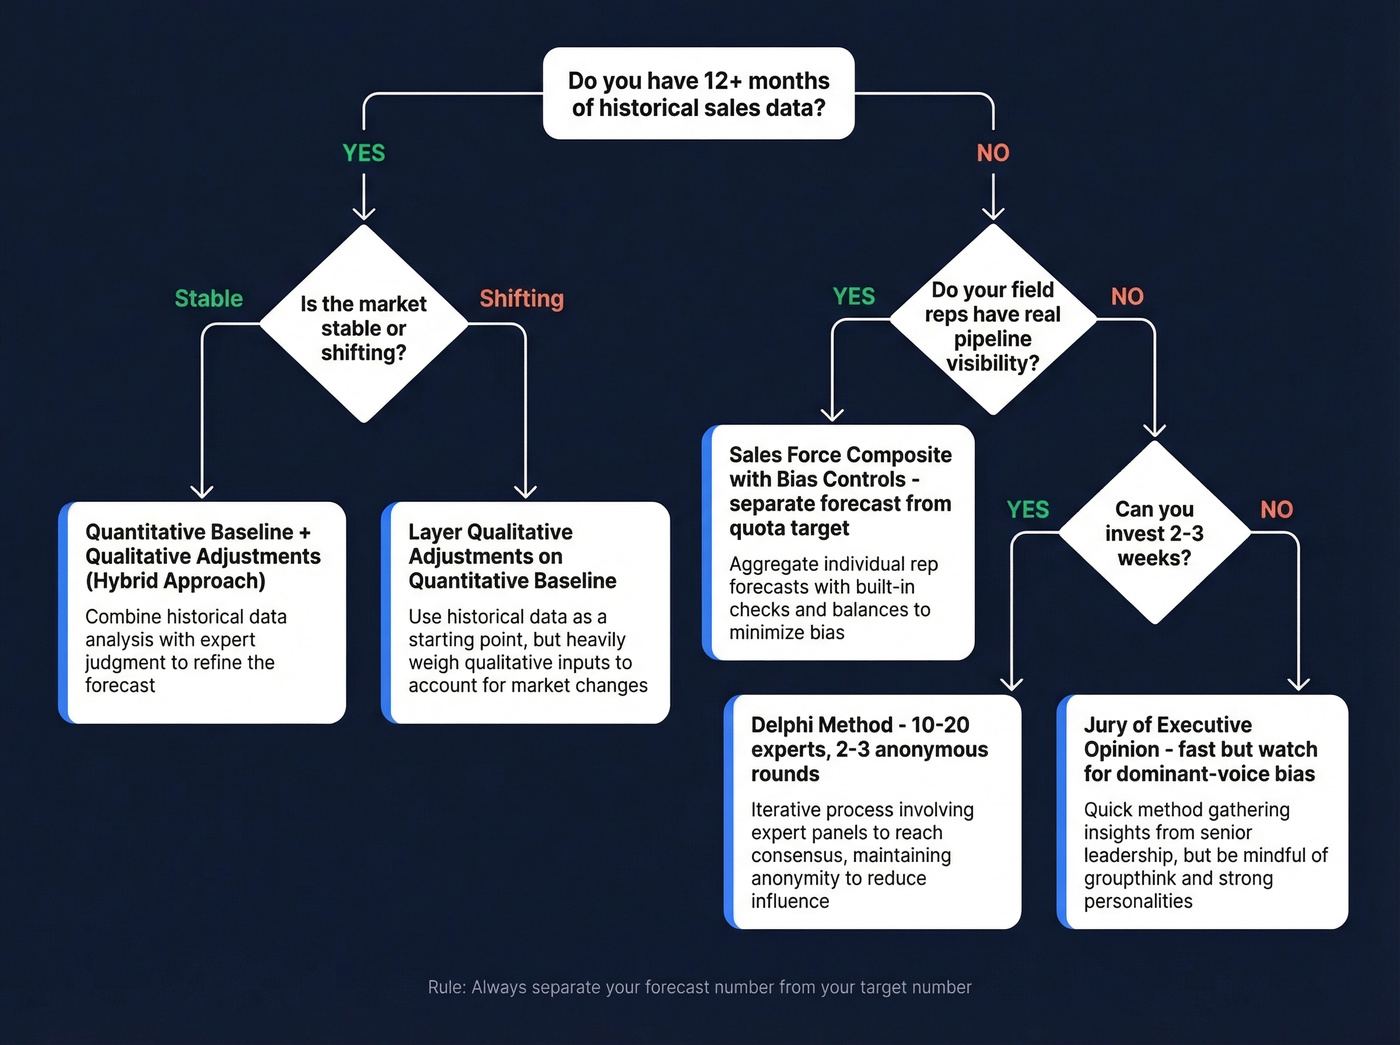
- No historical data (new product, new market, post-M&A): Run a Delphi forecast with 10-20 experts and 2-3 anonymous rounds.
- Field reps with pipeline knowledge: Use a structured sales force composite with explicit bias controls - separate the forecast from the quota target.
- Established product, shifting market: Layer qualitative adjustments on top of your quantitative baseline (hybrid approach).
Regardless of method, follow three rules. First, separate your forecast from your target - they're different numbers serving different purposes. Second, categorize every qualitative input using the 3-bucket framework: seasonality, your actions, external environment. Third, verify your pipeline data before trusting any estimate built on top of it.
The benchmark to aim for: top-performing organizations hit 1.3% forecast error. Median performers land at 1.8%. If you're above 2.4%, your process needs structural work.
What Is Qualitative Sales Forecasting?
Qualitative sales forecasting uses human judgment, expert opinion, and contextual intelligence - rather than historical data and statistical models - to predict future revenue. It's built on leading indicators: what your reps hear in deals, what your market analysts see shifting, what your executives sense about competitive dynamics.
The key distinction is leading vs. lagging. Quantitative methods look backward at what happened and project it forward. Qualitative methods look at what's happening now and what's likely to change. Neither is inherently better. But when you're entering a new market, launching a product with no sales history, navigating a major disruption, or dealing with a pricing overhaul, judgment-based forecasting is the right starting point because there's nothing meaningful to regress against.
Where teams go wrong is treating this as "just asking people what they think." Unstructured opinion-gathering produces garbage. Structured methods - with anonymity controls, bias formulas, and categorized inputs - are harder and more rigorous than plugging last year's numbers into a spreadsheet.
Qualitative vs. Quantitative Forecasting
| Dimension | Qualitative | Quantitative |
|---|---|---|
| Data needed | Expert judgment, market signals | 12+ months of historical data |
| Best for | New products, market shifts | Stable, repeatable pipelines |
| Bias risk | High (anchoring, dominance) | Low (but garbage-in risk) |
| Accuracy ceiling | +-10-15% with structured process | Higher with clean data |
| Speed to first forecast | Days | Weeks (needs data prep) |
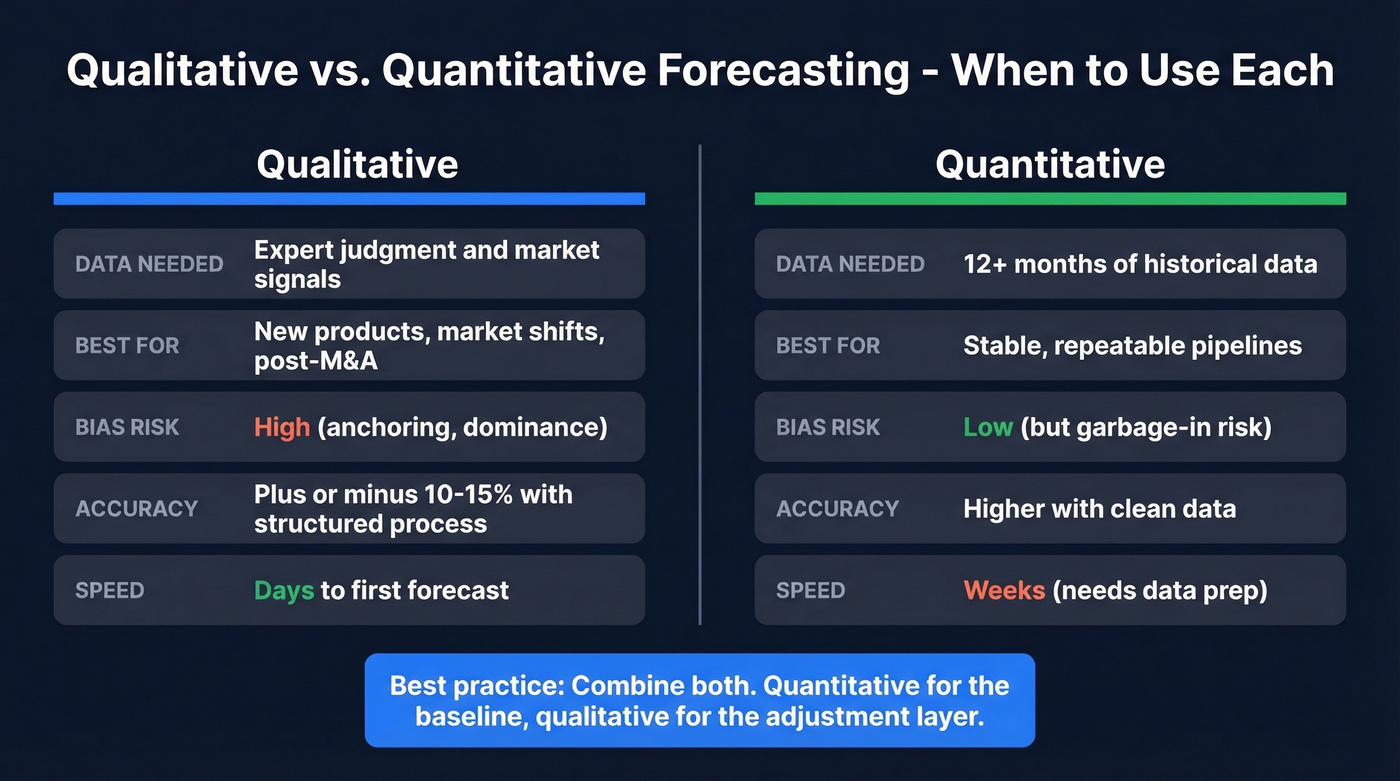
The real answer, backed by research, is that you shouldn't choose one over the other. An academic study testing multiple forecasting techniques across three years of sales data found that combining quantitative and qualitative methods produced more accurate forecasts than either approach alone. Quantitative gives you the baseline. Qualitative gives you the adjustment layer for everything the model can't see - deal-level context, competitive moves, buyer sentiment shifts.
The practical framing: use quantitative for data-rich, repeatable pipelines and expert judgment for new or shifting deals. The best forecasting orgs do both.
Five Methods for Sales Teams
Jury of Executive Opinion
This method pools estimates from senior leaders across functions - sales, marketing, finance, product - and synthesizes them into a single forecast. It's fast and cheap, which is why it's the default at most companies.
The core risk is dominant-voice bias: the loudest or most senior person in the room anchors everyone else's estimates. If your CRO says "I think we'll do $4M," nobody's going to say $2.5M to their face. Use this when you need a fast directional forecast and have experienced leadership with market knowledge. Skip it if your executive team has strong personality dynamics where one voice consistently wins the room.
Sales Force Composite
Each rep estimates their territory's expected sales, and management rolls them up. The method captures ground-level deal intelligence that no model can replicate. But it carries two well-documented biases: the recency effect causes reps to overweight their last few deals, and incentive-driven lowballing is the bigger problem.
Reps compensated on quota attainment have a financial incentive to sandbag their forecasts. This isn't cynicism - it's behavioral economics. We've watched teams where the same reps under-forecast by 12-18% every single quarter, like clockwork. Use this when your reps have genuine pipeline visibility and you can separate the forecast from their quota. Skip it if forecasts double as performance targets.
The Delphi Method
Developed by the RAND Corporation in the 1950s, the Delphi method uses multiple rounds of anonymous questionnaires with a moderator summarizing results between rounds until responses converge. Anonymity is the key mechanism - it eliminates the dominant-voice problem that plagues executive panels.
Here's the process:
- Select your panel. Pick 10-20 experts - a mix of reps, managers, product leaders, and external advisors. Appoint a moderator who won't participate in estimates.
- Design the questionnaire. Ask specific, quantifiable questions: "What's the probability we close 3+ enterprise deals in Q2?" "What revenue range do you expect from the EMEA expansion in H2?" "How will the competitor's price cut affect our mid-market win rate?"
- Summarize and repeat. The moderator aggregates responses anonymously - medians, ranges, outlier reasoning. Panelists revise their estimates. Run 2-3 rounds.
- Stop at convergence. When estimates stabilize within a tight range, you've got your forecast. Report the consensus range, not a false-precision single number.
This is the most rigorous qualitative method available. It's also the slowest - expect 2-3 weeks for a proper cycle. If you need a number by Friday, this isn't your tool.
Market Research and Surveys
Surveying potential customers, industry analysts, or channel partners provides short-to-medium-term demand signals. The accuracy depends entirely on survey design and sample quality - a poorly designed survey gives you confident wrong answers, which is worse than no answer at all. This method is expensive and slow, which is why most B2B sales teams skip it in favor of faster approaches. For a major market entry or product pivot, though, it's worth the investment.
Life-Cycle Analogy
Most forecasting guides skip this method entirely, which is a mistake. Life-cycle analogy uses the demand history of a similar product across its lifecycle stages - introduction, growth, maturity, decline - to forecast a new product's trajectory. If you launched a similar SaaS product three years ago and have its adoption curve, that's your best starting template for the new launch. It's particularly useful for long-range capacity planning and resource allocation where you need a shape for the curve, not just a single-quarter number.
Every qualitative forecast is built on pipeline data - and bad data is why 4 in 5 leaders miss their number. Prospeo's 7-day refresh cycle and 98% email accuracy mean the contacts in your CRM are real, current, and reachable before your reps ever estimate a close date.
Fix your pipeline data before you forecast on top of it.
The 3-Bucket Framework
A supply chain practitioner on Reddit articulated a framework that's more useful than most textbook models. Every qualitative input should fall into one of three buckets:
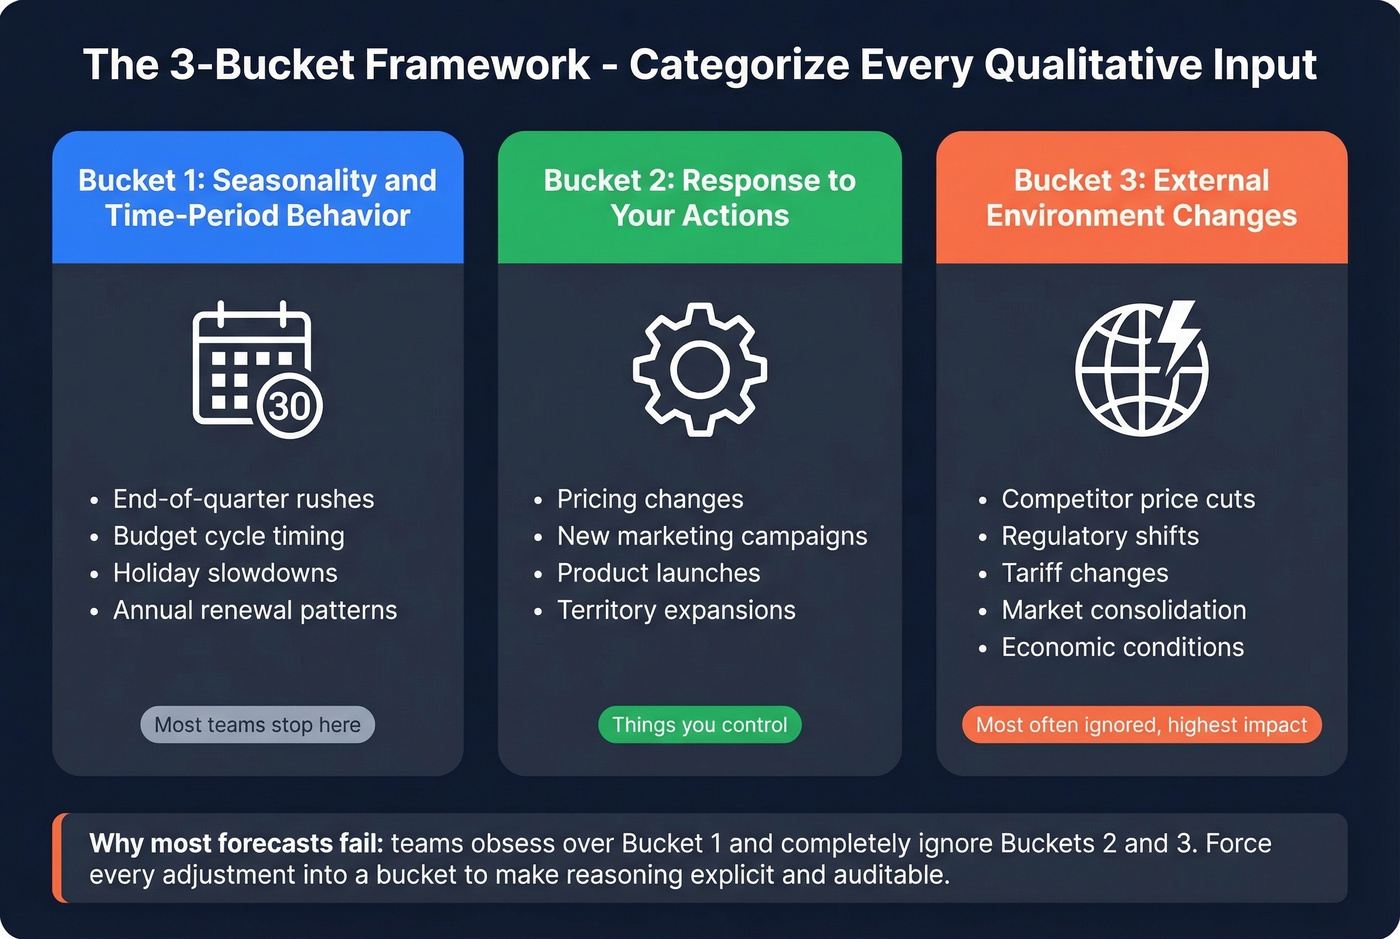
- Seasonality and time-period behavior. Calendar-driven patterns your business follows - end-of-quarter rushes, budget-cycle timing, holiday slowdowns.
- Response to your actions. How demand shifts based on things you control - pricing changes, new marketing campaigns, product launches, territory expansions.
- Response to external environment changes. Competitor moves, regulatory shifts, economic conditions, tariff changes, market consolidation.
The reason most forecasts fail is that teams obsess over bucket one and ignore buckets two and three. If you're selling enterprise software, weather doesn't move your pipeline. But a competitor's 30% price cut? A new tariff on imported components your buyers depend on? Those reshape your forecast overnight, and most models don't account for them.
When you're gathering inputs from reps or executives, force them to categorize every adjustment into one of these three buckets. It makes the reasoning explicit and auditable. Teams that skip bucket categorization end up with forecasts that are just averaged opinions - and averaged opinions aren't a methodology.
Measuring and Reducing Forecast Bias
Forecast bias isn't random error - it's consistent over- or under-estimation in the same direction. Here's the formula:
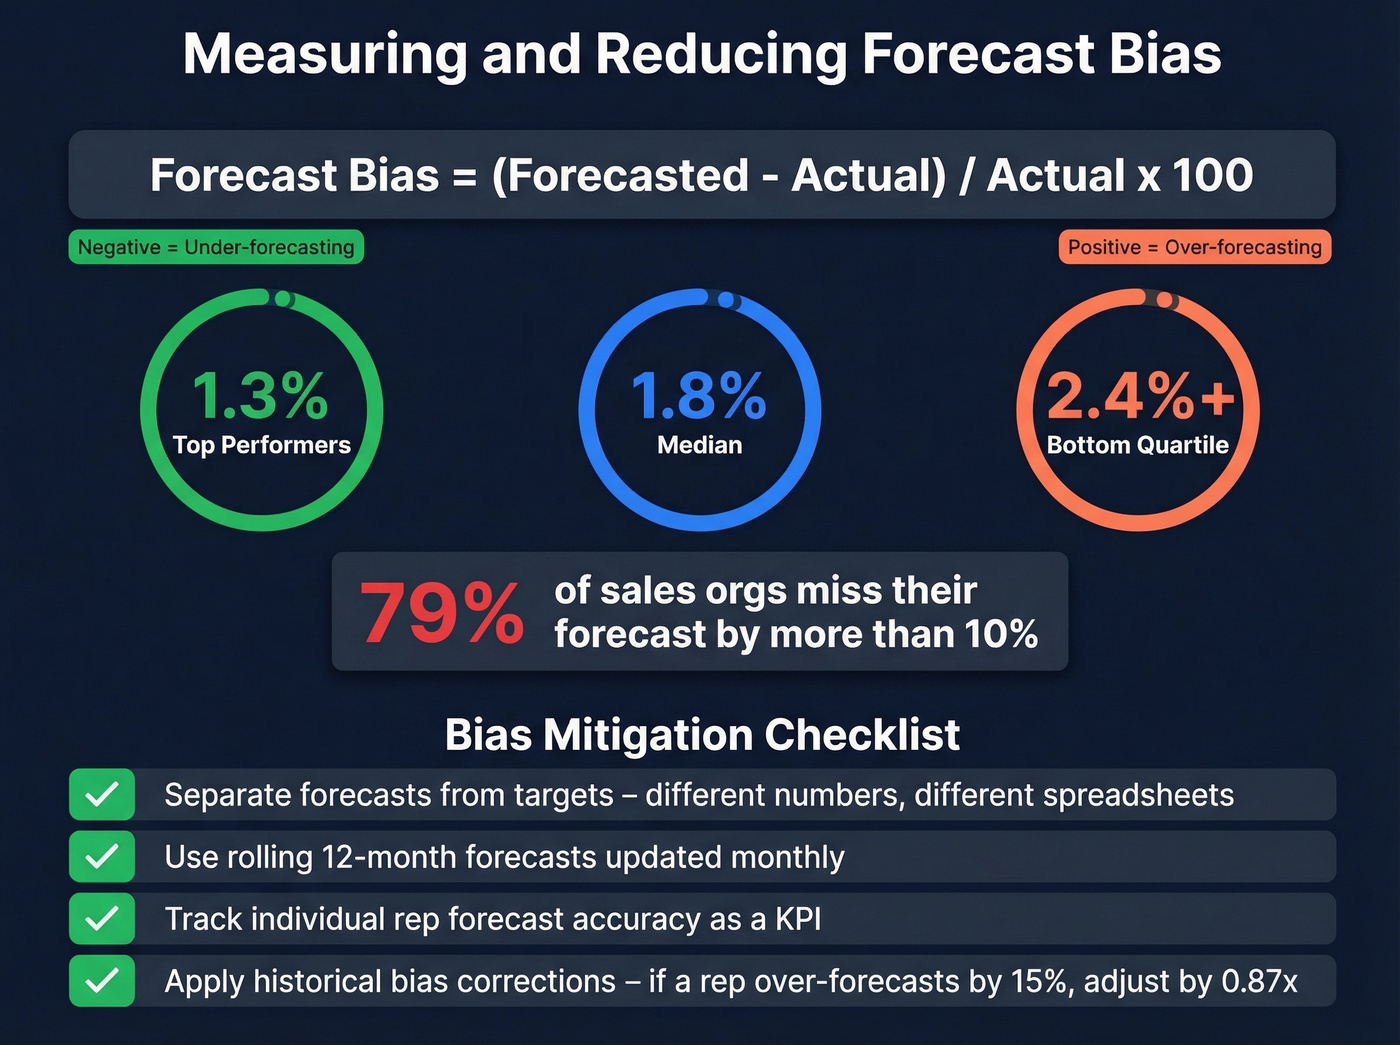
Forecast Bias = (Forecasted Value - Actual Value) / Actual Value x 100
A positive number means you're consistently over-forecasting. Negative means under-forecasting. Track this per rep, per team, and per quarter.
Top performers hit 1.3% error, median lands at 1.8%, and bottom-quartile organizations run 2.4% or higher. For context, 79% of sales organizations miss their forecast by more than 10%. That's not a rounding error - that's a broken process.
Here's the mitigation checklist:
- Separate forecasts from targets. The moment a forecast becomes a performance metric, reps game it. Your forecast is a prediction. Your target is an aspiration. Keep them in different spreadsheets. (If you need a clean definition, see forecast from your target.)
- Use rolling forecasts. Annual forecasts decay fast. A rolling 12-month forecast updated monthly captures market shifts that a January prediction can't.
- Incentivize accuracy. Track individual rep forecast accuracy as a KPI. Reps who are rewarded for accurate predictions stop sandbagging.
- Apply historical bias corrections. If a rep consistently over-forecasts by 15%, apply a 15% haircut to their inputs. Make the adjustment transparent.
- Require bucket categorization. Force every qualitative adjustment to cite which of the three buckets it falls into. Vague "gut feel" adjustments get challenged.
Why Hybrid Forecasting Wins
The academic study mentioned earlier tested three quantitative techniques and one qualitative technique across three years of monthly sales data. The result was clear: combining methods improved accuracy, and blending quantitative baselines with judgment-driven adjustments outperformed either approach alone.
Real-world results back this up. Upwork's weekly deal review process, which layers qualitative deal insights on top of pipeline data, contributes to 95% forecast accuracy. That's not pure opinion - it's contextual intelligence layered on structured data.
A food contract manufacturer documented a similar approach: they replaced blanket orders with monthly quantity releases, established regular customer demand discussions, incorporated "customer's customer" insights, and built a rolling 12-month demand plan with a 4-month detail view for operations. Service levels went up. Excess inventory went down. The key wasn't switching from quantitative to qualitative - it was adding structured human inputs to an existing process.
Let's be honest: if your deals average under $15k, you probably don't need a Delphi panel or a sophisticated hybrid model. A well-run sales force composite with bias corrections will get you 90% of the way there. Save the heavy methodology for high-stakes forecasts where being off by 15% actually changes resource allocation decisions.
Data Quality: The Hidden Variable
Here's the thing most forecasting guides skip entirely: your qualitative inputs are only as good as the pipeline data underneath them.
A survey of 400+ sales and finance professionals found that 66% of organizations can't access historical CRM and performance data, and 97% say the right data would make accurate forecasts easier. Revenue operations teams on Reddit consistently cite the same problem - forecasts built on stale CRM data are worse than no forecast at all.
Your CRM says 200 opportunities, but 40% have bounced emails and outdated job titles. Your SDR manager just told you half the phone numbers in your pipeline are disconnected. Every sales force composite forecast your team submitted last quarter was based on pipeline conversations that may never have happened. Stale contact data doesn't just hurt outbound - it corrupts the inputs your forecast depends on.
Before your next forecast cycle, run your pipeline through an enrichment pass to flag stale records and confirm contacts still work at those companies. We use Prospeo's enrichment for this - 98% email accuracy, a 7-day data refresh cycle, and a 92% match rate means it catches job changes between forecast cycles, the kind of silent pipeline rot that makes reps forecast against ghosts.

Sales force composites only work when reps have genuine pipeline visibility. Prospeo gives your team 300M+ verified profiles with 30+ filters - including buyer intent signals across 15,000 topics - so every territory estimate is grounded in real, qualified opportunities, not guesswork.
Build the pipeline your reps can actually forecast against.
Tools That Support Forecasting
Forecasting platforms handle the modeling and visualization, but they all assume your underlying data is clean - which is a big assumption. Here's what we've seen work:
| Tool | Starting Price | Best For | Qual Input Support |
|---|---|---|---|
| Prospeo | Free-~$0.01/email | Pipeline data quality | Contact verification, enrichment |
| Clari | ~$100-120/user/mo | Revenue intelligence | Deal inspection, risk scoring |
| Gong Forecast | ~$250/user/mo (bundled) | Conversation-driven | Call analysis, deal signals |
| Salesforce Einstein | $50-220/user/mo | CRM-native AI | Opportunity scoring |
| HubSpot Sales Hub | $45-$150/user/mo | SMB/mid-market | Pipeline weighted scoring |
| Zoho CRM Zia | $14-40/user/mo | Budget-conscious teams | Basic AI predictions |
| Pipedrive | $39/user/mo (Growth) | Small sales teams | Visual pipeline forecasts |
| Forecastio | $49-99/user/mo | HubSpot-native teams | Scenario planning |
In our experience, teams cut forecast error by half just by cleaning their pipeline data before running any of these tools. The fanciest AI forecasting model in the world can't fix garbage inputs. If you're evaluating platforms, start with a shortlist of sales forecasting tools and then pressure-test your CRM hygiene.
FAQ
What's the most accurate qualitative forecasting method?
The Delphi method consistently produces the tightest consensus ranges. Anonymous rounds and a structured moderator neutralize dominant-voice bias and force iterative convergence. Expect 2-3 weeks for a proper cycle with 10-20 panelists.
When should I use qualitative over quantitative forecasting?
Use judgment-based methods when you lack 12+ months of historical data - new products, new markets, or after major disruptions like M&A and pricing overhauls. Once sufficient data exists, shift to a hybrid approach that layers expert input on a quantitative baseline.
How do I reduce bias in sales force composite forecasts?
Separate the forecast from the quota target, track individual rep accuracy as a KPI, and apply historical bias corrections. If a rep over-forecasts by 15% consistently, haircut their inputs by 15%. Rolling monthly forecasts also reduce anchoring to stale estimates.
Can qualitative and quantitative forecasting be combined?
Yes - research shows combined approaches outperform either method alone. Use quantitative as the baseline and qualitative as the adjustment layer for deal-level context, competitive moves, and market shifts the model can't capture.
How does pipeline data quality affect forecast accuracy?
Directly and severely. If 40% of your CRM contacts have bounced emails or outdated titles, your reps' estimates are built on phantom conversations. Cleaning your pipeline with a tool that refreshes data weekly catches job changes and stale records before they corrupt your forecast inputs.