Revenue Planning: Formulas, Frameworks, and the Mistakes Killing Your 2026 Forecast
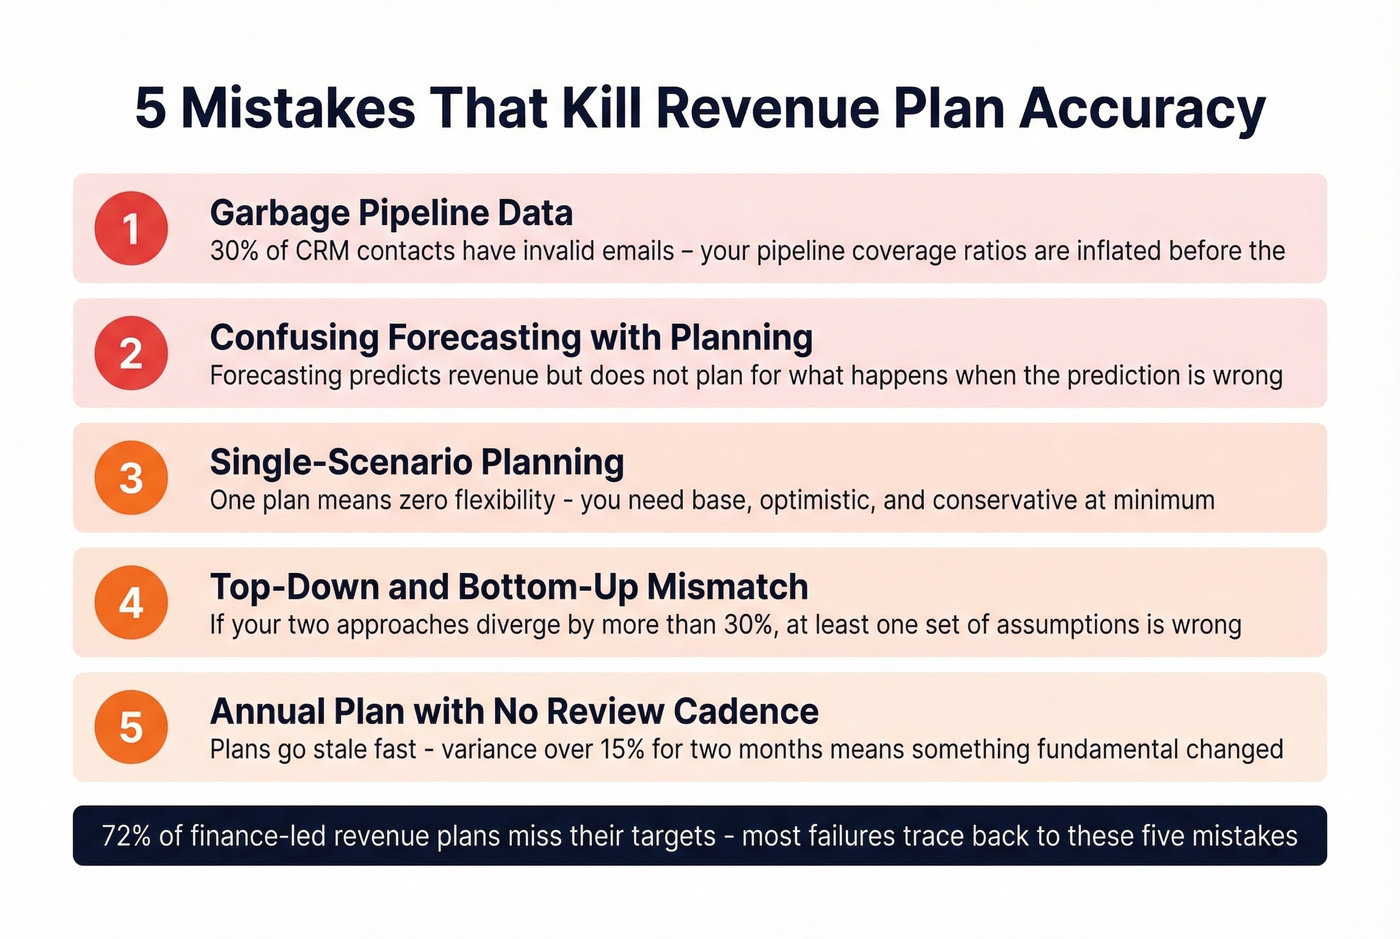
It's Q4. The board wants next year's number by Friday. Finance pulled a top-down model from last year's actuals, sales submitted a bottom-up forecast that's 40% higher, and nobody can agree on which pipeline deals are real. Roughly 72% of finance-led revenue plans miss their targets - and the problem isn't the math. It's the data feeding the math, the process surrounding it, and the fact that most revenue planning guides hand you seven steps and zero formulas. That's a recipe with ingredients but no measurements.
Here's the short version before we go deep:
- Revenue planning isn't forecasting. It's the decision-making framework that includes forecasting as one input.
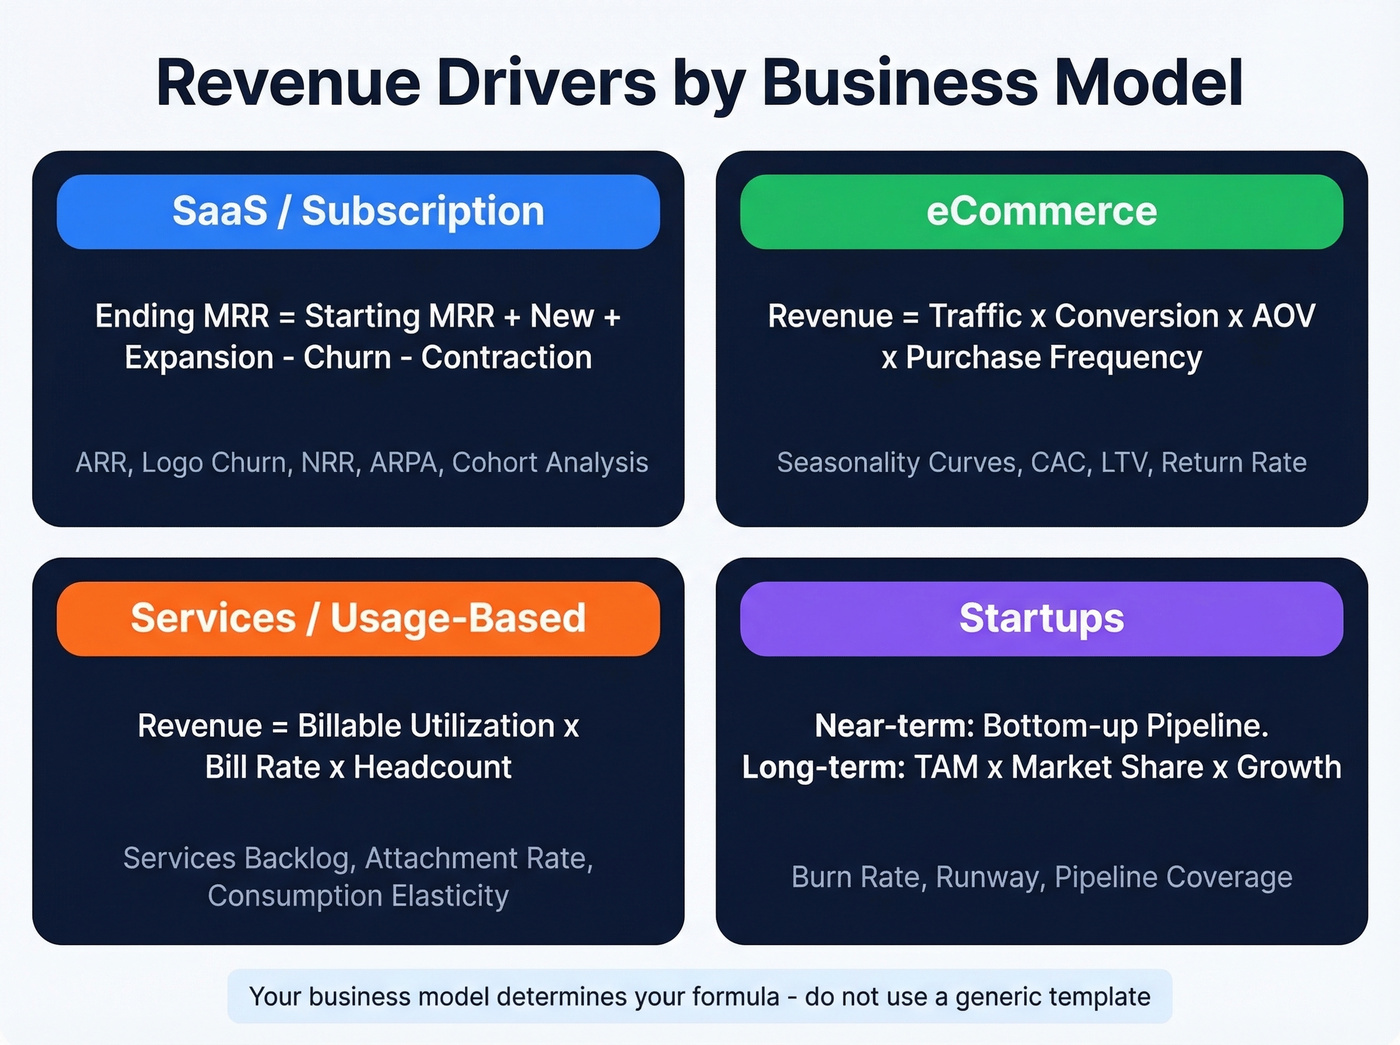
- Your business model determines your revenue drivers - SaaS, eCommerce, and services companies need different formulas, different cadences, different assumptions.
- Your plan is only as accurate as your pipeline data. Fix data quality before you spend $50K on FP&A software.
What Revenue Planning Actually Is
Revenue planning is the structured process of setting revenue targets, allocating resources to hit them, modeling scenarios when things change, and governing who owns the number.
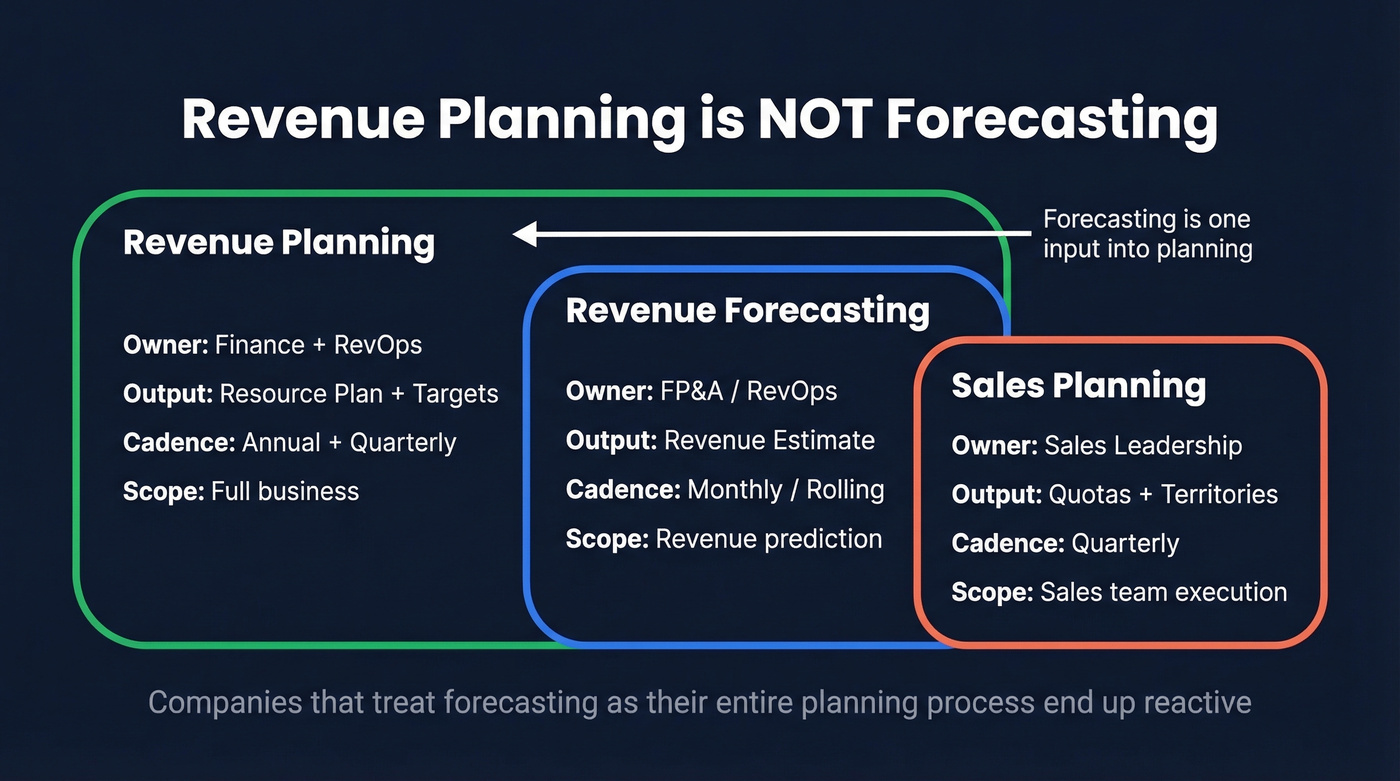
Most people confuse it with forecasting. Forecasting is a prediction. Planning is the system that uses that prediction - alongside capacity models, territory plans, scenario analysis, and budget constraints - to make decisions.
| Revenue Planning | Revenue Forecasting | Sales Planning | |
|---|---|---|---|
| Scope | Full business | Revenue prediction | Sales team execution |
| Owner | Finance + RevOps | FP&A / RevOps | Sales leadership |
| Output | Resource plan + targets | Revenue estimate | Quotas + territories |
| Cadence | Annual + quarterly | Monthly / rolling | Quarterly / annual |
Organizations that treat forecasting as their entire planning process end up reactive. They predict revenue but don't plan for what happens when the prediction is wrong.
Why Revenue Targets Matter More Than Ever
Companies that get this right don't just hit their numbers more often - the advantage compounds. Research on growth champions found that companies sustaining above-market growth generated 80% more shareholder value over a 10-year period than their peers. Yet only about 1 in 8 companies managed to grow revenue more than 10% annually between 2010 and 2019.
97% of executives report intense pressure to maximize revenue within the next two years. That pressure flows downhill into quotas, hiring plans, product roadmaps, and fundraising narratives. A disciplined revenue planning process absorbs that pressure and turns it into something people can actually execute. Without one, you get territories assigned without data, quotas set before capacity is validated, and forecasts built on gut feel.
Revenue Planning by Business Model
Generic advice doesn't help here. A SaaS company with 90% recurring revenue and a services firm billing hourly have almost nothing in common when it comes to modeling future revenue.
SaaS & Subscription
The core unit is MRR (Monthly Recurring Revenue), and everything flows from it. Your plan needs to decompose MRR into new, expansion, churned, and contraction components - the exact formula is in the revenue model section below.
Key metrics: ARR, logo churn rate, net revenue retention, ARPA, and CARR if you have usage-based pricing mixed in. Cohort analysis is essential - how do customers acquired in Q1 behave differently from those acquired in Q3? Investors expect SaaS gross margins above 70%, so track margin by revenue stream, not just top-line growth.
eCommerce
Revenue = Traffic x Conversion Rate x Average Order Value x Purchase Frequency. That's your driver tree. Seasonality dominates eCommerce planning - a Q4-heavy business can generate 40% of annual revenue in two months. Your plan needs to model this explicitly, not smooth it into monthly averages.
A worked example: a DTC brand with 500K monthly visitors, 2.8% conversion, $65 AOV, and 1.4 annual purchase frequency generates roughly $1.27M in monthly revenue. Bump conversion from 2.8% to 3.2% and you add roughly $928K per month. That's the kind of sensitivity your model should surface.
Services & Usage-Based
For professional services, the drivers are billable utilization, average bill rate, and headcount. Track services backlog - contracted but undelivered work - and attachment rate, meaning services sold alongside product. Keep services gross margin separate from product margin. Don't co-mingle services revenue with recurring revenue in your model; investors discount it, and it behaves differently.
For usage-based models, consumption elasticity matters. If customers can dial usage up or down monthly, your revenue plan needs sensitivity analysis around consumption patterns, not just customer count.
Startups
Limited historical data is the defining constraint. Bottom-up planning works for the next one to two quarters - you know your pipeline, your reps, your conversion rates. Beyond that, top-down framing is more honest: TAM x realistic market share x growth rate gives you a narrative for fundraising without pretending you can predict month-by-month revenue 18 months out.
The best startup revenue plans combine a tight bottom-up operational model for the near term with a top-down strategic narrative for the fundraising deck, and as historical data accumulates, you layer in time series analysis for trend and seasonality detection and regression models to isolate which drivers actually move revenue. Don't try to make one model do both jobs.
The Revenue Planning Process
Step 1: Analyze Historical Performance
Pull 12-24 months of actuals by segment, product, and geography. Look for patterns: seasonality, cohort degradation, expansion timing. If you don't have clean historical data, that's your first problem to solve - not your first excuse to skip this step.
Step 2: Pick Your Forecasting Method
Bottom-up for the next one to two quarters, top-down for one-plus years. If your top-down and bottom-up numbers diverge by more than 30%, at least one set of assumptions is wrong.
Step 3: Segment Your Revenue
Don't plan revenue as a single number. Break it into segments that behave differently and can be acted on independently:
| Segment | Current ARR | Growth Target | Strategy |
|---|---|---|---|
| Enterprise | $4.2M | 25% | Expand existing accounts |
| SMB | $1.8M | 40% | Volume acquisition |
| EU Market | $600K | 60% | New territory build |
| New Product | $0 | $400K | Launch + early adopters |
Step 4: Allocate Resources
Match headcount, marketing spend, and capacity to each segment's growth target. A 60% growth target for EU with zero new hires is a fantasy, not a plan.
Step 5: Build Scenarios
Three scenarios - optimistic, base, conservative - changing two to three key assumptions per scenario. Not everything. If you change every variable, you're just generating noise.
Step 6: Monitor and Adjust
Build the annual plan in Q4. Review quarterly at minimum. Use rolling monthly forecasts to complement the annual plan, and add a 13-week cash flow model for short-horizon visibility - it fills the gap between monthly views that miss patterns and annual forecasts that go stale.
Variance thresholds should trigger specific actions:
- 5-15% variance: investigate the driver, adjust assumptions
- >15% variance: reforecast, update assumptions, notify stakeholders
- >25% for 2+ consecutive months: structural model review - something fundamental changed
You just read it: 72% of revenue plans miss because of bad data feeding the math. Prospeo's 300M+ profiles refresh every 7 days - not every 6 weeks - so your pipeline reflects reality, not last quarter's stale contacts. 98% email accuracy means your capacity models and territory plans are built on numbers that hold up.
Stop planning on bad data. Start with contacts that actually connect.
Forecasting Methods That Feed the Plan
Two primary approaches, and you need both.
Top-down formula: Revenue = TAM x Market Share % x Growth Rate. Start with the total addressable market and work down. It's fast, requires minimal internal data, and gives you a strategic narrative. The weakness: it can ignore operational realities entirely.
Bottom-up formula: Total Revenue = sum of rep forecasts + product line forecasts + other revenue streams. Start with individual deals, reps, or product lines and aggregate up. It's granular and actionable. The weakness: it's time-consuming and subject to rep optimism bias.
| Method | Pros | Cons | Best For |
|---|---|---|---|
| Top-down | Fast, strategic, minimal data needed | Ignores operational reality | Long-term (1+ years) |
| Bottom-up | Granular, actionable, testable | Time-consuming, optimism bias | Near-term (1-2 quarters) |
| Hybrid | Balances both, catches errors | More complex to maintain | Annual planning |
Use bottom-up as your operational plan and top-down as a sanity check. If they diverge by more than 30%, dig into your assumptions before presenting to anyone.
Building Your Revenue Model
For a SaaS business, the core formula is:
Ending MRR = Starting MRR + New MRR + Expansion MRR - Churned MRR - Contraction MRR
Where:
- New MRR = New Customers x ARPA
- Expansion MRR = (Starting MRR - Churned MRR) x Expansion Rate
- Churned MRR = Starting Customers x Churn Rate x ARPA
Let's walk through a worked example. A mid-market SaaS company with 340 customers, ARPA of $535/mo, monthly logo churn of 3.1%, and NRR of 108% has a starting MRR of $182K and ARR of $2.18M. Here's Month 1:
- New MRR = 15 new customers x $535 = $8,025
- Churned MRR = 340 x 3.1% x $535 = $5,637
- Expansion MRR = ($182,000 - $5,637) x 2% = $3,527
- Ending MRR = $182,000 + $8,025 + $3,527 - $5,637 = $187,915
Repeat month by month, adjusting new customer acquisition, expansion rates, and churn independently.
The Three-Scenario Framework
Build three versions of your model. For each scenario, change only two to three key assumptions:
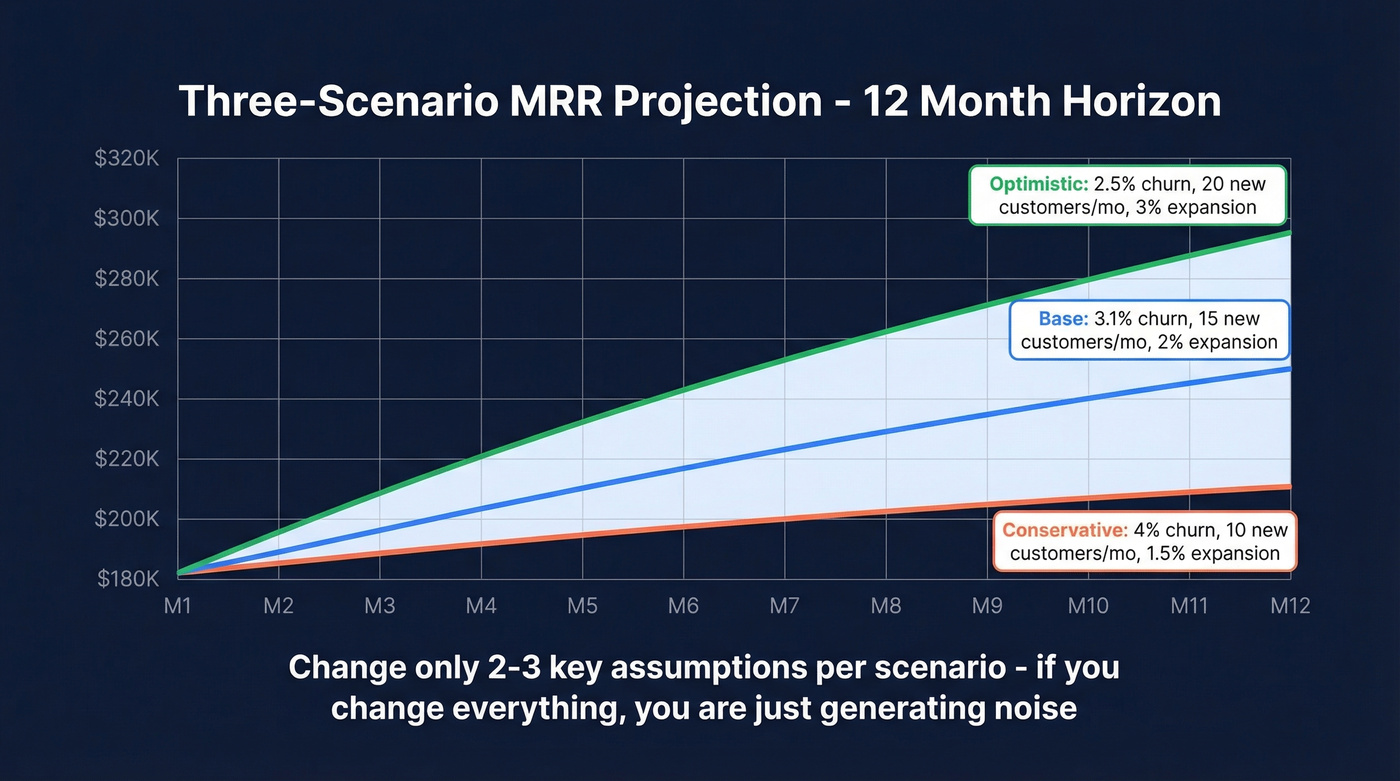
- Base: 3.1% monthly churn, 15 new customers/month, 2% expansion rate
- Optimistic: 2.5% churn, 20 new customers/month, 3% expansion rate
- Conservative: 4% churn, 10 new customers/month, 1.5% expansion rate
Standard planning horizon is 12 months. If you're fundraising, extend to 24 - investors want to see the trajectory, even if the outer months are directional.
Five Mistakes That Kill Accuracy
Mistake 1: Garbage Pipeline Data
Every number in your revenue plan traces back to pipeline data. If 30% of your CRM contacts have invalid emails or outdated job titles, your pipeline coverage ratios are inflated, your conversion assumptions are wrong, and your forecast is fiction.
This is where most plans fail before the math even starts. We've seen teams spend months building sophisticated models only to realize the underlying contact data was six months stale. Prospeo's CRM enrichment refreshes contact data on a 7-day cycle with 98% email accuracy and an 83% enrichment match rate, returning 50+ data points per contact - so your pipeline reflects reality, not outdated job titles. Before you invest in FP&A software, invest in the data layer underneath it.

Mistake 2: Straight-Line Extrapolation
"We grew 30% last year, so we'll grow 30% next year." Markets shift. Competitors launch. Churn accelerates. A revenue plan that assumes the past repeats is a plan that's already wrong - especially in 2026, where macro conditions, AI disruption, and shifting buyer behavior make last year's growth curve an unreliable guide.
Mistake 3: Static Planning Cadence
Treating the plan as an annual exercise you revisit in Q4 is a recipe for surprise. Rolling monthly forecasts catch drift early. Quarterly reviews force accountability. If you're only looking at the plan twice a year, you're not planning - you're hoping.
Mistake 4: No Scenario Planning
A single-track plan with no contingency is fragile. When the base case breaks - and it will - you need pre-built responses, not a fire drill. The three-scenario framework takes maybe two extra hours to build and saves weeks of panic later.
Mistake 5: Spreadsheet Fragility
Here's the thing: if your revenue plan lives in Excel and one person maintains it, you don't have a plan - you have a single point of failure. One FP&A practitioner on r/FPandA described running a multi-product SaaS cohort model that started breaking down with thousands of customers, multiple products, overlapping commission structures, and seasonality patterns. Cohort segmentation created exceptions, but further segmentation made cohorts useless. Excel can't handle that complexity without becoming a maintenance nightmare.
Governance: Who Owns the Plan
A VP of Sales on Reddit described being asked to write the revenue plan that would directly determine their variable compensation - hit 80% attainment, get 5% of gross margin; hit 100%, get 7%. The incentive to sandbag is obvious.
This is why governance matters. The person setting the revenue target should not be the same person whose comp depends on attainment. Finance owns the model. Sales provides pipeline inputs and capacity assumptions. RevOps validates data quality. The executive team approves the final number.
We've seen organizations where sales and finance had a 40% gap between their revenue projections - and nobody caught it until board prep. Cross-functional alignment isn't a nice-to-have. It's the difference between a plan that works and a plan that collapses on contact with reality. Solid revenue target planning requires this kind of checks-and-balances structure, not a single stakeholder operating in isolation.
Skip the big platform if you're small. If your average deal size is under $15K and your team is under 20 reps, you probably don't need Anaplan or Workday Adaptive. A well-built spreadsheet with clean data will outperform a $60K platform that nobody fully implements. The tool doesn't fix the process.
Revenue Planning Software
Here's how the major platforms compare, based on Gartner Peer Insights ratings:
| Tool | Rating | Pricing | Best For |
|---|---|---|---|
| Workday Adaptive | 4.7/5 (446 reviews) | ~$25K-$80K+/yr | Enterprise FP&A |
| Oracle Fusion EPM | 4.7/5 (332 reviews) | ~$30K-$100K+/yr | Large orgs on Oracle stack |
| OneStream | 4.6/5 (339 reviews) | ~$50K-$150K/yr | Complex consolidation |
| Anaplan | 4.5/5 (364 reviews) | ~$30K-$100K/yr | Scenario modeling |
| Vena | 4.5/5 (323 reviews) | ~$15K-$40K/yr | Mid-market, Excel-native |
| Planful | N/A | ~$15K-$50K/yr | Mid-market FP&A |
| Abacum | N/A | ~$15K-$40K/yr | SaaS finance teams |
| Jirav | N/A | From $50/mo | SMBs and startups |
| LivePlan | N/A | From $15/mo | Early-stage startups |
Selection criteria that actually matter: driver-based modeling support, scenario versioning, native CRM/ERP integrations, and spreadsheet-friendly workflows for the team members who'll never leave Excel. Tools that integrate with your CRM out of the box save weeks of setup time.
For startups and SMBs, Jirav at $50/mo or LivePlan at $15/mo can cover the basics without enterprise overhead. Regardless of platform, the data feeding it determines the output quality - which is why pipeline accuracy tools sit underneath any of these as the data layer.
You're segmenting revenue by enterprise, SMB, and new markets - but none of that matters if your reps can't reach the buyers in each segment. Prospeo layers 30+ filters including buyer intent, headcount growth, and technographics so your resource allocation matches real, reachable demand. Teams using Prospeo book 26% more meetings than ZoomInfo users.
Turn your revenue segments into booked meetings for $0.01 per lead.
FAQ
What's the difference between revenue planning and revenue forecasting?
Revenue forecasting predicts future revenue based on data and assumptions. Revenue planning is the broader strategic framework - it includes forecasting but also covers resource allocation, scenario modeling, governance, and cross-functional alignment. Forecasting is one input; planning is the decision-making system that acts on it.
How often should you update a revenue plan?
Build the annual plan in Q4 and review quarterly at minimum. Update immediately for material triggers - fundraising rounds, product launches, or when variance exceeds 15% for two consecutive months. Rolling monthly forecasts complement the annual plan without replacing it.
How does pipeline data quality affect revenue forecasts?
Directly and significantly. If 30% of CRM contacts have invalid emails or outdated titles, your pipeline coverage ratios are inflated and conversion assumptions are wrong. Weekly enrichment cycles that keep contact data current are the single highest-leverage fix most teams skip.
What's a good planning cadence for startups?
Monthly reviews for the first two years, minimum. Use a tight bottom-up model for the current quarter, a looser top-down frame for the next two to three quarters, and reforecast whenever a major assumption changes - new hire, lost customer, pricing shift. Don't wait for the quarterly review if reality already moved.
How can teams recover when the plan is already off track?
Identify which revenue segments are underperforming and whether it's pipeline volume, conversion, or deal size. Reforecast remaining months using actuals, not original assumptions. Reallocate resources toward segments with the highest close probability and shortest sales cycle. The variance thresholds above should have flagged drift early; if they didn't, tighten monitoring for the rest of the year.