RevOps KPIs That Actually Move Revenue (2026 Benchmarks)
It's Monday morning. The CRO pulls up a dashboard with 23 metrics, squints at pipeline coverage, then asks why forecast accuracy dropped - except nobody agreed on how to measure forecast accuracy in the first place. 92% of RevOps pros say metrics are core to their role, yet the average team maintains 20+ reports nobody reads.
The problem isn't a lack of RevOps KPIs. It's a lack of the right ones, with clear thresholds and defined responses when something breaks.
The Five Revenue Operations KPIs That Matter Most
If you could only track five metrics, pick these:
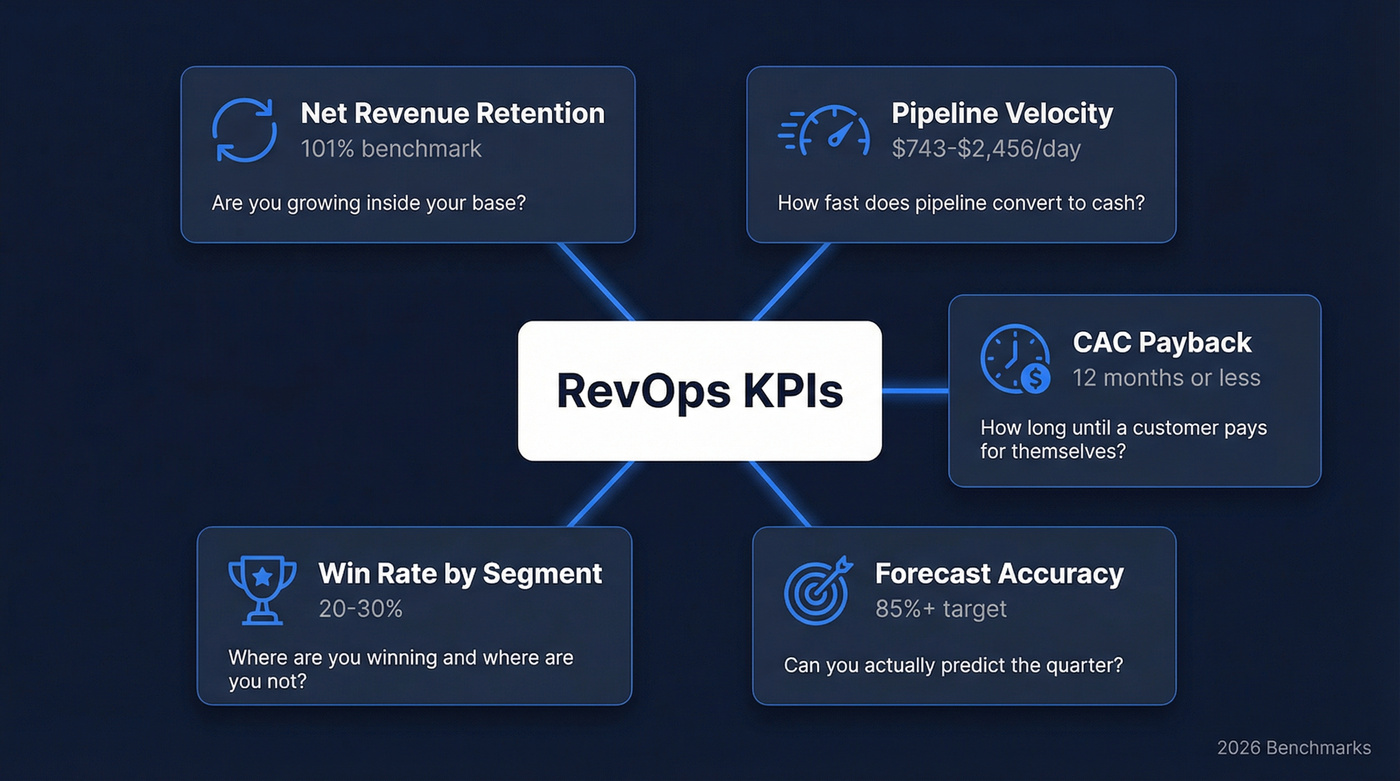
- Net Revenue Retention (NRR) - are you growing inside your base?
- Pipeline velocity - how fast does pipeline convert to cash?
- CAC payback - how long until a customer pays for themselves?
- Forecast accuracy - can you actually predict the quarter?
- Win rate by segment - where are you winning, and where aren't you?
The single highest-value report is a weekly pipeline health review: coverage, conversion, velocity, and risk on one screen. Every KPI needs a target, an alert threshold, and a defined action when it's breached. If a metric doesn't trigger a response when it moves, delete it from the dashboard.
Leading vs. Lagging Indicators
Revenue operations metrics fall into three tiers: activity metrics (calls, emails, meetings booked), conversion metrics (stage progression, win rates), and outcome metrics (revenue, CAC, retention). Most teams over-index on outcome metrics - the lagging stuff that tells you what already happened.
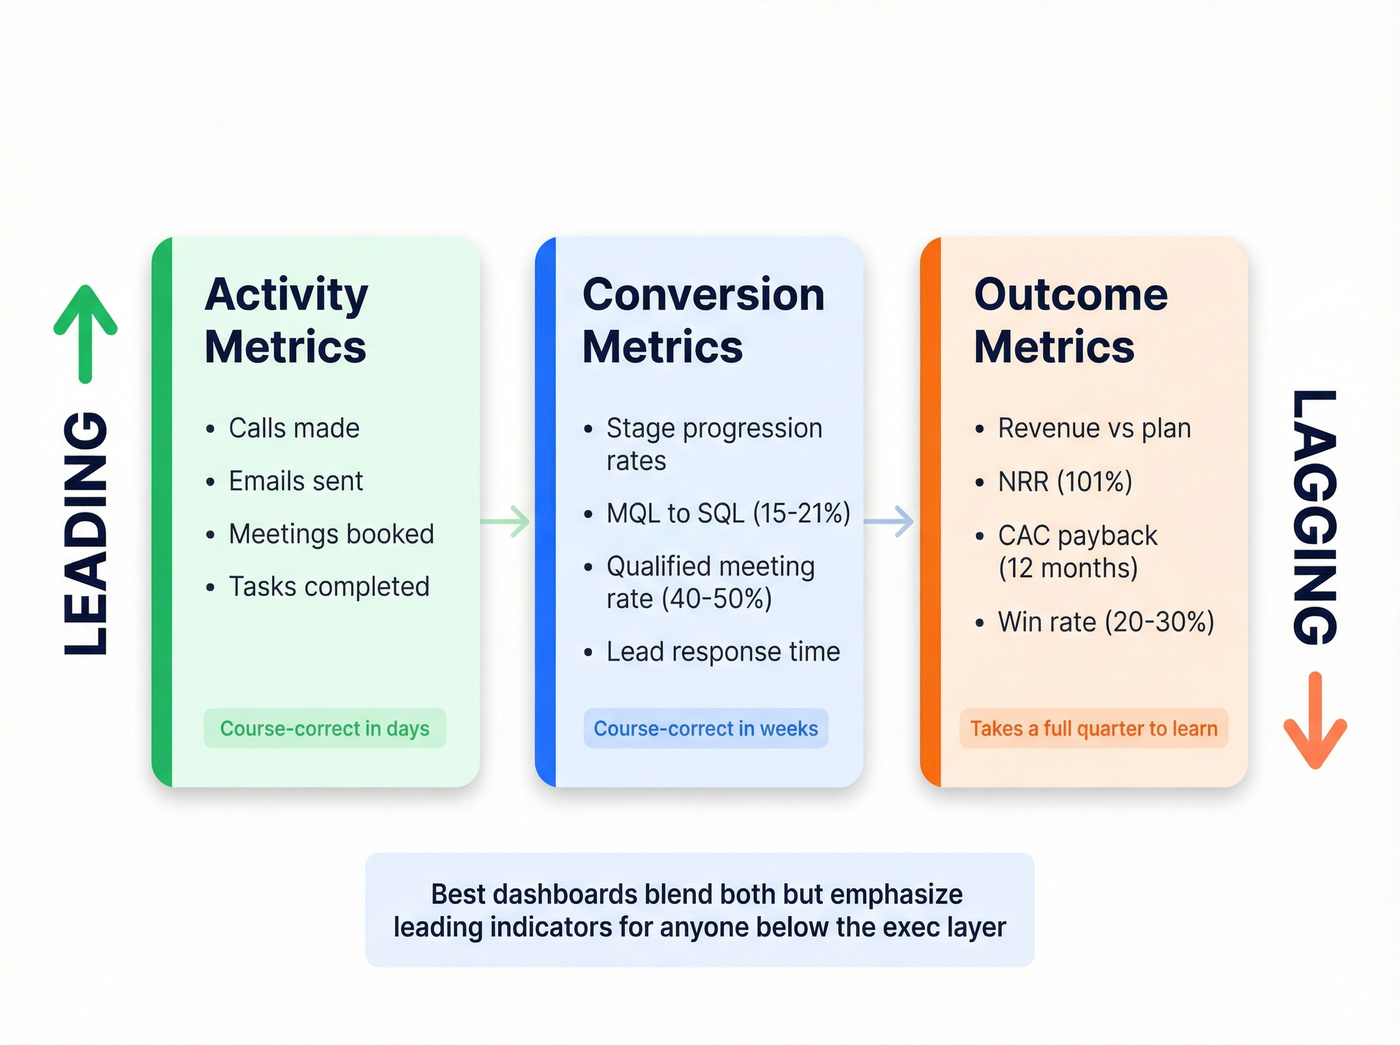
Leading indicators let you course-correct in days. Lagging indicators make you wait a full quarter to learn you had a problem in week three. The best dashboards blend both but emphasize leading indicators for anyone below the executive layer. We've found that reps who see their own leading indicators daily self-correct before managers even notice a dip.
Revenue & Pipeline Benchmarks Worth Tracking
Pin this benchmark table somewhere your team can see it. These numbers are drawn from the most recent industry surveys, primarily 2024-2025 data cycles. Benchmarkit's dataset covers 500+ B2B SaaS companies.
| KPI | 2026 Benchmark | Source |
|---|---|---|
| NRR | 101% | Benchmarkit |
| GRR | 88% | Benchmarkit |
| New Customer CAC Ratio | $2.00 per $1 ARR | Benchmarkit |
| Expansion ARR % | 40% of new ARR | Benchmarkit |
| Lead-to-Customer | 2-5% | Digital Bloom |
| MQL to SQL | 15-21% | Digital Bloom |
| Win Rate | 20-30% | Digital Bloom |
| Median Sales Cycle | 84 days | Digital Bloom |
| Pipeline Velocity | $743-$2,456/day | Digital Bloom |
| Forecast Accuracy | 85%+ (best: 90-95%) | Forecastio |
| ARR per FTE | $200k-$300k | Benchmarkit |
| CAC Payback | 12 months or less | Benchmarkit |
Revenue & Retention
ARR and MRR are table stakes. The more interesting metrics sit underneath them. NRR benchmarks have settled at 101%, meaning the median SaaS company barely grows inside its existing base. GRR has slipped from 90% to 88% over three years - a slow bleed that compounds fast.
Expansion ARR now accounts for 40% of Total New ARR at median, and over 50% for companies above $50M. Top quartile growth dropped from 60% in 2023 to 50% in 2024. If your NRR is below 100%, you have a retention problem masquerading as a growth problem. Fix churn before you pour more into acquisition.
Pipeline & Sales
Most teams get pipeline wrong by tracking coverage alone. Pipeline velocity is the single best compound metric in revenue operations:
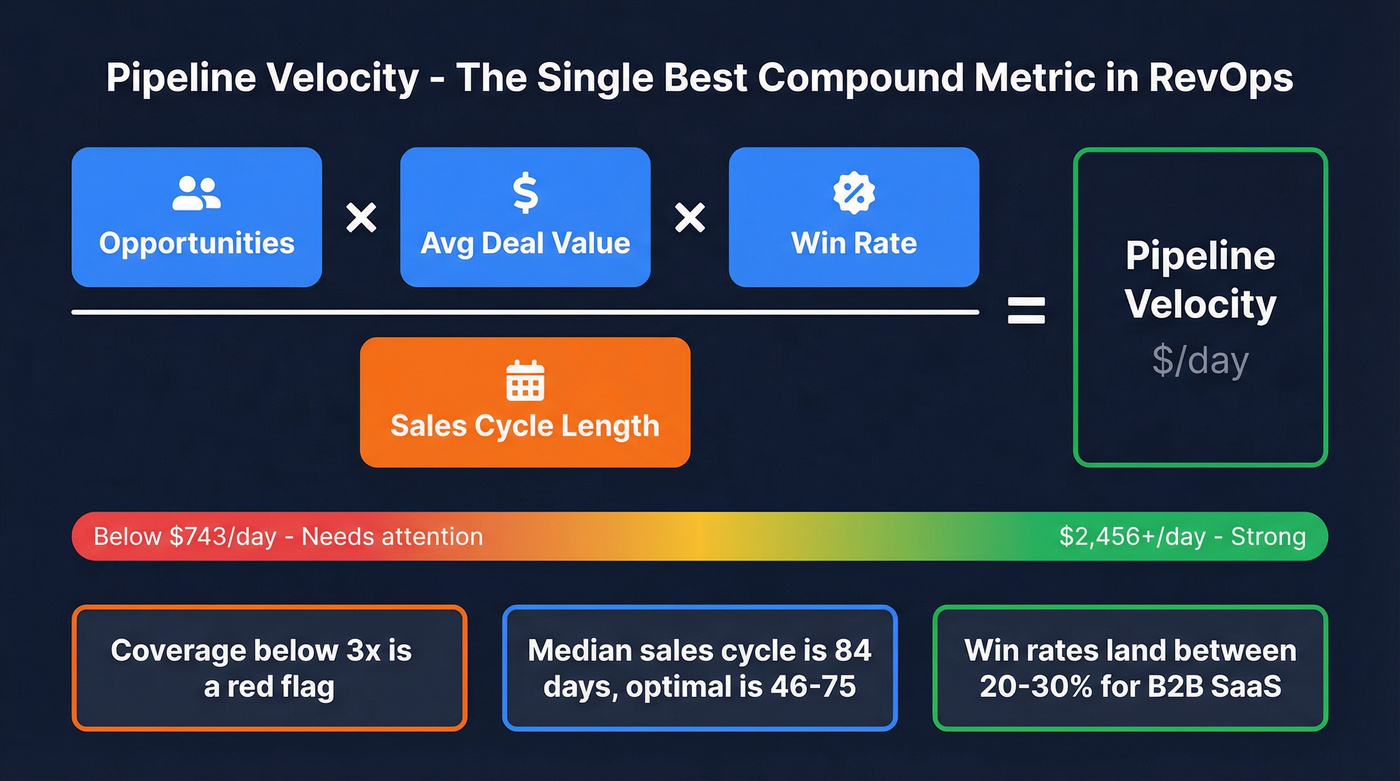
(Opportunities x Avg Deal Value x Win Rate) / Sales Cycle Length
Benchmarks range from $743 to $2,456 per day depending on segment. Coverage should run 3-4x your next-quarter target - anything below 3x is a red flag.
Win rates land between 20-30% for most B2B SaaS, with MQL-to-SQL running 39% for SMB versus 31% for enterprise. Median sales cycle is 84 days; the optimal range is 46-75. If you're above 84, dig into stage-by-stage conversion to find the bottleneck. In our experience, the stall usually lives between discovery and proposal - reps qualify loosely, then deals stall when procurement gets involved.
Forecast accuracy deserves its own spotlight. Only 22% of RevOps leaders believe they have the right data to forecast accurately. Measure it with MAPE:
Forecast Accuracy (%) = (1 - |Forecast - Actual| / Actual) x 100
High-performing orgs target 85% or higher. Best-in-class hit 90-95%.
Efficiency
Here's the thing: if your average deal size is under $15k, CAC payback matters more than LTV:CAC. LTV:CAC is a lagging vanity metric that takes 2-3 years to validate. CAC payback tells you whether you'll survive the next two quarters.
Median CAC ratio runs $2.00 in S&M spend for every $1 of new customer ARR. Payback under 12 months is strong, 12-18 is acceptable, and anything past 18 months means you're burning cash faster than you're building a business. ARR per FTE ranges from $200k at $50M ARR to $300k above $100M.
Emerging Metrics for 2026
Two metrics gaining traction that most teams aren't tracking yet:
Cost Per Meeting - total demand gen spend divided by discovery calls with ICPs. And Qualified Meeting Conversion Rate - what percentage of discovery calls become qualified pipeline, benchmarked at 40-50%. Track both weekly. They're the fastest signal that ICP targeting or messaging is off.
Customer health scoring is also maturing fast, built around product usage, support experience, sentiment, and advocacy. Normalize with indicators like usage per seat, case resolution time, NPS trends, and webinar recency. Segment scores by customer tier so you're not applying the same thresholds to a $5k account and a $500k account.
Pipeline velocity depends on reaching real buyers fast. Prospeo's 7-day data refresh and 98% email accuracy mean your reps spend zero time chasing dead contacts - so your stage-by-stage conversion rates actually improve.
Stop letting stale data tank your RevOps KPIs.
Vanity Metrics to Stop Tracking
Kill MQL volume without a revenue tie. We've audited dozens of RevOps dashboards, and the pattern repeats: marketing hits their MQL target by 120%, revenue misses by 15%, everyone points fingers. The consensus on r/sales and r/RevOps echoes this - one practitioner called SaaS metrics "over-engineered and poorly defined," and they're right.
Kill raw lead count. Kill vanity activity metrics like "emails sent" that don't connect to pipeline outcomes. The fix is simple: shift marketing KPIs to SQLs and qualified meetings. Incentive alignment changes overnight.
How to Operationalize Your Metrics
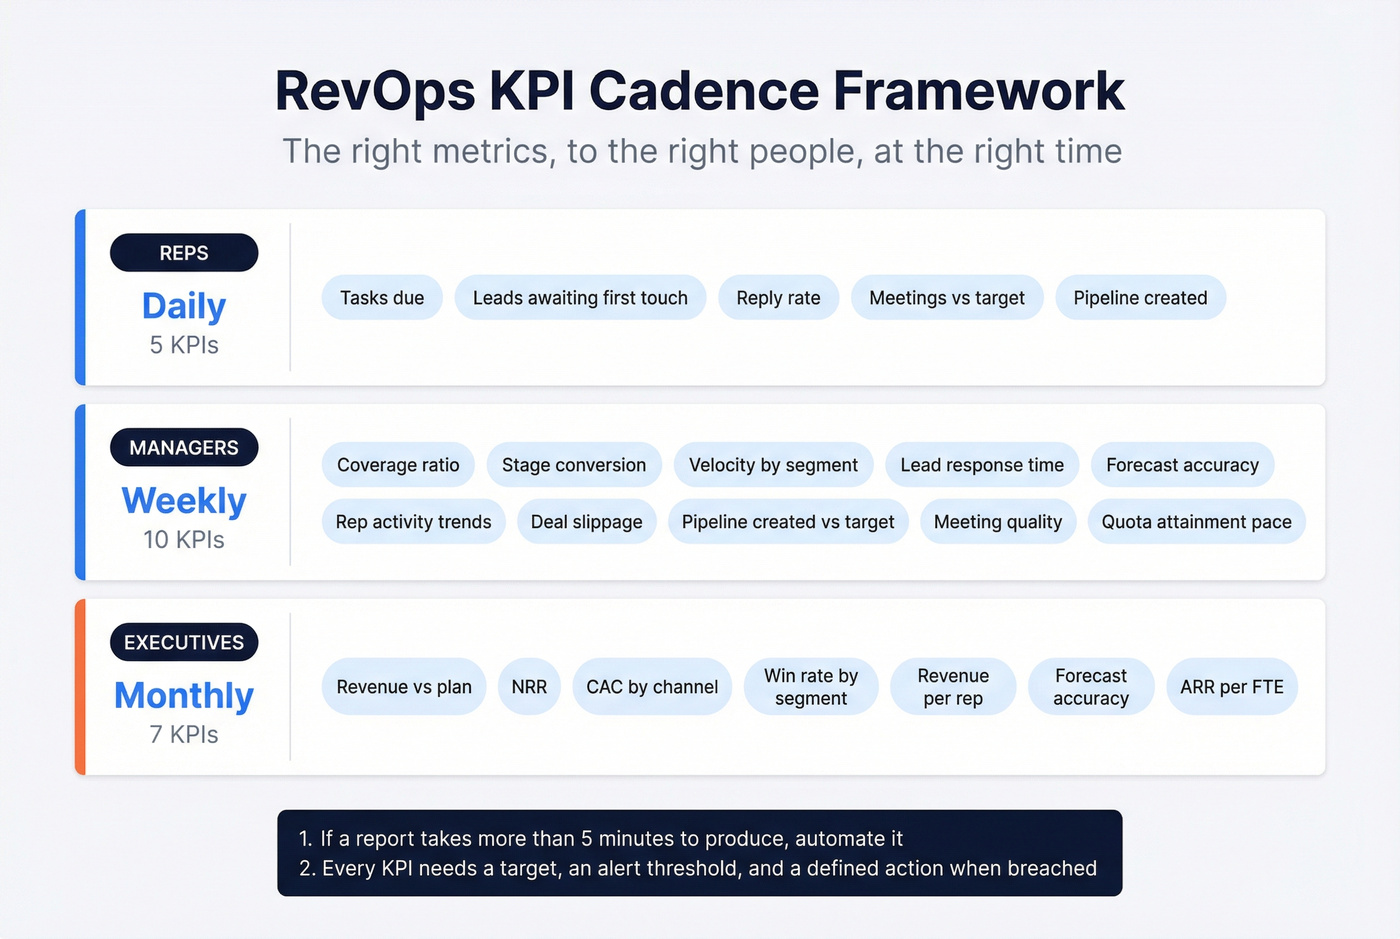
Tracking KPIs is easy. Making them drive decisions is the hard part. Let's break down the cadence framework we use:
| Layer | Cadence | KPIs | Examples |
|---|---|---|---|
| Reps | Daily | 5 | Tasks due, leads awaiting first touch, reply rate, meetings vs. target, pipeline created |
| Managers | Weekly | 10 | Coverage ratio, stage conversion, velocity by segment, lead response time, forecast accuracy |
| Executives | Monthly | 7 | Revenue vs. plan, NRR, CAC by channel, win rate by segment, revenue per rep |
Two rules. First, if a recurring report takes more than 5 minutes to produce, automate it. Second, every KPI needs a target, an alert threshold, and a defined action when breached. No action? No KPI. The best revenue leader success metrics are the ones that actually change behavior when they move. Everything else is noise you're paying someone to maintain.
Skip the "single source of truth" dashboards that try to show everything to everyone. They end up showing nothing useful to anyone. Build role-specific views instead.
Your KPIs Are Only as Good as Your Data
46.51% of RevOps time goes to manual data cleansing - nearly half your team's bandwidth fixing the foundation instead of analyzing what's built on top of it. That number is frustrating, and it should be. Bad contact data inflates CAC, kills pipeline velocity calculations, and makes conversion rates meaningless. If 30-40% of your emails bounce, your pipeline math is fiction.
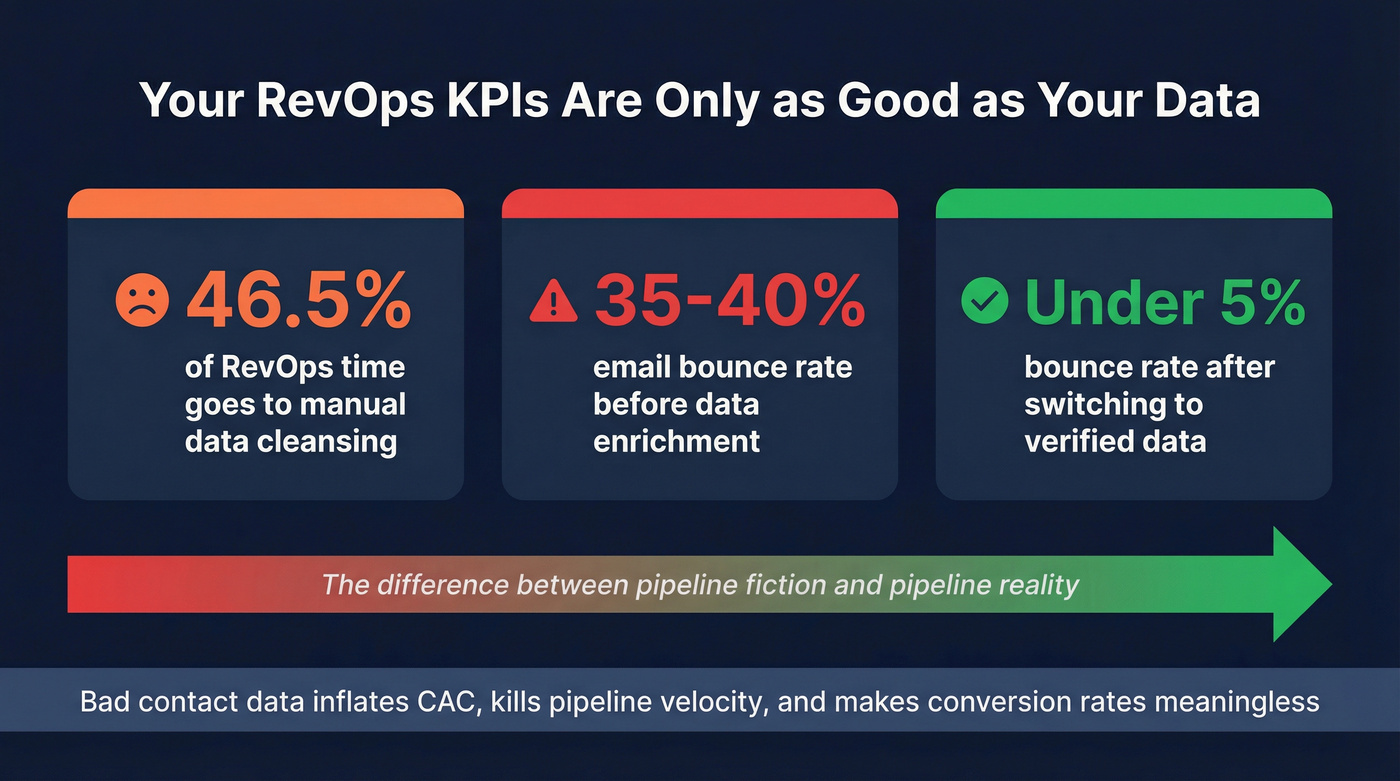
This is where data quality tooling pays for itself. Prospeo's CRM enrichment returns 50+ data points per contact with 98% email accuracy, refreshed on a 7-day cycle. Snyk saw bounce rates drop from 35-40% to under 5% after switching - which meant their pipeline velocity and CAC numbers finally reflected reality instead of noise.
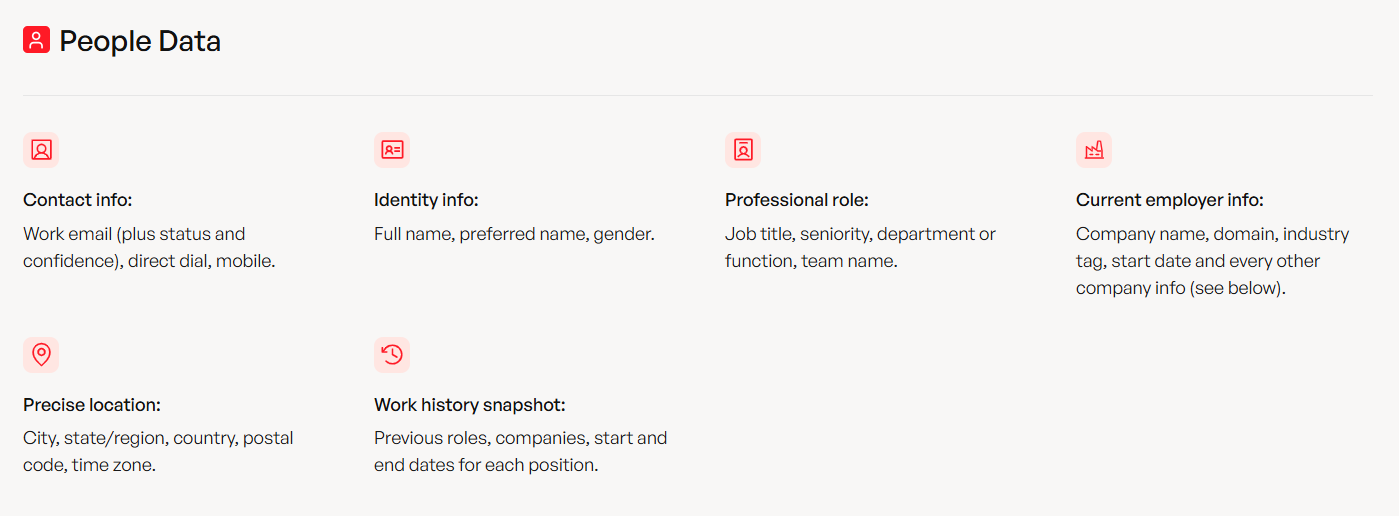
Tracking CAC payback and win rate by segment is pointless if 20% of your outreach bounces. Prospeo's 5-step verification drops bounce rates below 4%, and CRM enrichment returns 50+ data points per contact at a 92% match rate.
Clean data turns every RevOps metric from a report into a result.
FAQ
How many RevOps KPIs should I track?
15-20 total, segmented by audience: 5 for reps daily, 10 for managers weekly, 7 for executives monthly. If a metric doesn't trigger a specific action when it moves, cut it.
What's the most underrated RevOps metric?
Forecast accuracy. Only 22% of RevOps leaders believe they have the right data to forecast accurately, yet it's the metric the board cares about most. Target 85% or higher; best-in-class teams hit 90-95%.
How does data quality affect revenue operations KPIs?
Every metric downstream of your CRM is only as accurate as the data feeding it. Stale contact records mean pipeline velocity, CAC, and conversion rates are all wrong. Tools like Prospeo refresh records on a 7-day cycle - that's the baseline for trustworthy reporting.