Sales Forecast Techniques That Actually Work (2026)
It's the last week of the quarter. Your VP of Sales submitted a $2.1M commit number. You closed $1.4M. The board meeting is awkward, the CFO is asking pointed questions, and everyone's pretending the miss was "market conditions."
An XANT Labs study analyzing 270,912 closed-won opportunities representing $18.1B in revenue found that 47% of 90-day forecasts missed by more than half. The average prediction was off by 31%+. Only 28.1% landed within 5% of actual. Fewer than 50% of sales leaders even have high confidence in their own forecasts. The problem isn't that teams lack sales forecast techniques - it's that they pick the wrong one, never measure accuracy, and build on data that's already rotting.
The Quick Version
- Pick one method using the decision framework below. Weighted pipeline is the right starting point for 90% of B2B teams. You don't need twelve methods - you need one good one, calibrated quarterly.
- Measure accuracy with WAPE, not gut feel. If you can't quantify how wrong your forecasts are, you can't improve them.
- Fix your data before buying a forecasting tool. No platform can compensate for a CRM full of stale contacts and phantom opportunities.
Accuracy Benchmarks by Method
Everyone tells you which methods exist. Almost nobody tells you how accurate each one actually is.
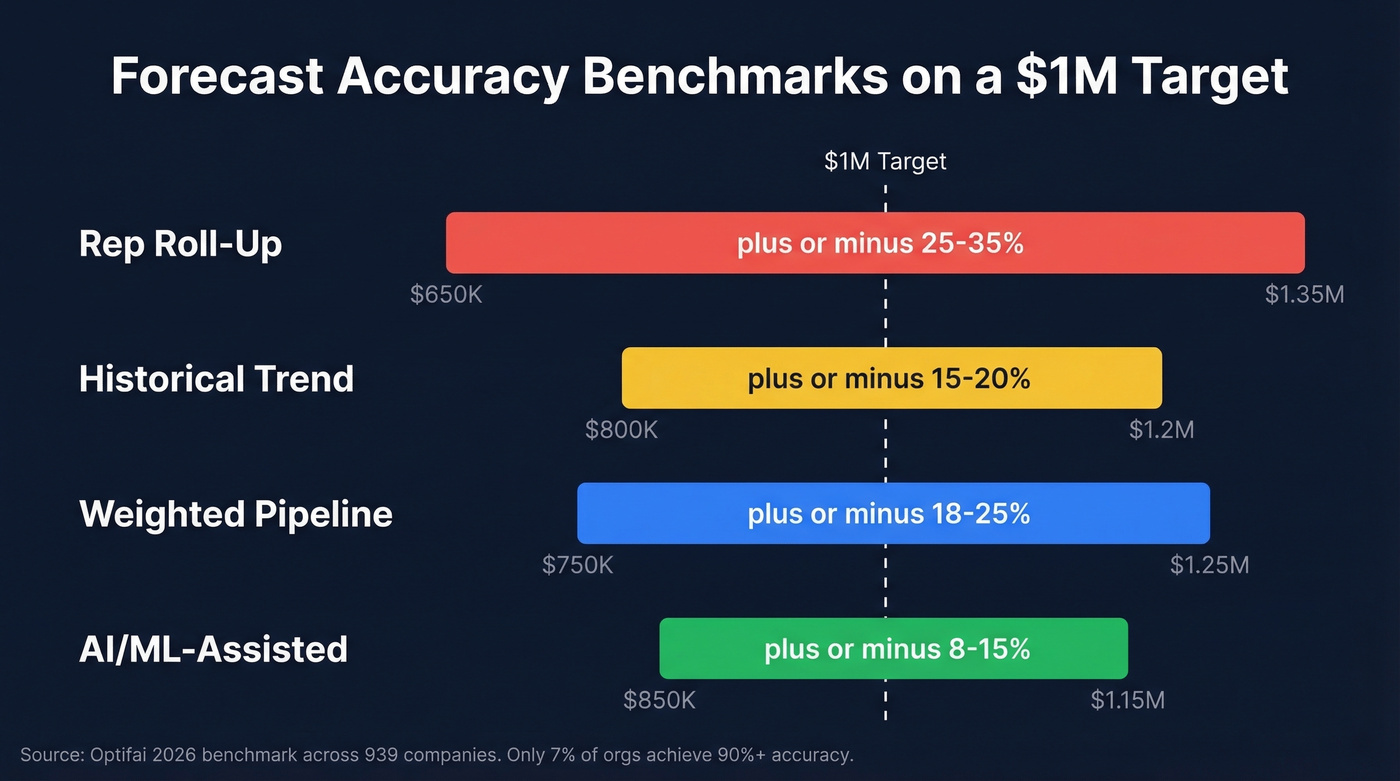
A 2026 Optifai benchmark study across 939 companies measured variance ranges across four common forecasting approaches:
| Method | Typical Variance | What That Means on a $1M Forecast |
|---|---|---|
| Rep Roll-Up | ±25-35% | You could land $650K-$1.35M |
| Historical Trend | ±15-20% | $800K-$1.2M range |
| Weighted Pipeline | ±18-25% | $750K-$1.25M range |
| AI/ML-Assisted | ±8-15% | $850K-$1.15M range |
Only 7% of sales organizations achieve 90%+ forecast accuracy, per Gartner. The median B2B team lands somewhere in the 70-79% range.
Accuracy decays with time horizon. At 30 days out, forecasts run 85-90% accurate. At 60 days, that drops to 75-80%. By 90 days, you're at 65-75% - roughly a 5-8% decay per month. Shorter forecast windows dramatically outperform quarterly commits.
A single accuracy percentage is also misleading without context. A 75% accuracy rate can be excellent or terrible depending on your deal mix, ACV distribution, and market volatility. Segment your benchmarks by deal type, region, and cycle length. The aggregate number masks where your forecast actually breaks.
9 Forecasting Methods, Ranked
1. Intuitive / Rep Roll-Up
Let's start with the biggest weakness: variance runs ±25-35%, the widest of any method. Every rep submits their number, the manager rolls it up, the VP adds a haircut. It's context-rich - reps know things no CRM field captures - but optimistic reps inflate, sandbaggers deflate, and the errors compound rather than cancel.
2. Historical Trend Analysis
Take last year's number, apply a growth rate, call it a forecast. Simple, fast, useful as a sanity check. It breaks completely when market conditions shift - a new competitor, a pricing change, a macro downturn. If your business looks roughly like last year's, this works. If anything meaningful changed, it doesn't. It's a decent baseline, just never rely on it alone.
3. Moving Average
Smooth out monthly noise by averaging the last 3, 6, or 12 periods. Useful for spotting underlying trends in volatile revenue streams, but moving averages lag behind real trend changes. By the time the average catches a downturn, you're already in it.
4. Exponential Smoothing
A smarter cousin of the moving average that weights recent data more heavily. Better for trending markets because it reacts faster to shifts. If your market is accelerating or decelerating, exponential smoothing captures the curve better than a flat average - though it's still a lagging indicator.
5. Weighted Pipeline (Start Here)
This is the method we recommend for most B2B teams, and it's the one we'd bet on for any team with 12+ months of CRM data. Assign a close probability to each deal stage, multiply by deal value, and sum. Here's a worked example with practical stage weights:
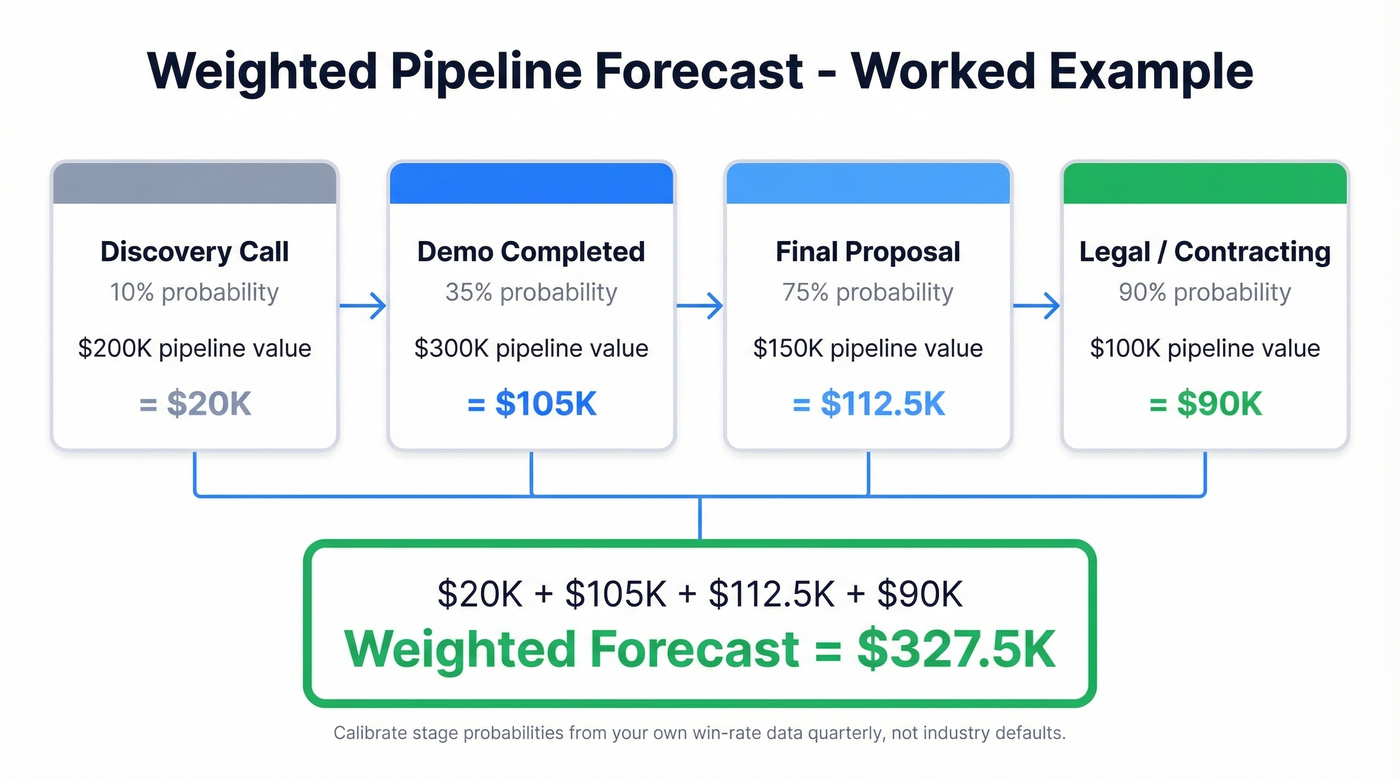
- Discovery call: 10%
- Demo completed: 35%
- Final proposal: 75%
- Legal/contracting: 90%
A pipeline with $200K in Discovery, $300K in Demo, $150K in Proposal, and $100K in Legal yields: ($200K x 0.10) + ($300K x 0.35) + ($150K x 0.75) + ($100K x 0.90) = $20K + $105K + $112.5K + $90K = $327.5K.
The critical requirement: your stage probabilities must come from your own historical win-rate data. Calibrate them quarterly. In SalesOps discussions on Reddit, analysts often default to weighted pipeline even when they doubt its reliability - which tells you it's the pragmatic choice, but only if you calibrate it with real numbers instead of guessing.
6. Sales Cycle Length
Imagine two deals, both at the proposal stage. One has been in pipeline for 30 days. The other, 90 days. Same stage, wildly different odds.
Outreach's analysis found that deals closed within 50 days have a 47% win rate versus 20% or lower after 50 days. Layer this as a secondary signal on top of weighted pipeline - it catches the "zombie deals" that inflate your forecast without ever actually closing.
7. Regression Analysis
Skip this entirely if you have less than 2 years of clean CRM data. You'll build a model on noise and call it insight. Regression correlates a single variable to outcomes: number of stakeholders engaged, time-to-first-meeting, or deal size. When you have the data, it reveals which variable actually predicts close rates.
8. Multivariate Regression
Layer multiple signals - stakeholder count, engagement frequency, seniority of contacts, content consumption. One pattern from RevPartners: when a VP is involved in the second meeting, close rates hit 80%. Without VP involvement, they drop to 20%. Powerful, but you need data science capacity to build and maintain these models.
9. AI/ML-Assisted Forecasting
Ingests signals humans miss - email sentiment, meeting cadence changes, CRM field update patterns - and produces the tightest variance at ±8-15%. But here's the thing: AI forecasting is overhyped in 2026. It amplifies your data quality. Good data in, great forecasts out. Garbage in, confident garbage out.
Gartner predicts that by 2028, AI agents will outnumber human sellers 10x - yet fewer than 40% of sellers will report improved productivity. The gap between AI's potential and real-world impact is enormous, mostly because the underlying data isn't ready. And 66% of sales orgs still forecast in spreadsheets, which tells you where most teams actually sit on the maturity curve.
Weighted pipeline forecasting only works when every contact in your CRM is real. Stale emails and wrong phone numbers create phantom opportunities that inflate your commit number. Prospeo refreshes 300M+ profiles every 7 days with 98% email accuracy - so your pipeline reflects actual buyers, not dead leads.
Stop forecasting on ghost data. Start with contacts that actually connect.
How to Pick the Right Method
Data maturity is the primary branching variable. Not team size, not budget - how clean and deep your CRM data is. If your CRM data is a mess, no forecasting method will save you.
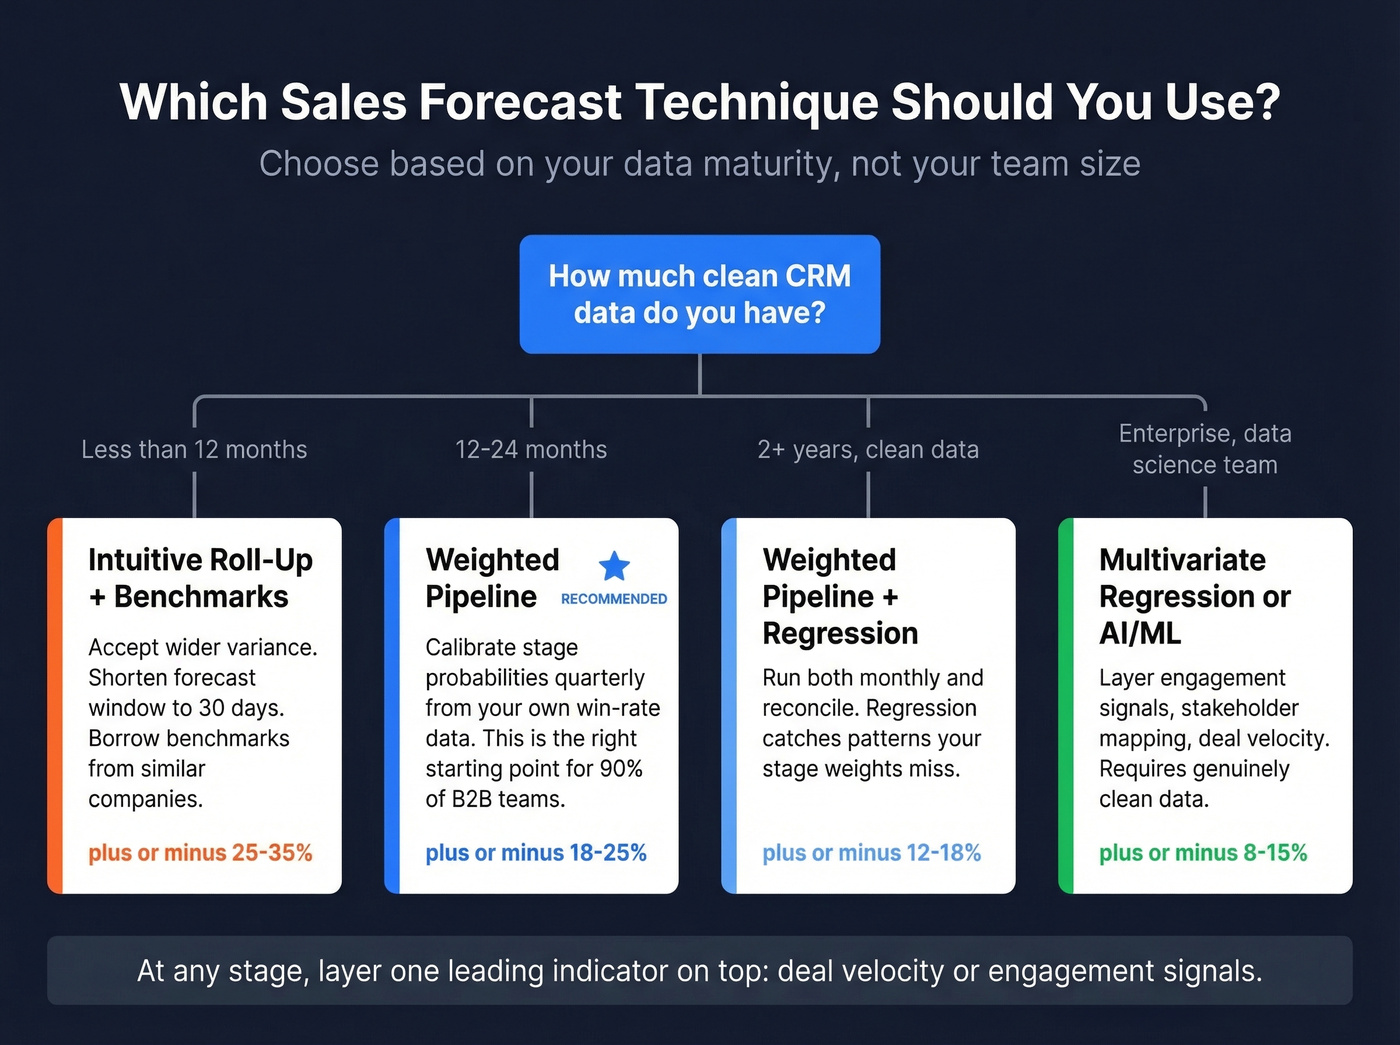
Less than 12 months of CRM data: Intuitive roll-up combined with historical benchmarks from similar companies. You don't have enough data for anything statistical. Accept wider variance and shorten your forecast horizon to 30 days.
12-24 months, basic CRM hygiene: Weighted pipeline. Calibrate your stage probabilities from your own win-rate data quarterly. This single method, properly maintained, gets most B2B teams to ±18-25% accuracy.
2+ years, clean multi-field data: Weighted pipeline plus regression analysis. Run both monthly and reconcile. The regression catches patterns your stage weights miss.
Enterprise, complex deals, data science capacity: Multivariate regression or AI/ML. Layer in engagement signals, stakeholder mapping, and deal velocity. Expect ±8-15% variance if your data is genuinely clean.
For any team at any stage, layer one leading indicator on top of your primary method. Deal velocity - are deals moving faster or slower through stages? - or engagement signals like champions going quiet catch forecast drift before the numbers do.
In our experience, teams that try to run three methods simultaneously end up doing none of them well. Pick one. Calibrate it. Trust it until the data tells you to upgrade.
Measuring Forecast Accuracy
Most teams measure forecast accuracy with MAPE (Mean Absolute Percentage Error). It's the wrong metric. MAPE divides each error by the actual value, which means a $5K deal that misses by $3K weighs the same as a $500K deal that misses by $50K. Small-denominator deals distort the whole picture.
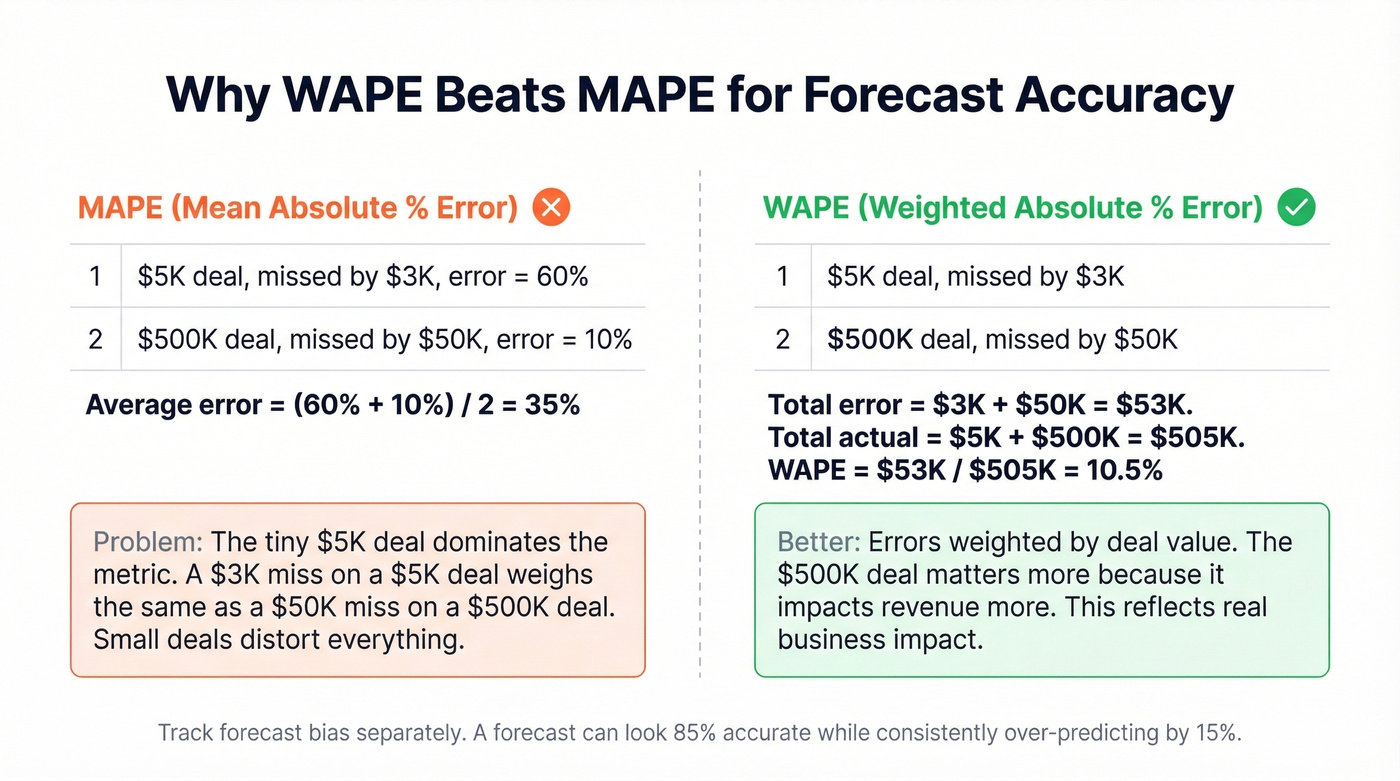
Use WAPE (Weighted Absolute Percentage Error) instead. WAPE weights errors by deal value, so a $500K miss matters more than a $5K miss. It's the metric that actually reflects revenue impact.
Track forecast bias separately. A forecast can look 85% accurate on average while consistently over-predicting by 15%. That's not an accuracy problem - it's a bias problem, and it causes different operational damage: over-hiring, over-investing in capacity that won't be utilized, and board expectations you can't meet.
One more reality check: moving from 60% to 80% accuracy is transformative for planning. Moving from 85% to 90% is expensive and may not be worth it. Know where you are on that curve before investing in more sophisticated methods.
Why Forecasts Fail
Reps batch-update CRM on Fridays. Require stage changes within 24 hours of the qualifying event. If the update cadence is weekly, your forecast is always stale.
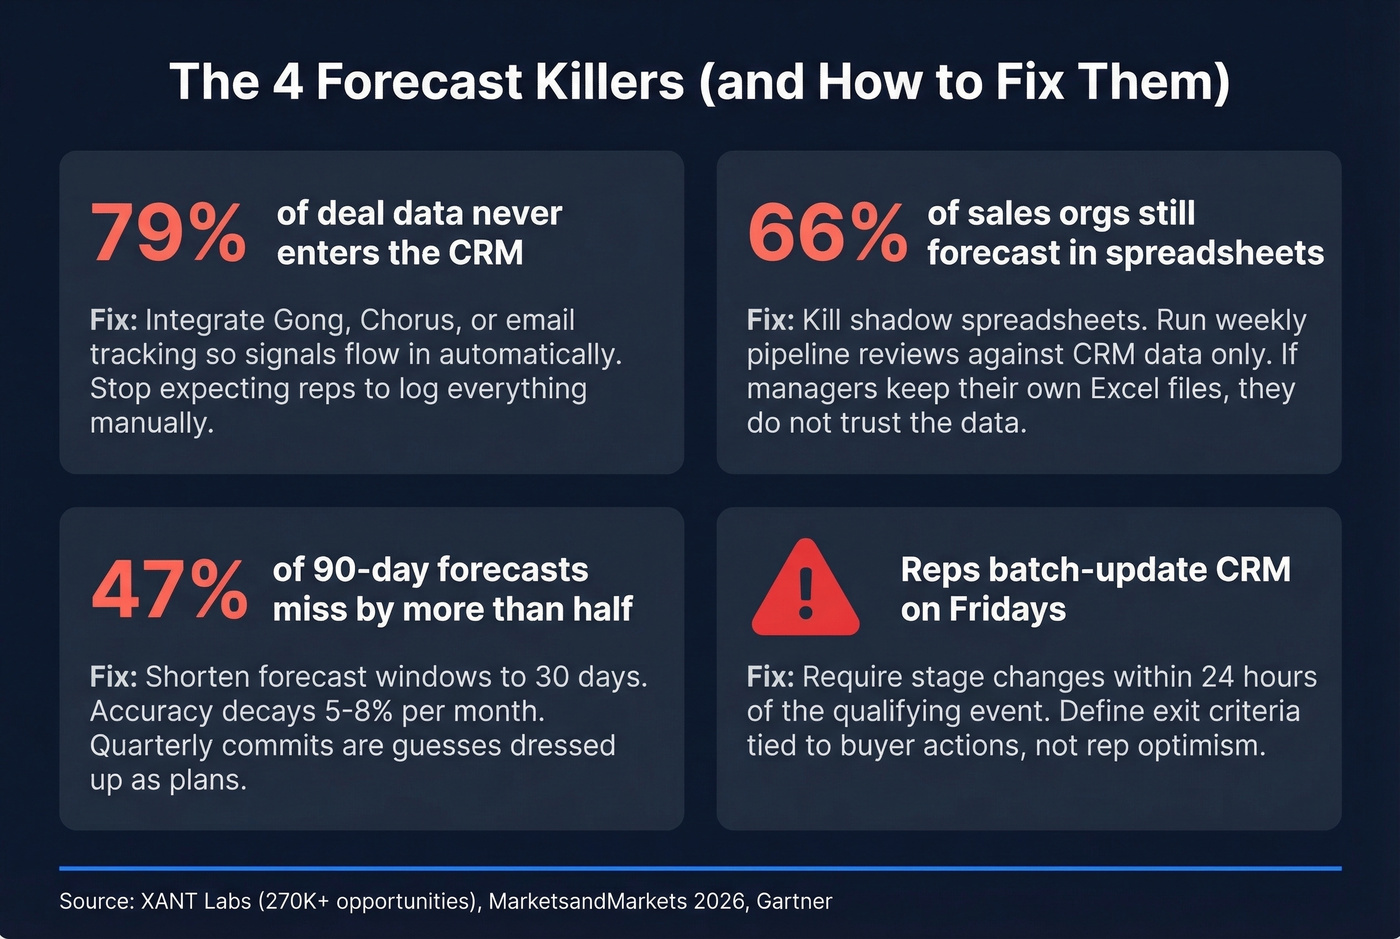
Stage changes based on optimism, not buyer behavior. Define exit criteria tied to buyer actions - signed NDA, technical evaluation scheduled, budget confirmed. A deal isn't in "Proposal" because the rep feels good about it.
Shadow spreadsheets everywhere. We've seen this pattern repeatedly: sales leaders discuss using Salesforce plus Gong but still revert to spreadsheets for weekly submissions. When managers maintain their own Excel files alongside the CRM, they don't trust the data. Solve the trust problem by enforcing data hygiene, running weekly pipeline reviews against CRM data only, and killing the spreadsheets.
79% of deal-related data never enters the CRM. Integrate conversation intelligence platforms like Gong or Chorus and email activity tracking so signals flow in automatically. Reps won't log everything manually - stop expecting them to.
Stale contact data inflating pipeline values. B2B contact data decays at roughly 2.1% per month. Within a year, up to 70% of a database becomes unreliable. Your weighted pipeline shows $800K, but if 30% of the contact data is stale - wrong emails, wrong titles, people who left months ago - your forecast is really $560K. Run your contact database through a verification tool like Prospeo on a regular cadence so your weighted pipeline reflects current reality, not last quarter's org chart.

Forecasting Tools and Costs
| Tool | Forecasting Tier | Approx. Cost |
|---|---|---|
| HubSpot | Built-in (free-Pro) | Free-~$100/user/mo |
| Salesforce | Built-in + Einstein | ~$25-$330/user/mo |
| Pipedrive | Built-in (Growth+) | ~$39/user/mo |
| Clari | Revenue intelligence | ~$50-$200/user/mo |
| Gong Forecast | Revenue intelligence | ~$100-$200/user/mo |
| Anaplan | Enterprise planning | $50K-250K+/yr |
Revenue intelligence platforms often cost $200-400/user/month, yet 66% of sales orgs still forecast in spreadsheets. That tells you the tools aren't the problem. Process and data quality are.
Anaplan is usually overkill for small teams. If you're spending six figures on forecasting software with a 15-person sales team, you've lost the plot. Teams pour money into revenue intelligence and still miss forecasts because the underlying pipeline data was garbage. Fix the inputs before you upgrade the platform.
If you're evaluating platforms, start with a shortlist of sales forecasting solutions and compare against your CRM reality.
The article says it plainly: no forecasting tool compensates for a CRM full of stale contacts. Prospeo's enrichment API returns 50+ data points per contact at a 92% match rate - giving your forecast model real signals like verified emails, direct dials, and current job titles instead of 6-week-old guesses.
Enrich your CRM in bulk for $0.01 per email. Your forecast accuracy depends on it.
FAQ
What are the three main sales forecasting techniques?
The three most widely used approaches are intuitive rep roll-up, historical trend analysis, and weighted pipeline. Rep roll-up relies on subjective judgment from your sales team. Historical trend analysis projects future revenue from past performance. Weighted pipeline assigns close probabilities to each deal stage based on your own win-rate data - it's the best starting point for most B2B teams.
What's the most accurate forecasting method?
AI/ML-assisted forecasting shows the tightest variance at ±8-15%, but it requires 2+ years of clean, multi-field CRM data. Weighted pipeline combined with deal velocity signals consistently outperforms more complex setups that teams can't maintain - and it works with just 12 months of data.
How do you calculate forecast accuracy?
Use WAPE (Weighted Absolute Percentage Error), not MAPE. WAPE weights each error by deal value so a $500K miss counts more than a $5K miss. Track forecast bias separately - consistent over-prediction is a different problem than random variance and requires different fixes.
How does data quality affect forecast accuracy?
B2B contact data decays 2.1% per month - within a year, up to 70% of a database becomes unreliable. Stale contacts inflate pipeline values and corrupt weighted forecasts. Regular data verification on a 7-day refresh cycle keeps the pipeline inputs your sales forecast techniques depend on current and accurate.
How often should you update your sales forecast?
Weekly for 30-day forecasts, biweekly for 60-day. Accuracy decays roughly 5-8% per month, so shorter review cycles catch drift before it compounds. Quarterly-only reviews are why most teams miss by 25%+ - the data goes stale faster than the forecast window.