Sales Growth Rate: How to Calculate, Benchmark, and Improve It
It's Q1 planning season. The CEO pulls up last year's numbers and asks a simple question: "What's our growth rate?" You open a spreadsheet, stare at the columns, and realize you're not sure whether to use gross sales, net sales, or total revenue. The formula itself takes ten seconds. Knowing what the output actually means - and whether it's any good - is where most teams get it wrong.
What Is Sales Growth Rate?
Sales growth rate is the percentage change in sales between two periods. You pick a starting period, pick an ending period, and measure how much sales went up or down. The metric works at any cadence - monthly, quarterly, annually - and it's one of the most-watched numbers in board decks and investor updates.
The tricky part is the word "sales." Per PNC's breakdown, sales refers specifically to income from selling goods and services. Revenue is broader: it includes sales plus other income like investments, royalties, and licensing fees. For most sales teams, the two terms are interchangeable. For your finance team, they're not.
There's also the gross vs. net distinction. Gross sales is the total before returns, discounts, and allowances get subtracted. Net sales is what's left after those deductions. If you're running a sales org, net sales is almost always the number you want. Gross sales can mask churn and discount-heavy deals that look great on paper but erode margin.
The Sales Growth Formula
The core formula is straightforward:
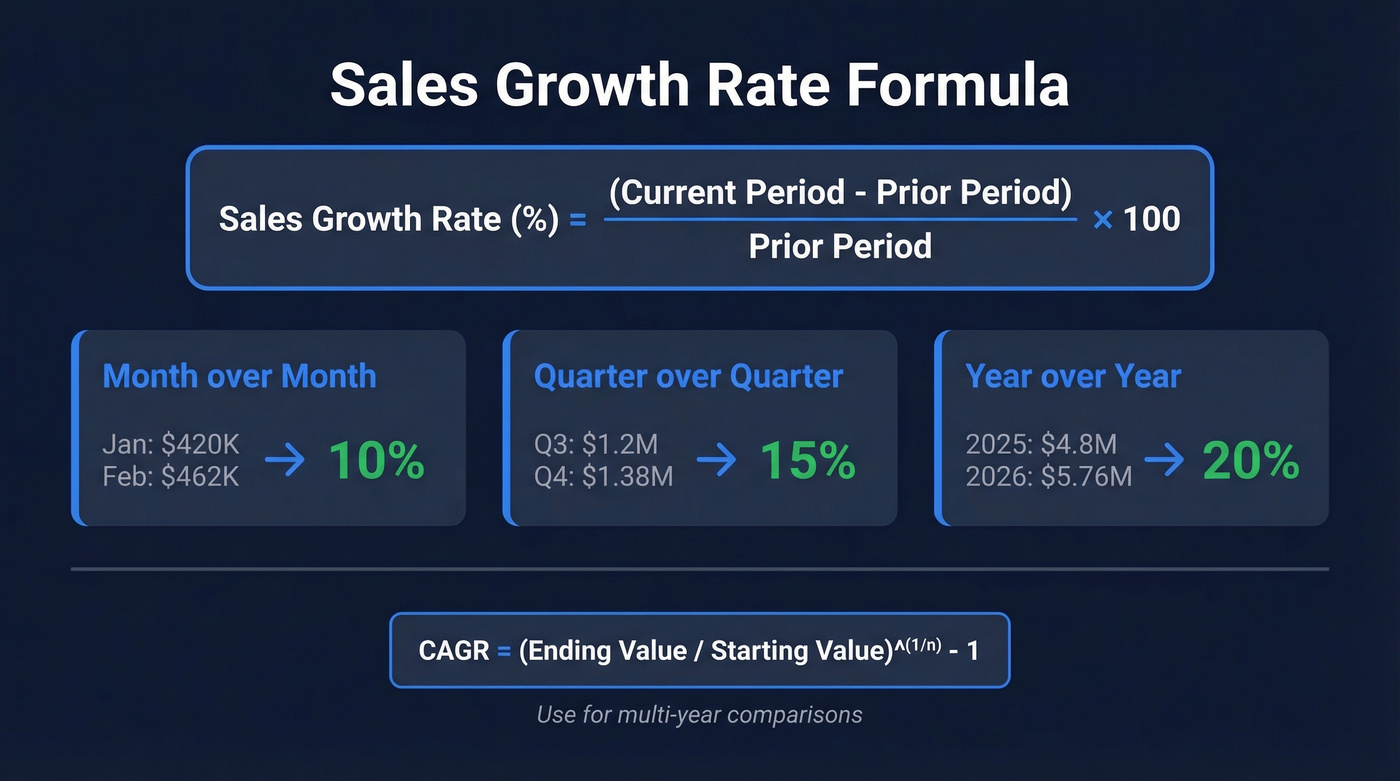
Sales Growth Rate (%) = (Current Period Sales - Prior Period Sales) / Prior Period Sales x 100
Three quick examples with realistic B2B numbers:
- Month-over-month: January sales = $420K, February sales = $462K. Growth = ($462K - $420K) / $420K x 100 = 10%.
- Quarter-over-quarter: Q3 = $1.2M, Q4 = $1.38M. Growth = ($1.38M - $1.2M) / $1.2M x 100 = 15%.
- Year-over-year: 2025 = $4.8M, 2026 = $5.76M. Growth = ($5.76M - $4.8M) / $4.8M x 100 = 20%.
For multi-year comparisons, use CAGR (Compound Annual Growth Rate):
CAGR = (Ending Value / Starting Value)^(1/n) - 1
Where n is the number of years. CAGR smooths out lumpy years and gives you a single annualized rate. If your revenue went from $2M to $5M over four years, CAGR = ($5M / $2M)^(1/4) - 1 = 25.7%. Use simple growth rate for period-to-period tracking. Use CAGR when you're comparing performance across different time horizons or pitching investors.
How to Calculate It in Excel
Three formulas cover 90% of what you'll need.
Simple growth rate: In cell C2, enter =(B2-B1)/B1 where B1 is prior period and B2 is current period. Format as percentage.
CAGR: Enter =(B5/B1)^(1/4)-1 where B5 is the ending value, B1 is the starting value, and 4 is the number of years. Adjust the exponent to match your timeframe.
GROWTH() function for forecasting: =GROWTH(B2:B5, A2:A5, A6:A7, TRUE) takes your known sales values (B2:B5), their corresponding periods (A2:A5), and projects future values for new periods (A6:A7). This gives you a quick exponential trend line without building a full forecast model - think board prep or budget planning, situations where you need a defensible projection in five minutes.
2026 Benchmarks by Company Stage
Every article says "10-25%." That range is so wide it's useless. A bootstrapped SaaS company at $5M ARR and a Fortune 500 retailer have nothing in common. Here's what the numbers actually look like by company type.
SaaS Companies
SaaS companies obsessively benchmark themselves, so the data here is the strongest.
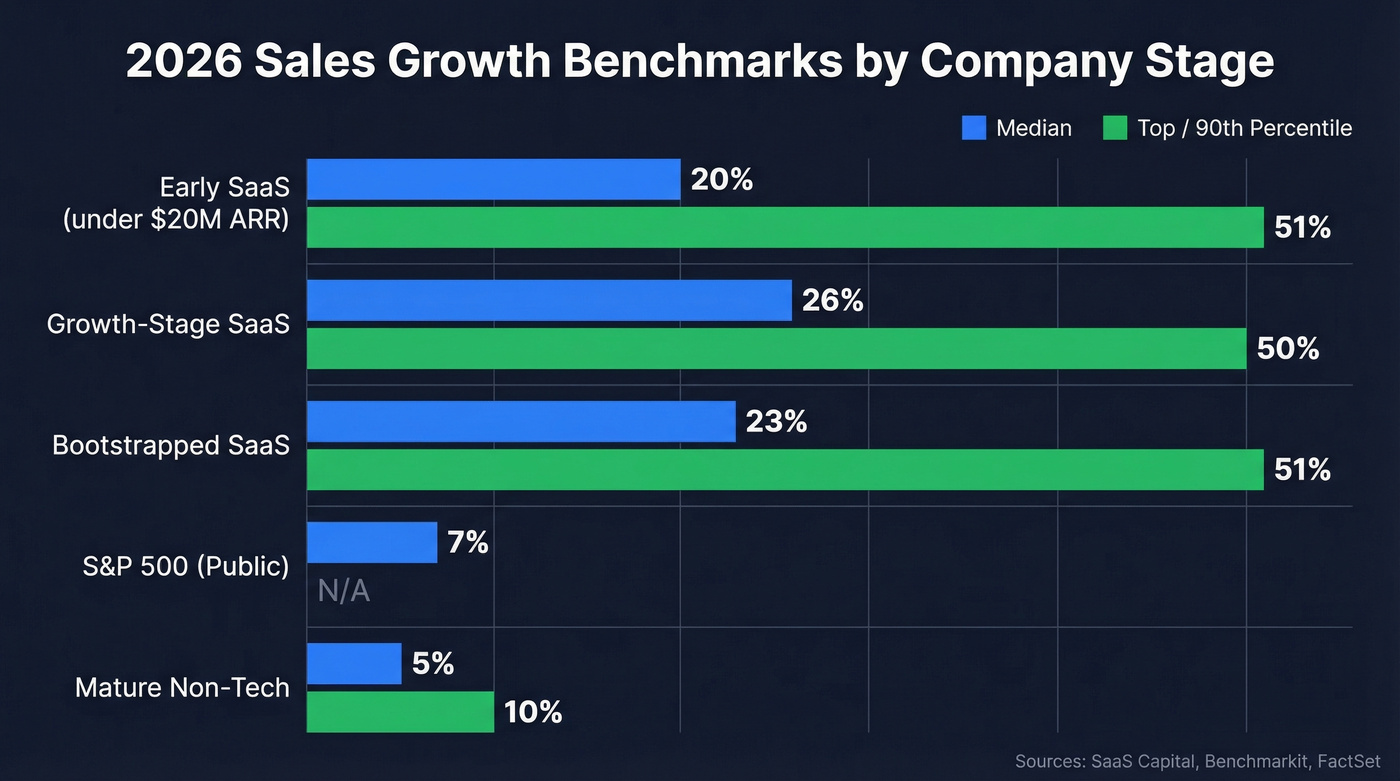
Benchmarkit's 2025 survey - covering 2024 performance - put the median B2B SaaS growth rate at 26%. The top growth quartile declined from 60% in 2023 to 50% in 2024, a meaningful compression that reflects tighter budgets and longer sales cycles across the board. That's not a blip. We've watched this compression play out in our own customer conversations for two years running.
SaaS Capital's 14th annual survey of 1,000+ private B2B SaaS companies shows a median growth rate of 25%, down from 30% the prior year. Equity-backed companies hit 25%; bootstrapped companies came in at 23%. More telling: 6.9% of companies reported flat or negative growth, up from 5.3% the year before.
For bootstrapped SaaS companies in the $3M-$20M ARR range, the median drops to 20% with the 90th percentile at 51%. That 90th percentile number fell from 75% the prior year. If you're bootstrapped and growing 20%, you're right at the median. Above 50%? Elite territory.
For pre-revenue startups, a common heuristic is 5-7% week-over-week growth - a bar that sounds modest until you try sustaining it for six months straight.
Mature and Public Companies
Public company growth rates anchor the other end of the spectrum. FactSet estimates S&P 500 revenue growth at 6.9% for 2025, against a 10-year average of 5.3%. GuruFocus trailing-twelve-month data shows 6.3% YoY, with a long-run annualized rate of 4.26%.
Here's the thing: if you're a mature company growing at 6-7%, you're keeping pace with the S&P 500. That's not exciting, but it isn't bad either. For non-tech industries - manufacturing, retail, logistics - single-digit growth is the norm, and anything above 10% is a strong year.
Benchmark Comparison Table
| Company Type | Median Growth | Top / 90th Pctl | Source |
|---|---|---|---|
| Early SaaS (<$20M ARR) | 20% | 51% (90th) | SaaS Capital |
| Growth-stage SaaS | 25-26% | 50% (top quartile) | Benchmarkit |
| Bootstrapped SaaS | 23% | 51% (90th) | SaaS Capital |
| S&P 500 | ~6-7% | N/A | FactSet / GuruFocus |
| Mature non-tech | 3-6% | 8-12% (est.) | Industry estimates |
Your sales growth rate is only as strong as your pipeline. Teams using Prospeo book 26% more meetings than ZoomInfo users and 35% more than Apollo - because 98% email accuracy means reps spend time selling, not chasing bounces.
Fix the top of your funnel and watch your growth rate follow.
How to Interpret Your Number
A raw growth percentage without context is a vanity metric. Nominal growth without inflation adjustment is the most common version of this trap.
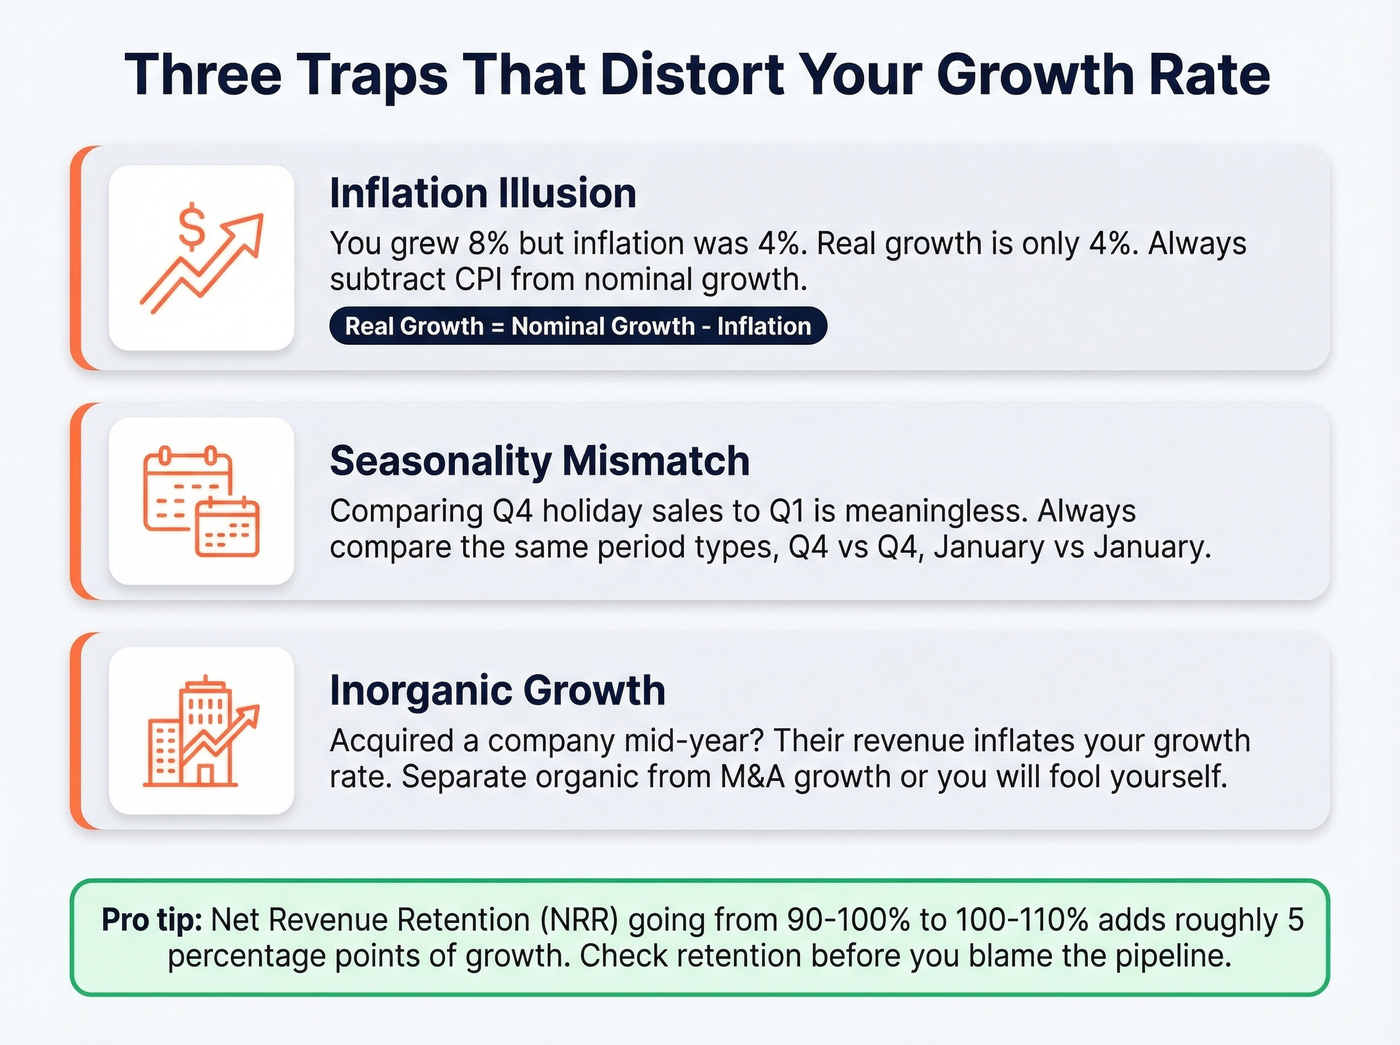
One Reddit user in r/sales compared earnings against an inflation tracker and realized they were barely making more than they did in 2011 after adjusting for CPI. The formula for real growth is simple: real growth ≈ nominal growth - inflation rate. If you grew 8% in a year with 4% inflation, your real growth was closer to 4%. That distinction matters when you're negotiating budgets or comp plans.
Seasonality and inorganic growth are the other two traps. Comparing Q4 against Q1 is meaningless - always compare the same period types. And if you acquired a company mid-year, your growth rate includes their revenue. That's M&A math, not organic sales performance. Separate the two or you'll fool yourself.
Net revenue retention is the hidden driver most teams underestimate. The SaaS Capital dataset shows that moving NRR from 90-100% to 100-110% improves growth by roughly 5 percentage points. Growth is positively and exponentially correlated with NRR. If your growth rate is slipping, check retention before you blame the pipeline.
Common Calculation Mistakes
Growth from a zero baseline. If prior-period sales were zero, the standard formula divides by zero and produces a #DIV/0! error in Excel. There's no meaningful percentage to report. State the absolute dollar increase and label it "new revenue."
Using the wrong metric. Revenue, net sales, EPS, and net income all tell different stories. The recurring confusion on r/ValueInvesting - "which number do I even use?" - reflects a real problem. For sales teams, use net sales. For investors, revenue and EPS answer different questions. Pick one and be consistent.
Comparing non-comparable periods. Different-length periods, pre- vs. post-acquisition numbers, or misaligned fiscal years will produce a growth rate that's technically correct but practically useless. We've seen teams report 40% "growth" that was really just a 5-month period compared against a 3-month one.
Ignoring returns and discounts. Gross sales can look great while net sales tell a different story. If your team is discounting heavily to close deals, gross growth overstates reality. Always track net.
How to Improve Your Growth Rate
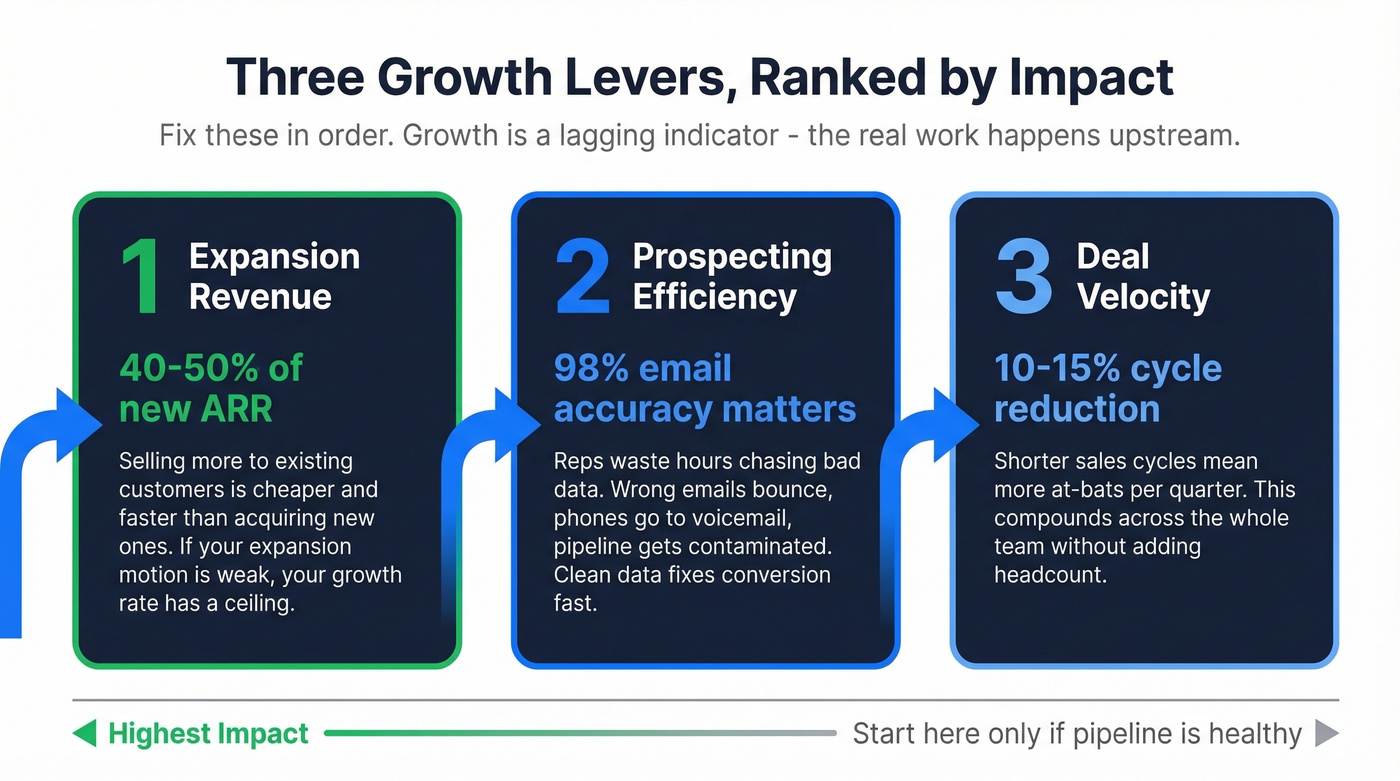
Your sales growth rate is a lagging indicator. Pipeline quality is the leading one. By the time growth drops, the damage often happened 1-3 quarters ago when prospecting slowed down or lead quality degraded.
Let's be honest: most teams trying to fix their growth rate are solving the wrong problem. They add headcount or launch new campaigns when the real issue is that roughly a third of their pipeline contacts have stale data. You can't grow what you can't reach.
Expansion revenue is the most efficient growth lever. Benchmarkit's data shows expansion ARR is 40% of total new ARR across B2B SaaS, and over 50% for companies above $50M. Selling more to existing customers is cheaper and faster than acquiring new ones. If your expansion motion is weak, your growth rate has a ceiling - and no amount of top-of-funnel activity will fix it. (If you need to pressure-test churn and expansion, start with a proper churn analysis.)
Prospecting efficiency is the second lever. Reps waste hours chasing bad contact data: wrong emails bounce, phone numbers go to voicemail, and conversion rates drop. Growth flatlines not because the market dried up, but because the pipeline feeding it was contaminated. We've seen teams clean up their contact data with tools like Prospeo and watch pipeline conversion improve within a single quarter - 98% email accuracy and a 7-day data refresh cycle make a measurable difference when you're running high-volume outbound.
Deal velocity is the third. Shortening your sales cycle by even 10-15% compounds across the team. Faster cycles mean more at-bats per quarter, which directly lifts the number without adding headcount. Skip this lever if your pipeline is already healthy and your bottleneck is clearly top-of-funnel volume - in that case, fix prospecting first.
Benchmarks don't move themselves. Prospeo gives you 300M+ verified profiles with 30+ filters - buyer intent, technographics, headcount growth - so you target accounts ready to buy. Data refreshes every 7 days, not every 6 weeks.
Stop benchmarking and start outperforming - for $0.01 per lead.
Related Metrics to Track
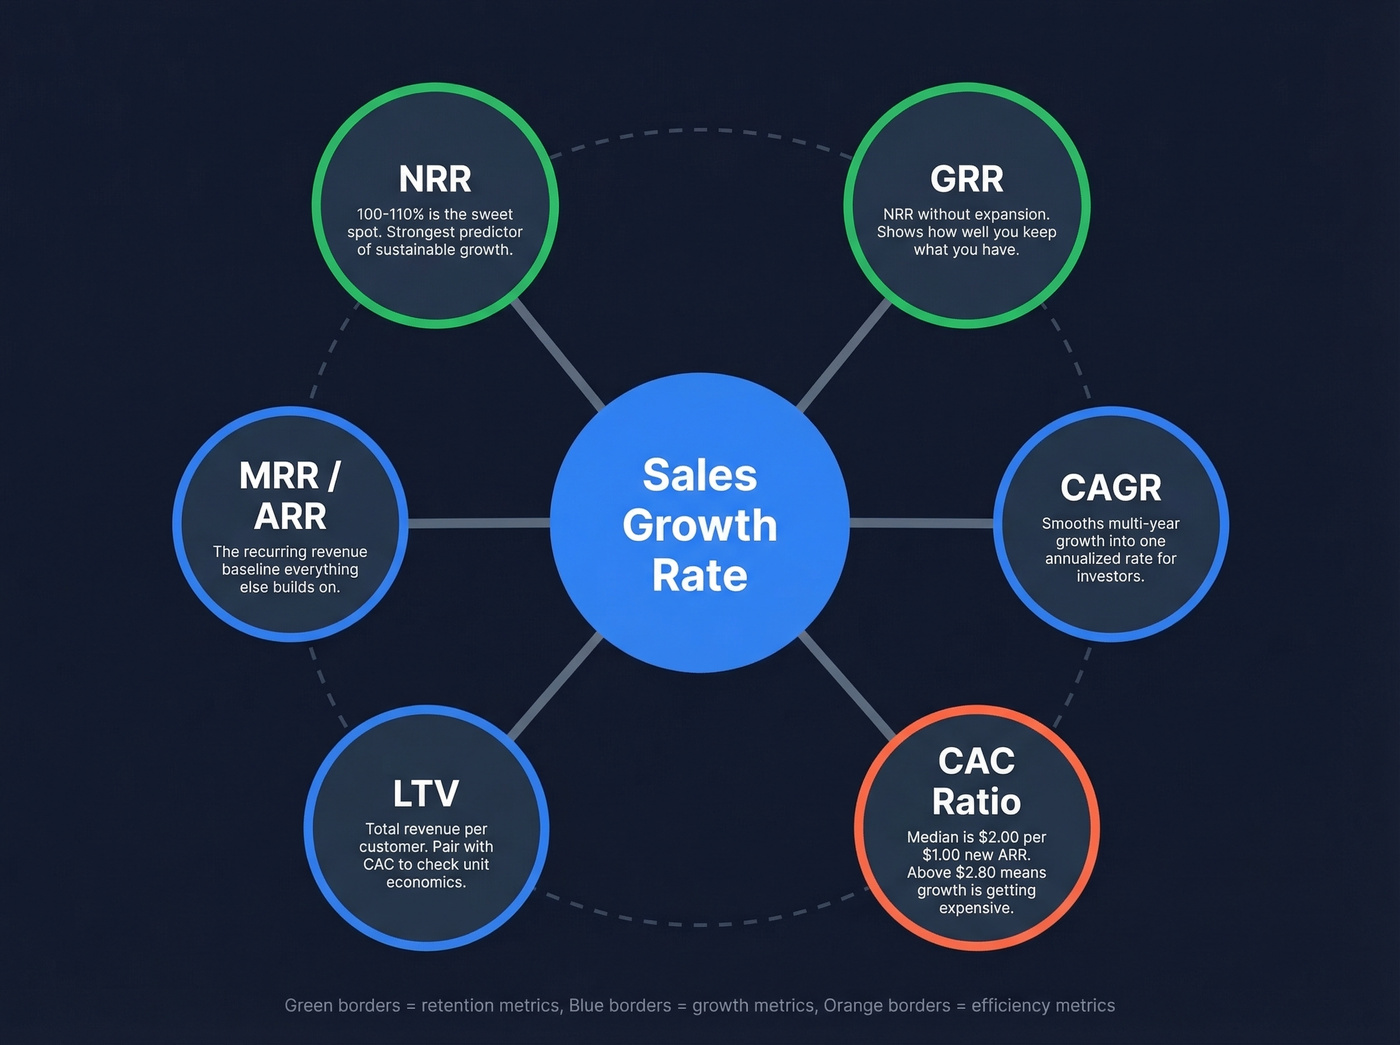
- CAGR - smooths multi-year growth into a single annualized rate for investor conversations.
- NRR (Net Revenue Retention) - measures expansion and churn within existing customers. The strongest predictor of sustainable growth.
- GRR (Gross Revenue Retention) - NRR without expansion. Shows how well you keep what you have.
- CAC Ratio - Benchmarkit puts the median at $2.00 spent per $1.00 of new ARR. If yours is above $2.80, growth is getting expensive.
- LTV (Lifetime Value) - the total revenue a customer generates. Pair with CAC to check unit economics.
- MRR / ARR - the recurring revenue base your growth rate is calculated against.
- Sales Velocity - pipeline value x win rate / sales cycle length. The operational metric that feeds the growth rate. (To diagnose upstream issues, track pipeline health alongside velocity.)
FAQ
What's the difference between sales growth and revenue growth?
Sales growth measures income from selling goods and services. Revenue growth includes all income - sales plus investments, royalties, and licensing fees. For most B2B sales teams the two numbers are interchangeable, but your finance team will distinguish them in reporting.
How do you calculate growth from a zero baseline?
You can't produce a meaningful percentage when dividing by zero. Report the absolute dollar increase instead - "$85K in new revenue," for example - and label it as first-period revenue rather than forcing a growth rate.
How often should you measure this metric?
Monthly for fast-moving SaaS startups, quarterly for most B2B companies, and annually for strategic planning. Always compare the same period types (Q1 vs. Q1, not Q4 vs. Q1) to avoid seasonality distortion.
Can bad contact data actually slow growth?
Yes. Teams using outdated emails and phone numbers see bounce rates above 30%, which tanks deliverability and wastes rep time. Snyk cut bounce rates from 35-40% to under 5% and grew AE-sourced pipeline by 180% after switching to verified data - proof that data quality directly feeds the growth rate.