Sales Incentives: Data-Backed Guide to Plans That Work in 2026
US businesses spend $176 billion on sales incentives every year - nearly double what they spent in 2016. Most of that money is poorly allocated. The plans are too complicated, the metrics are wrong, and nobody stress-tests anything before going live.
Your VP of Sales just asked you to build a sales incentive plan for Q3. Here's the framework, the benchmarks, and the actual math you can defend in the next leadership meeting.
What Are Sales Incentives?
A sales incentive is any reward - monetary or otherwise - designed to motivate specific selling behaviors or outcomes. Commissions are the obvious example, but the category includes SPIFs, tiered bonuses, accelerators, PTO awards, experiences, recognition programs, and career development opportunities.
That $176B annual spend covers everything from base-plus-commission structures at SaaS startups to elaborate channel incentive programs at enterprise manufacturers. And it's not just cash: 92% of companies with revenues above $5M use at least one non-cash incentive. The shift toward blended programs - cash for short-term behavior, non-cash for retention and culture - is the dominant trend right now.
What hasn't changed is the core problem. Most incentive plans reward the wrong things, measure too many things, and get communicated poorly. The result? A sales floor where half the reps can't explain how their own comp works.
What Actually Works (Quick Version)
If you're short on time, here's the cheat sheet:
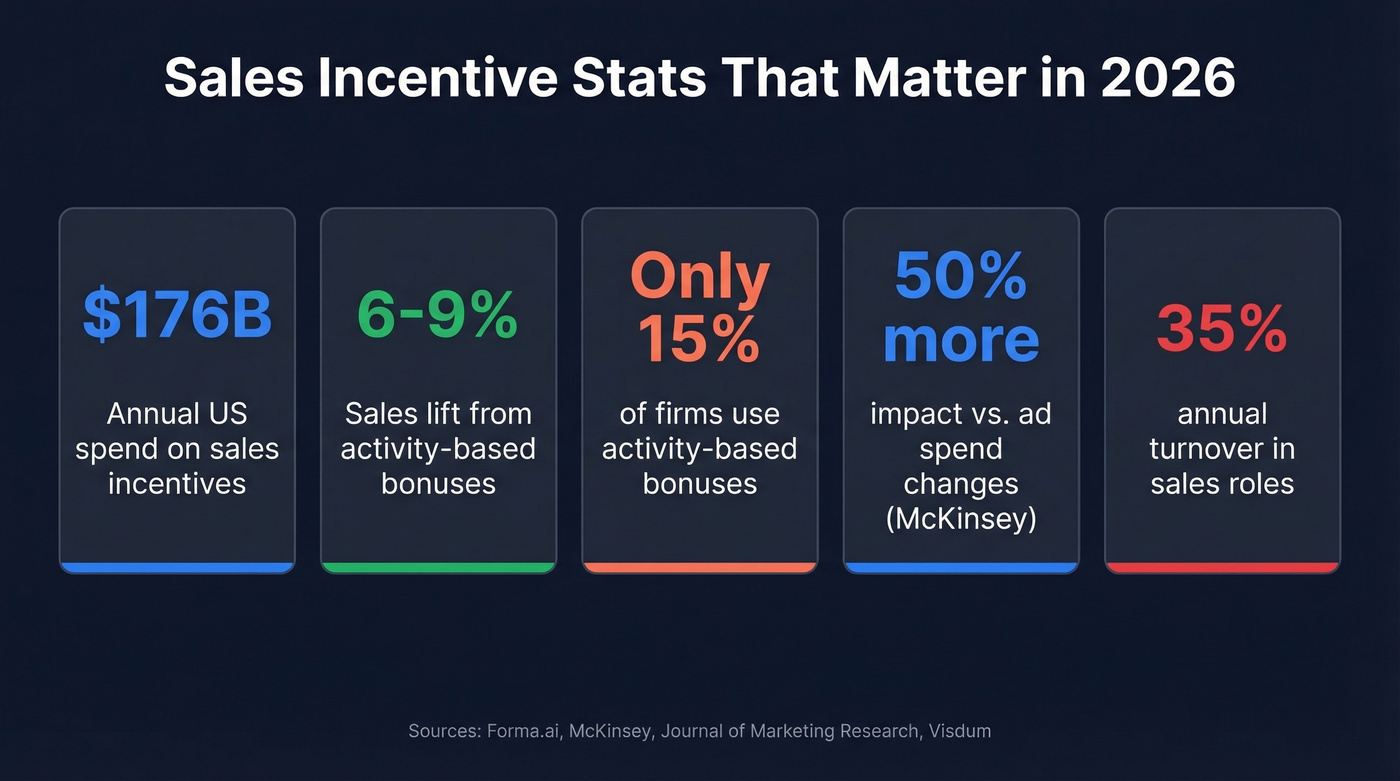
- Activity-based incentives are the most underused lever. A three-year field experiment across 305 territories found they lift sales 6-9%. Paying those bonuses only to supervisors - not reps - produced ~3% higher profits at just 18% of the bonus pool. An American Management Association survey found only 15% of firms use activity bonuses at all.
- Keep plans to 2-4 measures max. Nothing weighted below 20%. If a rep can't calculate their payout with a calculator, motivation evaporates.
- Stress-test against last year's data before launching. Run the proposed plan against actual attainment numbers. See who'd be overpaid, who'd be underpaid, and whether the curve makes sense.
- Measure ROI with a real formula. (Incremental Profit - Program Costs) / Program Costs. We walk through a worked example below.
- Fix your CRM data first. Incentives built on stale records produce unfair territory assignments, wrong quotas, and broken trust.
Why Incentive Plans Matter More Than You Think
Here's the stat that should get your CFO's attention: McKinsey found that smart revisions to compensation models have 50% more impact on sales than changes in advertising investments. Read that again. You could get more lift from redesigning your comp plan than from doubling your ad budget.
The stakes are high because sales teams churn faster than any other function. Turnover in sales roles sits around 35%, compared to 13% across all industries. Bad comp plans accelerate that churn. When top performers feel the plan is unfair - or worse, when they can't understand it - they leave. Replacing a quota-carrying AE costs months of lost productivity and pipeline momentum that you won't recover until the next quarter at the earliest.
We've watched teams spend months building elaborate comp plans with 7+ measures, custom modifiers, and quarterly clawbacks, then wonder why reps ignore the plan and just sell whatever's easiest to close. The best incentive plans aren't complex. They're clear, fair, and tied to behaviors the company actually wants.
Types of Sales Incentives
| Category | Examples | Best For |
|---|---|---|
| Monetary - Variable | Commissions, accelerators | Direct revenue motivation |
| Monetary - Bonus | SPIFs, tiered bonuses, MBOs | Short-term behavior change |
| Non-Monetary - Tangible | Gift cards, experiences, PTO | Retention, culture |
| Non-Monetary - Intangible | Recognition, career growth | Long-term engagement |
Monetary incentives are the backbone - commissions (typically around 10% in SaaS), SPIFs for short-term pushes, tiered bonuses that reward overperformance, and accelerators that kick in above quota. These drive immediate behavior. The risk is over-reliance: too much short-term cash creates a "close anything" culture that tanks retention and customer quality.
Non-monetary incentives are underrated. Randstad's Workmonitor data shows 42% of workers wouldn't accept a job without career progression opportunities, and work-life balance now ranks as highly as pay in worker priorities. A well-designed recognition program can drive an 11.1% increase in average employee performance - comparable to many cash programs at a fraction of the cost.
The smartest teams blend both. Cash for quota attainment, non-cash for the behaviors that don't show up on a leaderboard: mentoring, CRM hygiene, deal quality, knowledge sharing.
One creative example from r/sales worth stealing: a monthly poker game where reps earn cards based on weekly metrics (most contacts, best close rate, highest activity), with prizes like first pick of inbound leads or the ability to hand off a problem client. It cost the company nothing and drove more engagement than the quarterly SPIF.
Activity-Based vs. Outcome-Based Rewards
This is the most underappreciated distinction in incentive design.
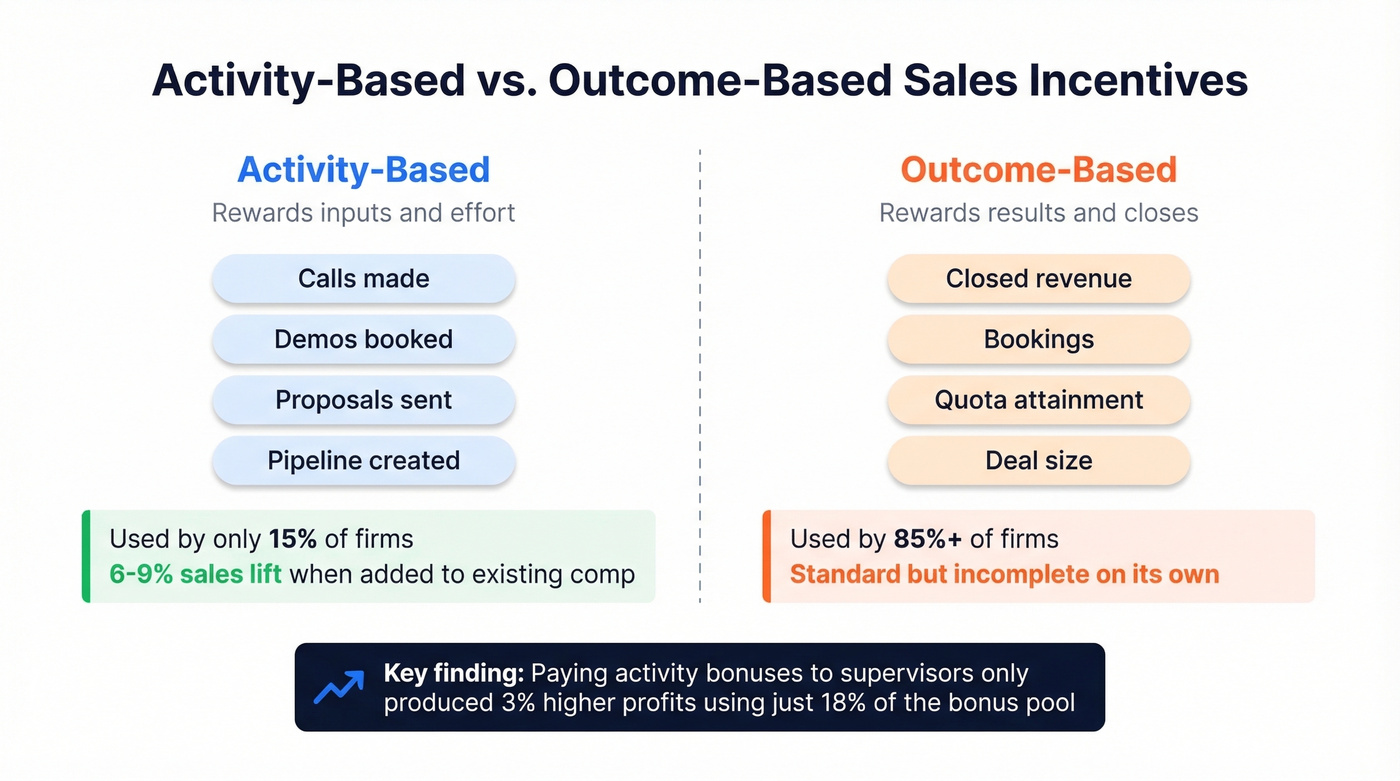
Outcome-based programs reward results - closed deals, revenue, bookings. Activity-based programs reward inputs - calls made, demos booked, proposals sent, pipeline created. Most companies only do the first. That's a mistake.
A three-year field experiment published in the Journal of Marketing Research studied 305 sales territories, 412 salespeople, and 71 supervisors at a large pharmaceutical firm. Adding activity-based bonuses on top of existing outcome-based comp lifted sales 6-9%. Yet only 15% of firms award bonuses for activities.
Here's the counterintuitive finding that should reshape your thinking: paying activity-based incentives only to supervisors - not to individual reps - produced roughly 3% higher profits while using just 18% of the total bonus pool. Supervisors who received activity bonuses drove 7.6% more calls from their teams through increased coaching and monitoring. The mechanism is behavior control: incentivized managers actually manage.
Let's be honest about what this means for most teams. If your average deal size is under $25K and your sales cycle is under 60 days, activity-based incentives for frontline managers will outperform any accelerator redesign you're considering. The ROI math isn't close.
You just read it: bad CRM data breaks incentive plans with unfair territories, wrong quotas, and broken trust. Prospeo refreshes 300M+ profiles every 7 days - not every 6 weeks - so your reps chase real buyers, not dead records. 98% email accuracy means activity metrics actually reflect effort, not data quality.
Clean data turns your incentive spend into pipeline. Start free today.
How to Design a Plan That Works
Match the Plan to the Role
Different roles need different structures. The standard pay-mix ratios are well-established:
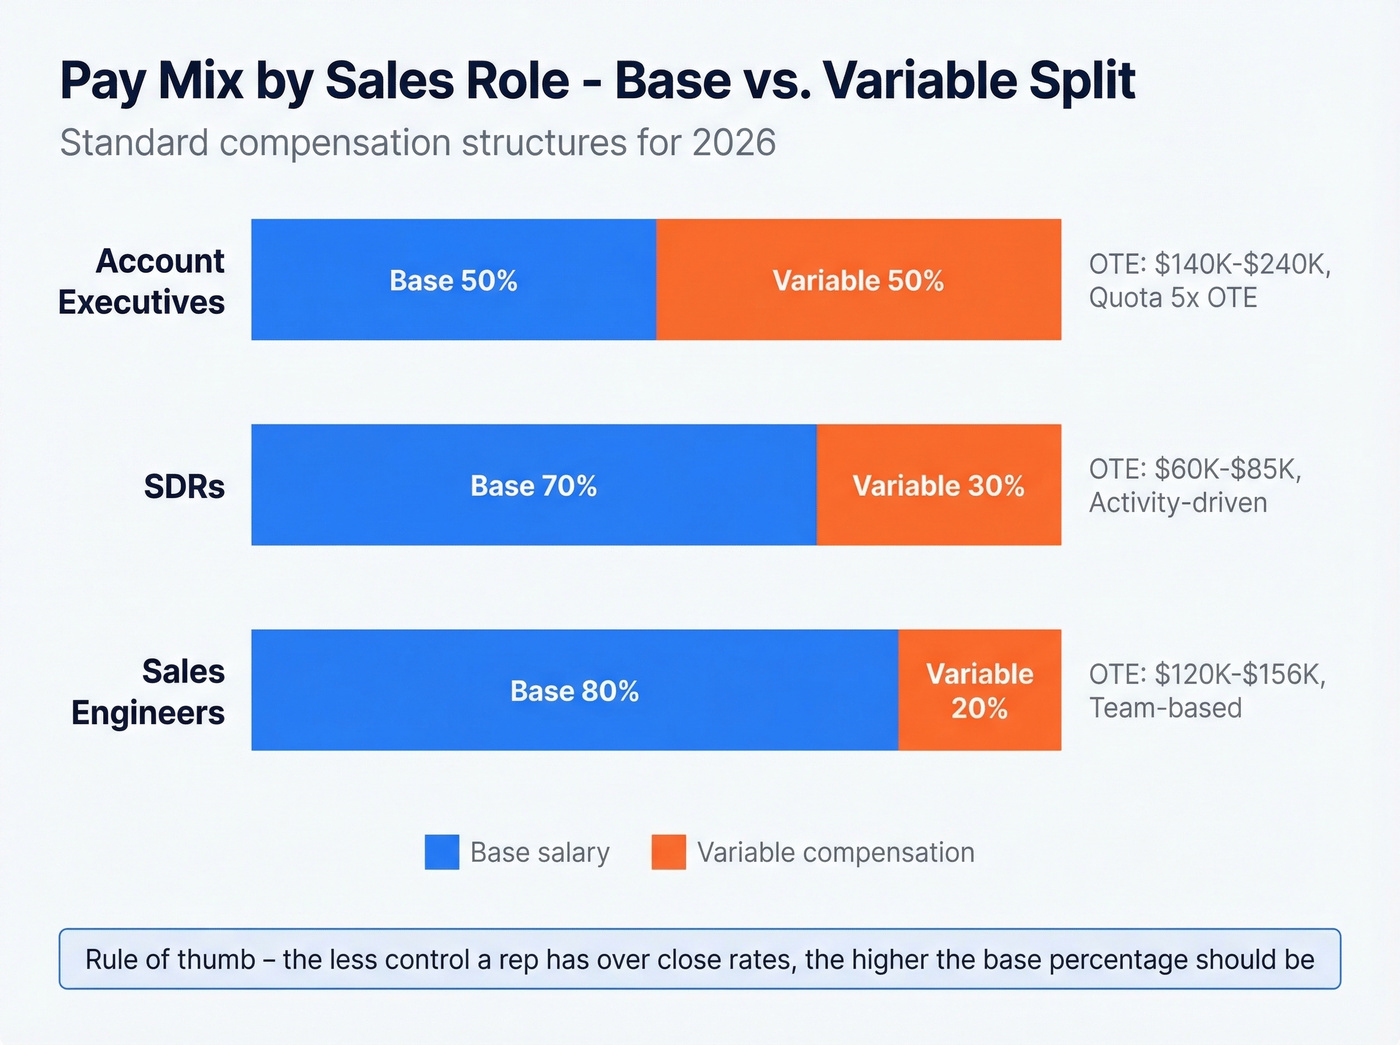
- AEs: 50/50 base-to-variable split. A typical quota-to-OTE ratio is 5x ($120K OTE means a $600K quota).
- SDRs: 70/30 split. Lower variable because they control activity, not close rates.
- Sales Engineers: 80/20 split. Variable tied to team or deal outcomes, not individual quota.
McKinsey's framework adds two building blocks most teams miss. Split incentives credit multiple contributors to a deal - the SDR who sourced it, the AE who closed it, the SE who ran the technical evaluation. Without explicit crediting rules, reps fight over attribution and deals stall. Presales and staged incentives reward interim funnel progress in long sales cycles - pipeline creation, proof-of-concept completion, executive sponsor engagement - so reps stay motivated during 6-12 month enterprise deals instead of sandbagging until close.
Set the Payout Curve
The payout curve determines how much reps earn at different performance levels. Standard benchmarks: 80% performance at threshold pays 50% of target incentive; 120% performance at maximum pays 200% of target incentive. Accelerators should kick in at 10-20% above quota.
If your best rep and your median rep earn similar total comp, your curve is too flat.
One compliance note most guides skip: if annual incentives aren't paid within 45 days after the performance period ends, you risk triggering IRS 409A deferred compensation rules.
Keep It Simple
Two to four measures. Nothing weighted below 20%. That's it.
Only 1 in 3 sales leaders align incentives with organizational goals. Part of the problem is complexity - when nobody understands the plan, nobody can align to it. The calculator test is the best heuristic we know: if a rep can't estimate their payout with a phone calculator in under 60 seconds, the plan is too complicated.
Stress-Test Before Launch
This is the step everyone skips, and it's the most important one.
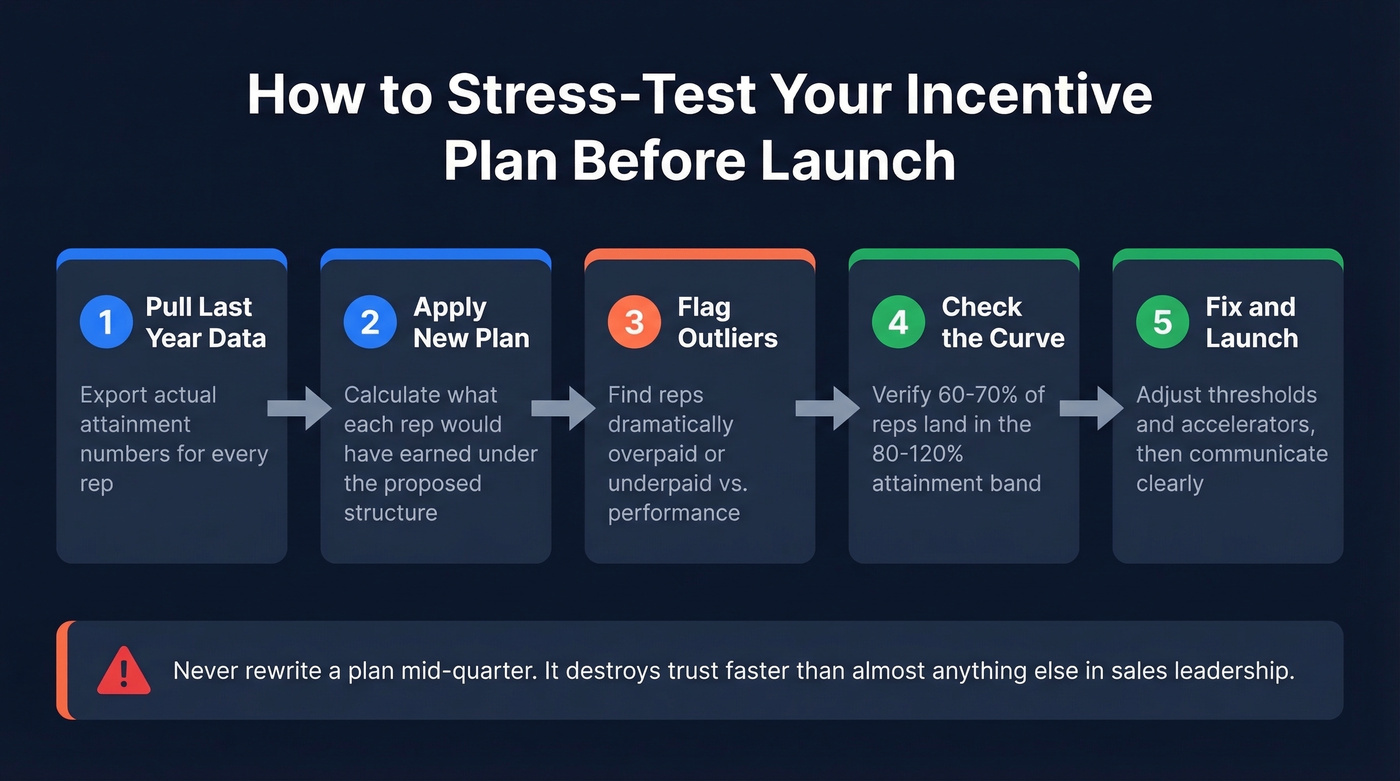
Take your proposed plan and run it against last year's actual attainment data. For every rep, calculate what they would've earned under the new structure. You'll immediately see problems: reps who would've been dramatically overpaid, reps who would've been underpaid despite strong performance, and edge cases where the curve produces bizarre outcomes. Fix these before going live. In our experience, mid-quarter plan rewrites destroy trust faster than almost anything else in sales leadership.
Compensation Benchmarks by Role
| Role | Base Range | Variable % | OTE | Quota:OTE |
|---|---|---|---|---|
| Enterprise AE (SF/NY) | $90K-$120K | 50% | $180K-$240K | 5x |
| Enterprise AE (Mid-market) | $70K-$95K | 50% | $140K-$190K | 5x |
| SDR | $45K-$65K | 25-30% | $60K-$85K | N/A |
| Sales Engineer | $100K-$130K | 20% | $120K-$156K | Team-based |
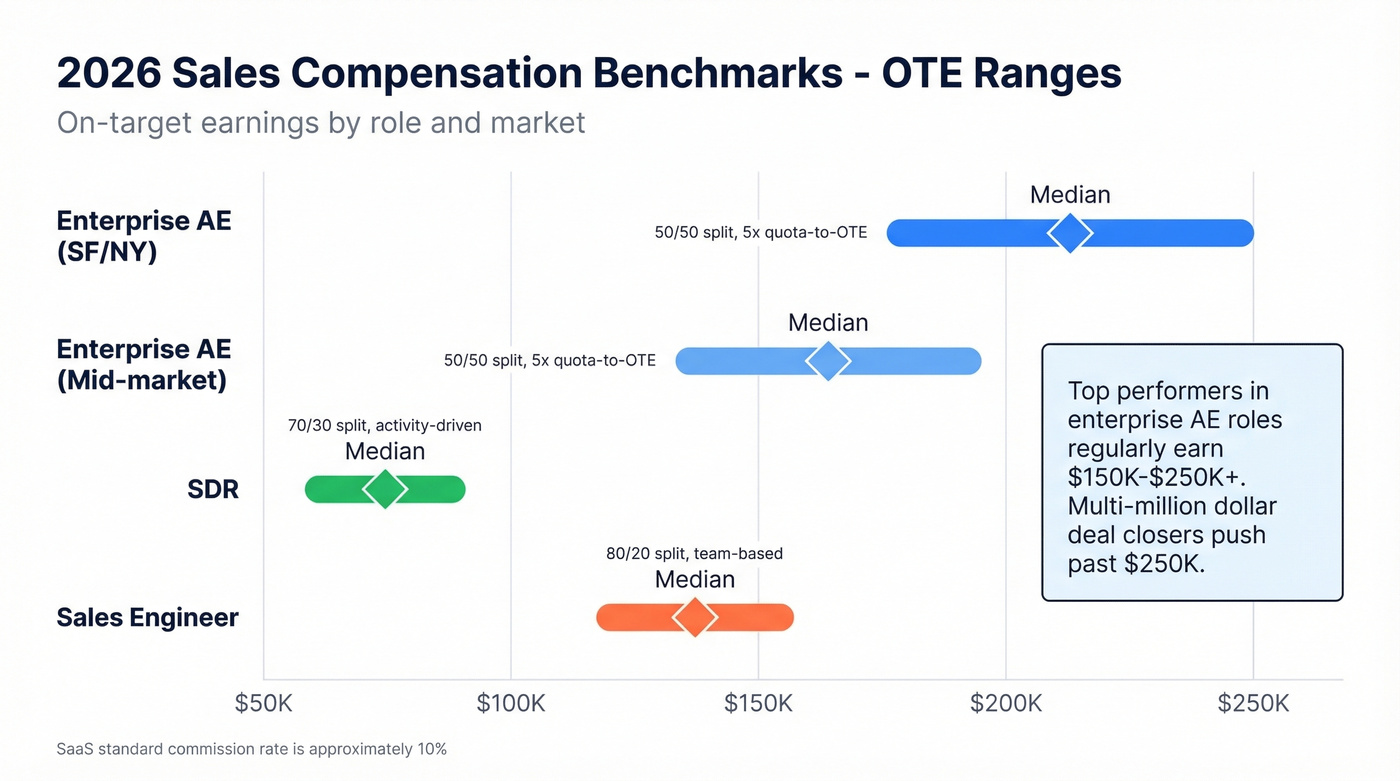
Top performers in enterprise AE roles regularly earn $150K-$250K in total comp. Multi-million-dollar deal closers push past $250K. The SaaS standard commission rate is around 10%, though this varies by deal size, sales cycle length, and whether the rep is hunting new logos or expanding existing accounts.
A healthy attainment distribution has 60-70% of reps landing in the 80-120% band. If fewer than half your team is in that range, your quotas are set wrong - either too aggressive (creating demoralization) or too easy (creating complacency and budget overruns).
7 Mistakes That Kill Incentive Programs
1. One-size-fits-all plans across roles. Your AEs, SDRs, and SEs have fundamentally different jobs. Same plan means perceived unfairness and gaming behavior.
2. Overcomplicated formulas. Five or more components with modifiers and tiers means nobody understands the plan. Trust drops. Motivation follows.
3. No stress-testing on historical data. You launch a plan that looks great in a spreadsheet, then discover it produces unreachable thresholds or runaway payouts.
4. Incentivizing untrusted metrics. If reps don't trust the data behind their payout calculations, every cycle becomes a dispute. CRM data quality is a comp problem, not just an ops problem.
5. Ignoring compliance guardrails. Especially in regulated industries, incentive structures create legal and reputational risk. The 45-day payout window and 409A rules apply broadly.
6. Poor communication. A 15-page PDF emailed once during kickoff isn't a communication strategy. The best plans fit on one page and get reinforced in every 1:1.
7. Milestone prizes that breed animosity. The consensus on r/sales is clear: when only the top 1-2 reps can win a prize, the rest of the team checks out by week three. Tiered rewards where 30-40% of the team can earn something outperform winner-take-all structures every time.
Measures weighted below 10% get ignored entirely. If it's not worth at least 20% of the variable, drop it from the plan.
How to Calculate Incentive ROI
Every incentive guide tells you to "measure ROI." Almost none show you the math.
The formula: (Incremental Profit - Program Costs) / Program Costs
Worked example: You run a $25,000 SPIF to push a new product line. During the SPIF period, the team generates $150,000 in incremental revenue above baseline. Your gross margin is 40%, so that's $60,000 in incremental profit. ROI = ($60,000 - $25,000) / $25,000 = 140% ROI.
Budget the standard 80/20 split - 80% on actual rewards, 20% on administration, tracking, and communication. Manual payout processes carry a 3-8% error rate, which means you're either overpaying or underpaying reps every cycle. For channel or partner incentive programs, the same formula applies: define objectives, calculate total program cost, calculate incremental benefits, then run the ROI math.
Target a minimum 1.5x ROI on any incentive program. Below that, restructure before the next quarter. Strong programs hit 3-5x. If you're consistently below 1.5x, the problem is usually plan design (wrong behaviors incentivized) or data quality (wrong baselines, wrong territory assignments).
The attainment distribution is your health KPI. If 60-70% of reps are in the 80-120% band, the plan is working. If the distribution is bimodal - a cluster at 40% and another at 150% - your territories or quotas are broken, not your incentive structure.
The Data Problem Nobody Talks About
Your incentive plan is only as good as the data underneath it.
Stale CRM records lead to wrong territory assignments. Wrong territory assignments lead to unfair quotas. Unfair quotas lead to broken trust - and once reps stop trusting the plan, no amount of accelerator redesign will fix it. That 3-8% payout error rate? It's almost always a data problem, not a math problem.
Most CRM databases decay at roughly 2% per month. Contacts change jobs, companies get acquired, phone numbers go stale. If your enrichment cycle runs every six weeks - the industry average - you're making comp decisions on data that's already outdated. Prospeo's 7-day data refresh cycle keeps contact records current with 98% email accuracy and a 92% API match rate returning 50+ data points per contact. When your CRM reflects reality instead of last quarter's imports, territory assignments are fair, pipeline numbers are accurate, and quota-setting conversations start from clean data instead of guesswork.
If you're evaluating vendors, start with data enrichment and a clear lead enrichment workflow.
Activity-based incentives lift sales 6-9%, but only if reps have accurate contacts to call. Prospeo delivers 125M+ verified mobile numbers with a 30% pickup rate - so every dial, demo, and outreach your plan rewards is a real conversation, not a voicemail to a disconnected number.
Stop incentivizing activity against stale data. Give reps numbers that connect.
Sales Incentive FAQ
Do sales incentives actually work?
Yes. A three-year field experiment across 305 territories found activity-based incentives lifted sales 6-9%. McKinsey found comp redesigns have 50% more impact on revenue than advertising changes. The key is clear plan design and consistent communication.
How much should I budget for a program?
Plan for an 80/20 split - 80% on rewards, 20% on administration and tracking. Target 1.5x-5x ROI on total program cost. Below 1.5x, restructure before the next quarter rather than throwing more money at a broken design.
Cash vs. non-cash - which drives better results?
Cash drives short-term behavior; non-cash rewards like PTO, experiences, and recognition drive 11.1% performance lifts with better long-term retention. 92% of companies above $5M revenue use at least one non-cash incentive. The strongest programs blend both.
What's the biggest reason incentive plans fail?
Complexity. If reps can't calculate their own payout with a calculator, motivation drops immediately. Keep plans to 2-4 measures, weight nothing below 20%, and communicate the plan on one page.
How do I keep incentive data accurate?
Enrich CRM contact records on a weekly cycle - not the six-week industry average - so territory assignments and pipeline numbers reflect reality. Tools like Prospeo refresh data every 7 days with 98% email accuracy, keeping comp decisions grounded in current information rather than stale imports.