Sales Management KPIs: Fewer Metrics, Real Benchmarks, Clear Actions
69% of B2B sales reps missed quota last year. Not because they weren't working - because their managers were watching the wrong numbers. RepVue's 2026 data showed only 41.2% of software reps hitting quota. Medical device reps? 64.2%. Pharma? 60%. Software is the worst-performing vertical, and it isn't close.
Choosing the right sales management KPIs is the difference between catching problems early and getting blindsided by a missed quarter.
The problem isn't effort. It's signal. Most sales dashboards are graveyards of metrics nobody acts on - 20+ KPIs blinking in your CRM, and the VP still gets surprised when the number comes in short. We've seen this pattern over and over: teams track everything, understand nothing, and course-correct too late.
What follows is fewer metrics, real benchmarks, and a clear action for when each number drops.
The Quick Version
If you manage a B2B sales team and want to skip the theory, track these five core KPIs:
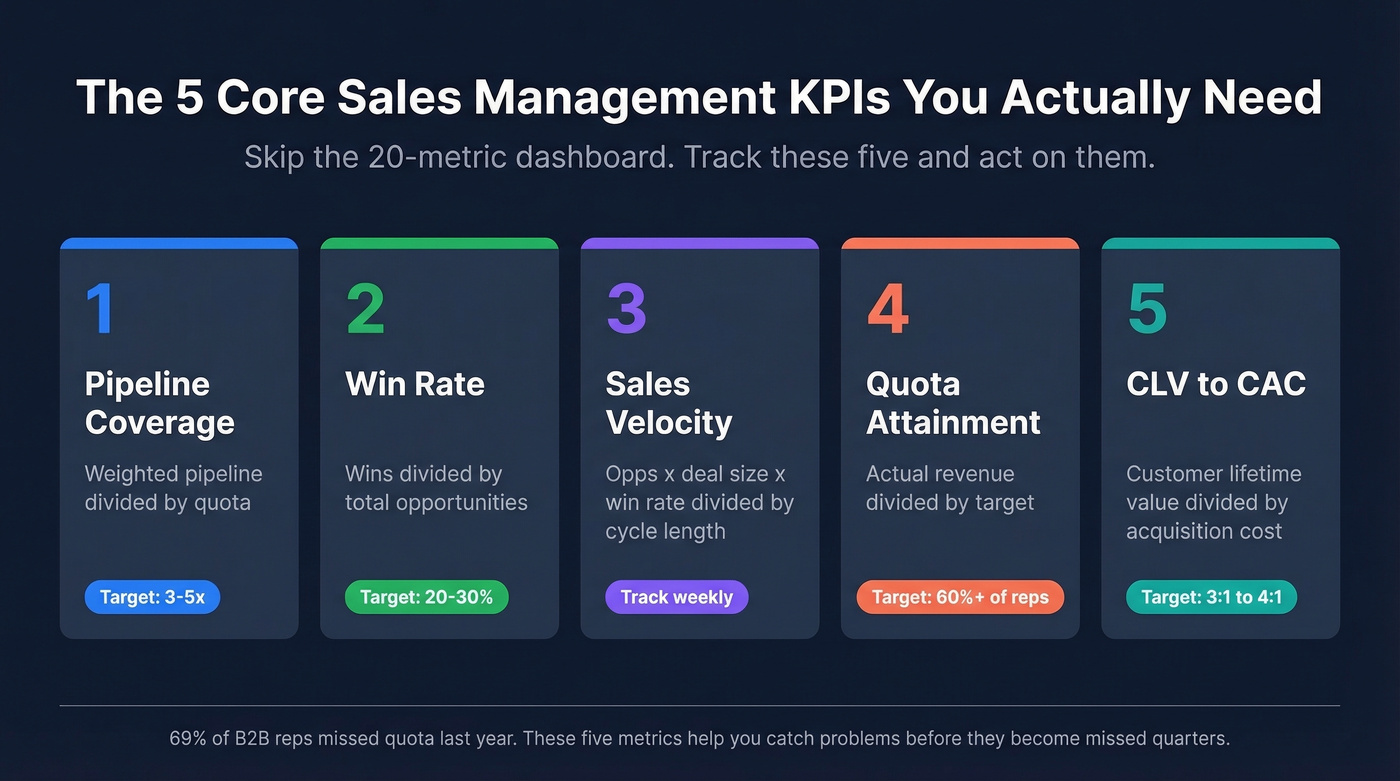
- Pipeline coverage ratio (weighted) - tells you if you have enough real pipeline to hit the number
- Win rate - the single best indicator of sales execution quality
- Sales velocity - combines deal size, win rate, volume, and cycle length into one metric
- Quota attainment - the scoreboard, but only useful alongside leading indicators
- CLV:CAC - keeps you honest about whether the deals you're closing actually make money
If you run SDRs, add three more: qualified conversations per day (15-20), lead response time (under 5 minutes), and meeting-to-opportunity conversion rate (25-40%).
Everything below gives you the benchmarks, formulas, and what to do when these numbers drop.
Leading vs. Lagging Indicators
Every sales management KPI falls into one of two buckets: leading indicators that predict future revenue, and lagging indicators that confirm what already happened. The mistake most managers make is tracking only lagging metrics - revenue, bookings, quota attainment - then wondering why they can't course-correct.
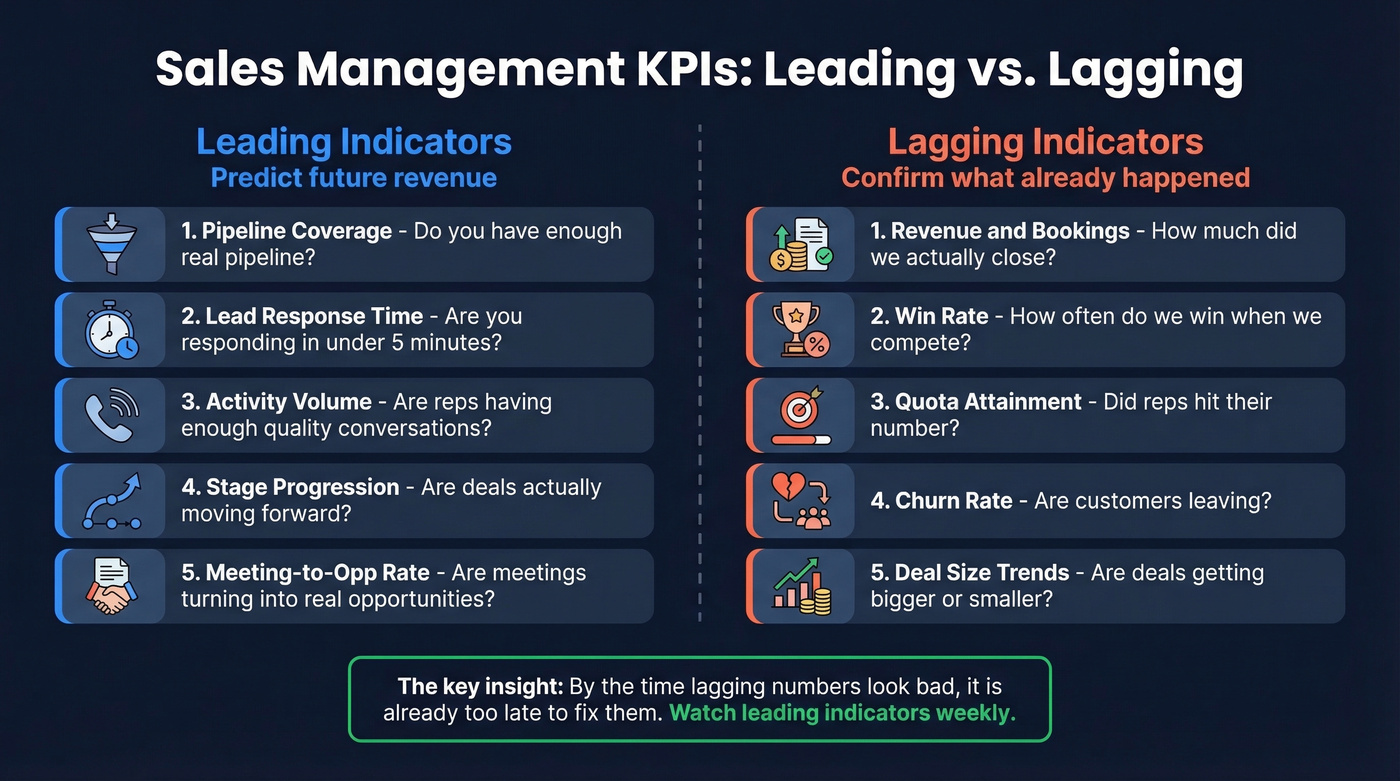
By the time you see a lagging number, it's too late to change the outcome. Reviewing win rates on the last day of the quarter? That's a post-mortem, not management.
| Leading (Predictive) | Lagging (Confirmatory) |
|---|---|
| Pipeline coverage | Revenue / bookings |
| Lead response time | Win rate (near-lagging, but still actionable week-to-week) |
| Activity volume | Quota attainment |
| Opps moving through stages | Churn rate |
| Meeting-to-opp conversion | Deal size trends |
Here's a scenario to make this concrete: last week of Q2, your unweighted pipeline showed 4x coverage. Looked great on the dashboard. But when you weighted it by stage probability, actual coverage was 1.8x - two-thirds of that pipeline was sitting in Discovery with a 10% close rate. The lagging number (revenue) was going to miss, and the leading indicator (weighted coverage) had been screaming about it for six weeks. Nobody was listening.
Leading KPIs That Predict Revenue
Pipeline Coverage Ratio
Pipeline coverage is the ratio of total pipeline value to your sales target: total pipeline / quota = coverage ratio. A 3x ratio means you have $3 in pipeline for every $1 you need to close.
But raw coverage is a vanity metric. You need weighted coverage - multiplying each opportunity's value by its stage probability. Outreach breaks this down by segment: enterprise teams need 3-5x, mid-market 2.5-4x, and high-velocity SMB 2-3x. If your win rate is 25%, you need 4x coverage just to break even.
The catch: high-ICP accounts represent only 23% of total pipeline for many organizations. Even a healthy-looking 4x number can be stuffed with low-fit deals that'll never close. Segment your coverage by ICP fit, not just dollar value.
When this drops: Audit top-of-funnel. Are SDRs generating enough qualified opportunities? Is marketing sending the right leads? Coverage problems are almost always sourcing problems.
Lead Response Time
Under 5 minutes is best-in-class. Under an hour is competitive. Anything longer and you're losing deals to whoever picks up the phone first.
The data is stark: 35-50% of deals go to the first responder, and conversion rates are 8-21x higher when you respond within 5 minutes. This isn't a "nice to have."
When this drops: It's usually a routing problem, not a people problem. Check your lead assignment rules, notification workflows, and whether reps actually see inbound alerts in real time.
Activity Metrics by Role
Activity metrics get a bad reputation because managers use them punitively. Tracked correctly, they're diagnostic gold. SDRs should hit 15-20 qualified conversations per day. AEs should target 8-12, depending on deal complexity and ACV.
The conversion layer matters more than raw volume. Cold outreach converts to meetings at 2-3%. Warm outreach hits 15-20%. Meeting-to-opportunity conversion should land between 25-40%. If your reps are making 50 calls a day but converting meetings to opportunities at 15%, the problem isn't activity - it's qualification. Look at messaging, targeting, and data quality before blaming effort.
Sales Velocity
Sales velocity ties everything together:
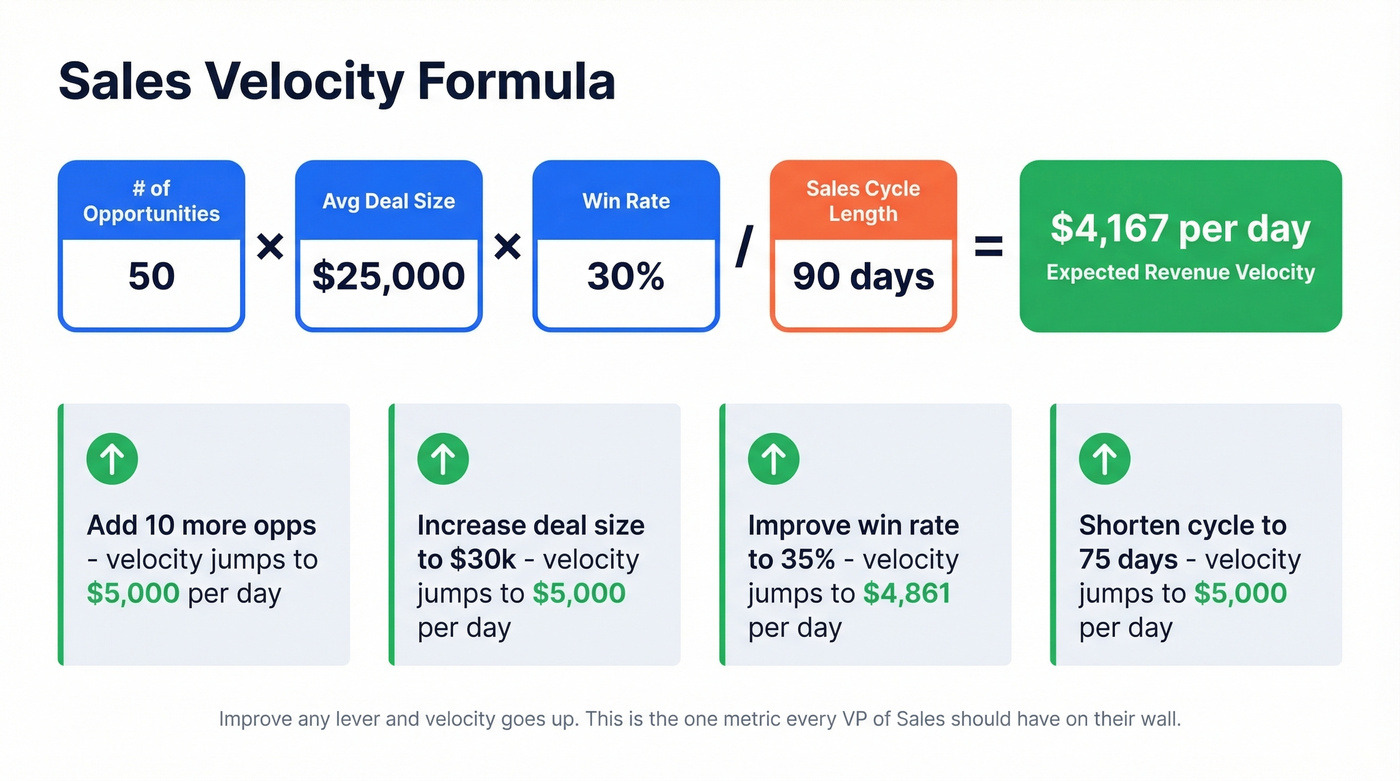
(# of opportunities x average deal size x win rate) / sales cycle length = revenue velocity
A worked example: 50 opportunities x $25,000 average deal x 30% win rate / 90-day cycle = $4,167/day in expected revenue. Improve any of those four levers and velocity goes up. Lengthen the cycle or drop the win rate and it tanks.
This is the metric we'd put on every VP of Sales's wall. It forces you to think about the system, not individual deals. Among the performance indicators sales leaders should measure, velocity is the one that best reveals whether your entire engine is healthy or breaking down.
When this drops: Identify which lever moved. Longer cycles? Deals are stalling in a specific stage. Lower win rate? Qualification or competitive positioning. Smaller deals? You're discounting or losing upmarket opportunities.
Lagging KPIs That Confirm Results
Win Rate
Average B2B win rates run 20-30%. Best-in-class teams hit 35-40%+. Below 20%, you've got a fundamental problem - wrong accounts, weak reps, or a product that doesn't compete.
When this drops: Segment by rep, deal size, and source. A team-wide drop is usually a market or product issue. A single-rep drop is coaching. A drop in one deal-size segment is positioning.
Quota Attainment
The scoreboard metric. And the numbers are brutal: 69% of B2B reps miss quota. In software, only 41.2% hit their number.
Here's the thing: if fewer than half your reps are hitting quota, the quota is the problem, not the reps. Attainment below 40% across a team signals a target-setting issue. Full stop. We've watched leadership teams blame "execution" for three straight quarters when the real answer was that the board set a number disconnected from market reality. The consensus on r/sales backs this up - thread after thread of reps describing quotas that went up 30% year-over-year with no new territory, no new product, and no new pipeline support.
Revenue Growth and Deal Size
Healthy B2B companies grow 15-25% annually. Below 15% and you're stalling. Above 25% and you're in growth mode - make sure your infrastructure can handle it.
Average deal size is a sneaky leading indicator disguised as a lagging one. Trending up means you're moving upmarket successfully. Shrinking means you're discounting too aggressively or losing enterprise deals to competitors. Tracking deal size alongside win rate gives you a much clearer picture of whether your team is closing the right deals, not just enough deals.
CLV:CAC Ratio
3:1 is the minimum for a healthy business. 4:1 is optimal. Below 3:1, you're spending too much to acquire customers who don't stick around long enough to justify the cost. Payback period should be 12 months or less.
This is the KPI that keeps sales and finance aligned - sales wants to close deals, finance wants to close profitable deals.
Churn and Net Revenue Retention
B2B SaaS should target under 5% monthly churn. Net revenue retention of 120%+ is best-in-class for enterprise SaaS - meaning existing customers expand faster than they churn. A team with 90% NRR is filling a leaky bucket. A team with 130% NRR has a compounding engine.
Activity metrics mean nothing if your reps are dialing wrong numbers and bouncing emails. Prospeo gives your team 98% verified emails and 125M+ direct dials with a 30% pickup rate - so every call and email actually reaches a decision-maker.
Stop blaming rep effort when bad data is tanking your sales velocity.
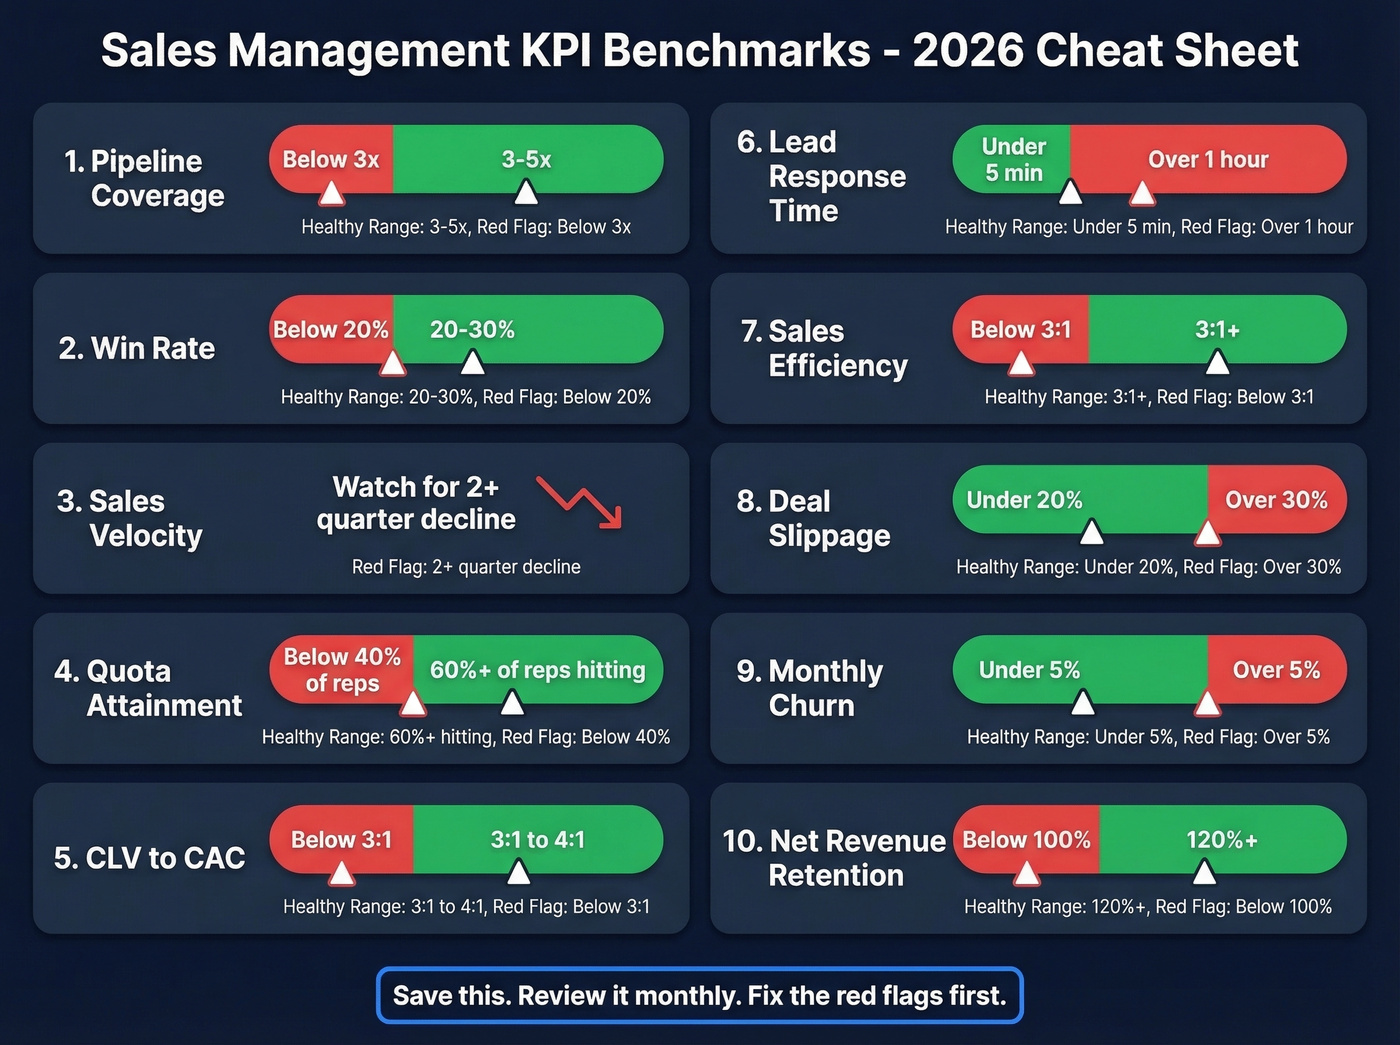
Benchmark Cheat Sheet
| KPI | Formula | Benchmark | Red Flag |
|---|---|---|---|
| Pipeline coverage | Pipeline / quota | 3-5x (enterprise) | Below 3x |
| Win rate | Wins / total opps | 20-30% | Below 20% |
| Sales velocity | (Opps x deal x win%) / cycle | Varies by segment | Declining 2+ quarters |
| Quota attainment | Actual / target | 60%+ of reps | Below 40% of reps |
| CLV:CAC | Lifetime value / CAC | 3:1 to 4:1 | Below 3:1 |
| Lead response | Time to first touch | Under 5 min | Over 1 hour |
| Sales efficiency | Revenue / sales cost | 3:1+ | Below 3:1 |
| Deal slippage | Slipped / total opps | Under 20% | Over 30% |
| Churn (monthly) | Lost / total customers | Under 5% | Over 5% |
| NRR | (Start + expand - churn) / start | 120%+ | Below 100% |
KPIs by Role and Business Model
VP vs. Manager vs. Rep
Not everyone should stare at the same dashboard. VPs need revenue growth, forecast accuracy, and CLV:CAC - the strategic layer. Managers need pipeline coverage, win rate, and quota attainment - the execution layer. Reps need activity metrics, deal velocity, and conversion rates - the daily layer.
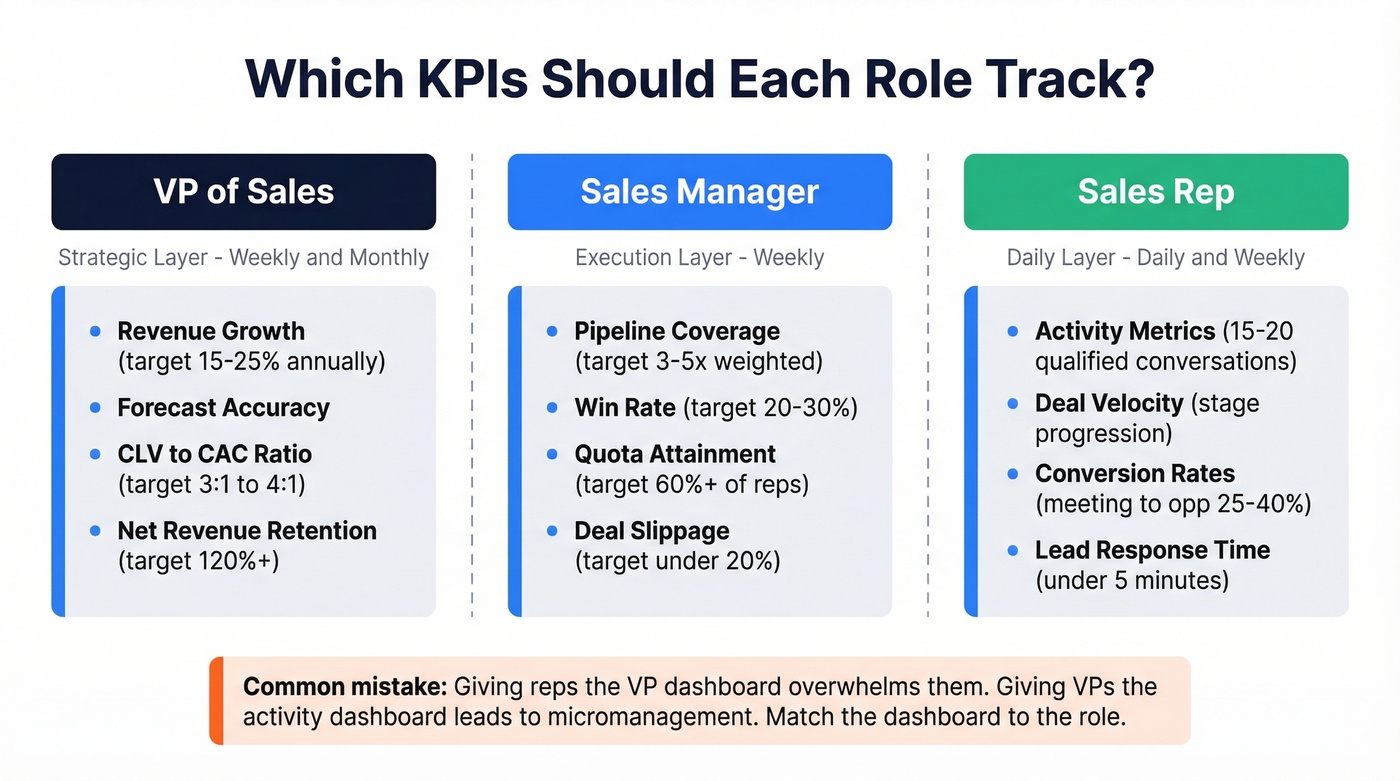
The mistake is giving reps the VP dashboard and wondering why they're overwhelmed. Or giving VPs the activity dashboard and watching them micromanage call counts.
SaaS Teams
SaaS sales leaders need a retention-heavy KPI set. NRR of 120%+ is the gold standard. Early-stage teams should target 10-20% MoM MRR growth. Gross margins should sit between 70-90%. Monthly churn under 5% is table stakes - above that, your sales team is closing the wrong customers.
B2B eCommerce and Hybrid Models
61% of B2B buyers now prefer a rep-free digital experience. That means tracking digital revenue mix, self-service adoption rates (target 60%+ monthly active), and B2B conversion rates (1.8-3.0% average, with distribution hitting 3-5%). For teams running a hybrid model, you need KPIs for both motions. Blending them into one dashboard hides where each channel actually performs.
The Data Quality Problem Nobody Talks About
Every KPI on this page is garbage if your underlying data is garbage. And most teams' data is worse than they think.
Your CRM is full of stale emails, wrong titles, and contacts who left the company two years ago. Reps send sequences to these ghosts. Bounce rates spike. Activity metrics look productive but reflect wasted effort. Pipeline gets inflated with opportunities built on bad contact data, and conversion rates crater because half the "leads" were never reachable in the first place.
The numbers tell the story. Snyk's team of 50 AEs was running a 35-40% bounce rate before fixing their data source. After switching to Prospeo, bounces dropped under 5%, AE-sourced pipeline jumped 180%, and they were generating 200+ new opportunities per month. That kind of turnaround comes down to 98% email accuracy on a 7-day refresh cycle - compared to the 6-week industry average most providers operate on. GreyScout saw a similar pattern: rep ramp time fell from 8-10 weeks to 4 weeks, largely because new reps weren't wasting their first month learning that half their contact list was dead.
Fix the data, then trust the dashboard. The order matters.
5 KPI Mistakes That Kill Performance
1. Tracking 20+ KPIs and acting on none. More dashboards don't mean more insight. Scale back to a manageable set, assign clear owners, and review quarterly. Eight to ten KPIs is the ceiling for most teams.
2. Lagging-only tracking. If you're only reviewing revenue and win rates, you're doing autopsies, not management. Pair every lagging KPI with a leading indicator that predicts it.
3. No benchmarks. "Track win rate" is useless advice without defining what good looks like. A 22% win rate might be excellent for enterprise software and terrible for SMB SaaS. Context is everything.
4. Using metrics to punish instead of coach. Look - Jerry Muller's The Tyranny of Metrics nails this: metrics should inform judgment, not replace it. The moment reps feel KPIs are weapons, they game the numbers instead of improving performance.
5. Ignoring data accuracy. If your bounce rate is above 5%, your pipeline KPIs are lying to you. Fix data quality first - everything else is downstream.
How to Build a KPI Operating System
A KPI without a review cadence is just a number. Here's the operating rhythm that works:
- Daily: Activity metrics - calls, emails, conversations. Reps and frontline managers.
- Weekly: Pipeline health - coverage ratio, stage movement, deal slippage. Managers and directors.
- Monthly: Revenue and conversion - win rate, quota attainment, average deal size. Directors and VPs.
- Quarterly: Strategic metrics - CLV:CAC, churn, NRR, forecast accuracy. VP and C-suite.
Set SMART targets for each KPI. Assign a single owner - if everyone owns it, nobody does. Make dashboards visible to the team, not locked in a manager's spreadsheet. And tie incentives to outcomes, not just activity. Rewarding call volume without measuring conversion creates busy reps, not productive ones.
Let's work backwards from revenue to required activities. If you need $1M this quarter, your win rate is 25%, and your average deal is $50K, you need 80 qualified opportunities. If your meeting-to-opp rate is 30%, you need roughly 267 meetings. Now your SDR team knows exactly what "enough" looks like. This reverse-engineering approach is how you translate sales goals into a daily playbook every rep can follow.
Northmill restructured their KPI program around this kind of backwards math and saw a 30% improvement in customer conversion rates. The KPIs didn't change - the system around them did.
Pipeline coverage drops when top-of-funnel sourcing breaks. Prospeo's 300M+ profiles with 30+ filters - buyer intent, technographics, headcount growth - let your SDRs fill pipeline with high-ICP accounts, not low-fit filler deals.
Build weighted pipeline that actually converts, starting at $0.01 per lead.
FAQ
What's the difference between a sales KPI and a sales metric?
A KPI is a metric tied to a specific business goal with a defined target and owner. All KPIs are metrics, but not all metrics are KPIs. If nobody acts when the number changes, it's a metric. If it triggers a review or coaching conversation, it's a KPI.
How many KPIs should a sales manager track?
Eight to ten maximum, split between leading and lagging indicators. More than ten means you're tracking noise. Fewer than five means you're flying blind on at least one critical dimension of pipeline health.
What's a good pipeline coverage ratio?
Enterprise teams need 3-5x weighted coverage, mid-market 2.5-4x, and SMB 2-3x. Always use weighted pipeline - unweighted coverage hides how much of your pipeline is actually likely to close. Below 3x at any segment is a red flag.
How often should I review sales KPIs?
Daily for activity, weekly for pipeline health, monthly for revenue and conversion, quarterly for strategic metrics like CLV:CAC and churn. Match cadence to how quickly you can act on the data.
How does bad contact data affect sales KPIs?
If 30%+ of your emails bounce, pipeline metrics are inflated, activity metrics reflect wasted effort, and conversion rates are artificially low. Fixing data quality at the source - with verified, regularly refreshed contact data - means every downstream KPI reflects reality instead of noise.