Sales Pacing: The Complete Formula Guide for Revenue Teams
Your team is at 38% of quota on day 45 of the quarter. Linear math says you're on pace. Your gut says otherwise - and your gut is right, because many B2B teams close 50-60% of quarterly revenue in the final month. The straight-line model is lying to you.
Understanding sales pacing - and doing the math correctly - is the difference between catching a miss early and scrambling in the final week.
What You Need (Quick Version)
- The basic formula: remaining target / selling days left = daily pace. Simple, but incomplete on its own.
- Linear pacing lies. Use weighted curves built from your own historical close data.
- Pipeline-needed math drives action. Knowing you're "behind pace" is useless without knowing how much new pipeline to generate this week.
What Is Sales Pacing?
Sales pacing measures where you are right now against where you should be to hit quota by period end. It's not about talk speed or conversational cadence. It's revenue math.
The simplest version is quota attainment at a point in time. If your quarterly quota is $250K and you've closed $235K, that's 94% attainment. Pacing stretches that across the timeline: are you tracking to hit the number, or coasting toward a miss? In Salesforce, sum won opportunities with close dates in the period. In HubSpot, same logic with won deals.
The Basic Formula
Start with the daily calculation: Period target / Selling days = Daily pace.
A worked example from Numerik's paceline methodology: $118,000 monthly target / 22 selling days = $5,364/day. That's your sales paceline - the number you should hit each selling day to stay on track. To check if a rep is ahead or behind, divide actual daily sales by the daily paceline. So $4,200 / $5,364 = 78% of pace, meaning the rep is 22% behind.
One detail most teams miss: use selling days, not calendar days. Strip out weekends and holidays. A month with 22 selling days and one with 19 produce very different daily targets from the same quota.
Why Linear Pacing Fails
Here's the thing: your top rep is "ahead of pace" at 120% through week six. Everyone relaxes. Then month three arrives and the team closes 50-60% of the quarter's revenue in 30 days - with a chunk landing in the final 48 hours. That "ahead of pace" rep was actually behind, because the linear model assumed revenue lands evenly. It doesn't.
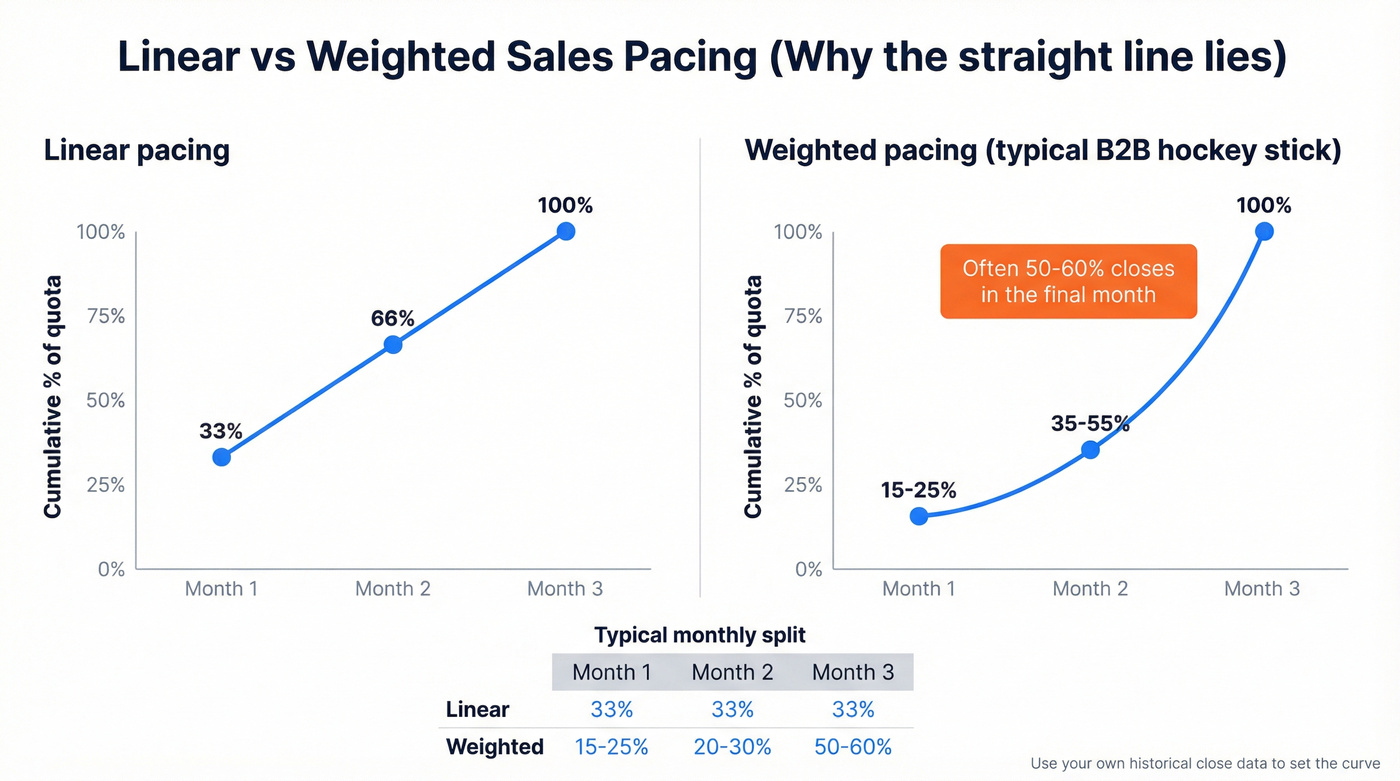
This is the hockey-stick close pattern, and it's the norm in B2B. In our experience, the hockey-stick is even more extreme for enterprise deals with 90+ day cycles, where deal slippage pushes a huge share of revenue into the final weeks.
| Period | Linear Pacing | Weighted Pacing (B2B) |
|---|---|---|
| Month 1 | 33% | 15-25% |
| Month 2 | 33% | 20-30% |
| Month 3 | 33% | 50-60% |
The fix: build seasonal indices from 24-36 months of historical close data, segmented by region, deal size, and product line. Map your actual demand curve, then pace against that instead of a straight line.
Your pipeline-needed calculation breaks down the moment contact data goes stale. Prospeo refreshes every record on a 7-day cycle - not the 6-week industry average - so your weighted pipeline actually reflects reality. With 98% email accuracy and a 92% enrichment match rate, your coverage ratios stay honest.
Stop running pacing reviews on pipeline built from dead contacts.
Pipeline Coverage and Pipeline Needed
Remember that day-45 scenario from the intro? This is where the math gets actionable. Coverage ratio turns pacing from a rearview mirror into a windshield - and it's the metric revenue operations teams should obsess over.
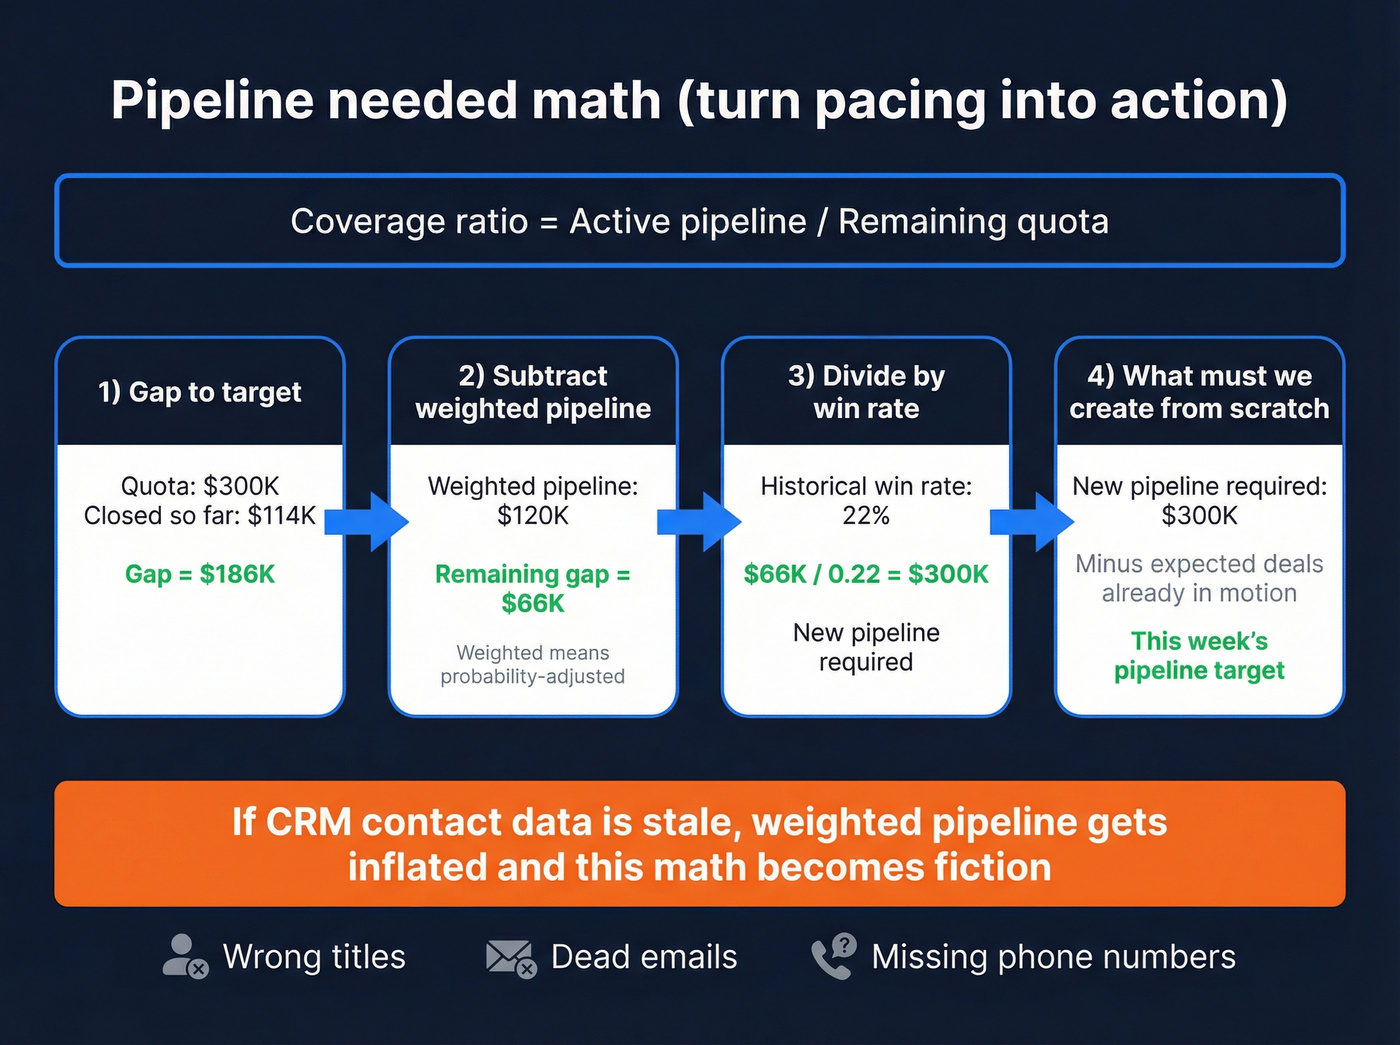
Active pipeline / Remaining quota = Coverage ratio
But coverage alone is misleading. Here's the pipeline-needed calculation that drives action, adapted from Gong's pacing methodology:
- Calculate your gap to target. Quota is $300K, you've closed $114K - gap is $186K.
- Subtract weighted pipeline. $120K in weighted pipeline leaves a $66K gap.
- Divide by your historical win rate. At 22%, you need $66K / 0.22 = $300K in new pipeline.
- Subtract expected deals from current pipeline to get what you must generate from scratch.
This math is only as good as the pipeline data feeding it. If your contact records are stale - wrong titles, dead emails, missing phone numbers - your weighted pipeline gets inflated and your pacing becomes fiction. We've seen teams running pacing reviews on pipeline where 20%+ of contacts had outdated info, which made their coverage ratios meaningless. Tools like Prospeo's CRM enrichment, which refreshes contact data on a 7-day cycle with 98% email accuracy, exist specifically to solve that problem.
Pacing vs. Forecasting
Pacing and forecasting serve different purposes. The cleanest framing comes from Clari's pipeline management breakdown: pipeline management is "heads-down" - changing what reps do today. Forecasting is "heads-up" - predicting what happens tomorrow. Pacing sits between them, telling you whether today's trajectory leads to tomorrow's number.
The gap between the two is enormous: four in five sales and finance leaders missed at least one forecast in recent years. Strong pacing discipline - especially weighted models with pipeline-needed math - closes that gap by catching misses earlier, when there's still time to adjust sales velocity and recover.
Hot take: If your average deal cycle is under 30 days and your ACV is below $15K, skip weighted pacing entirely. Linear is close enough. Save the complexity for teams where deal slippage actually kills quarters.
How to Build a Pacing Report
Under ~50 reps, a well-structured Google Sheets tracker handles most weekly needs. Here are the columns that matter:
| Column | Purpose |
|---|---|
| Selling Day # | Sequential count |
| Daily Target | Weighted daily pace |
| Actual Sales | Closed-won that day |
| Cumulative Target | Running pace total |
| Cumulative Actual | Running closed total |
| Variance | Actual - Target |
| % of Pace | Cumulative / Target |
Add conditional formatting: green when % of pace is >=100%, red when it drops below 85%, yellow for the zone between. Tracking sales activity variance at the rep level - the gap between expected and actual output - turns this spreadsheet from a passive scorecard into a coaching tool.
If you don't want to build from scratch, Geckoboard's free Google Sheets template uses a clean 4-sheet structure: Sales data, Config, Sales Report, and README - with daily, weekly, and monthly reporting views.
For cadence, reps should check daily as a quick pulse. Some reps we've worked with track pacing twice daily - a midday check and an end-of-day close figure - which catches drift faster than a single daily update. Managers review weekly to spot trends, and leadership looks monthly for strategic adjustments.
Rep Activity Analysis to Improve Pacing
Sales pacing tells you whether outcomes are on track. Rep activity analysis tells you why they aren't.
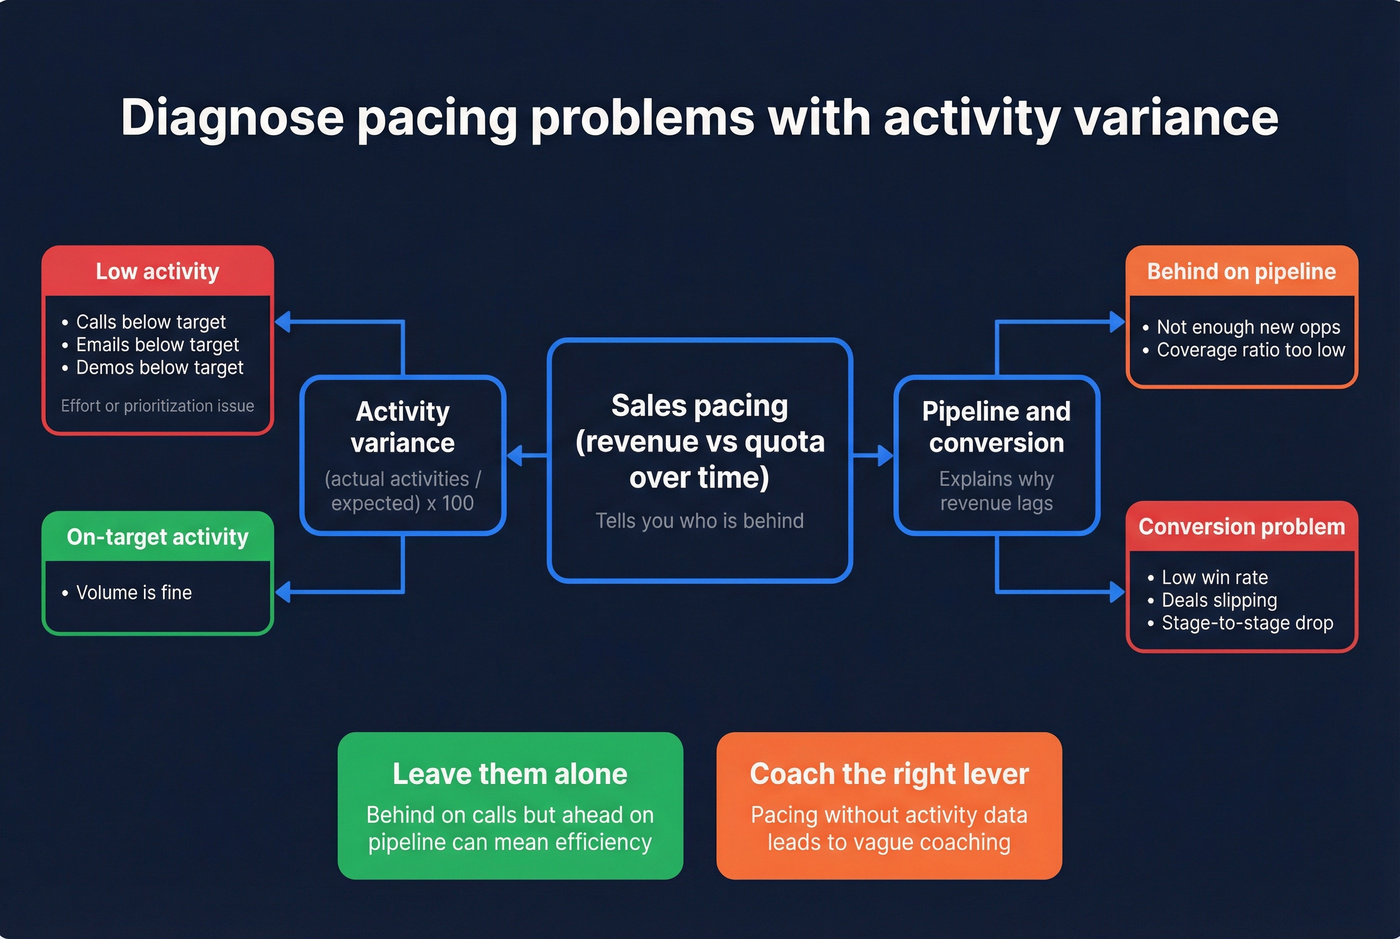
Pairing the two - revenue pacing plus activity-based analytics - gives managers a complete picture: not just "who's behind," but "what behavior is causing the miss." The simplest approach is a sales activity variance formula: (actual activities / expected activities) x 100. If a rep's target is 60 calls per day and they're averaging 42, that's a 70% activity rate - a 30% variance that almost certainly explains a pacing shortfall. Platforms like Gong, Salesloft, or even a well-structured CRM dashboard can surface these gaps automatically.
The key is connecting activity metrics back to pacing outcomes. A rep who's behind on calls but ahead on pipeline is running an efficient process - leave them alone. A rep who's hitting activity targets but falling behind on revenue has a conversion problem, not an effort problem. Activity-based analytics without the pacing context leads to micromanagement; pacing without activity data leads to vague "try harder" coaching. Let's be honest: most sales managers default to one or the other instead of combining both.
What Good Pacing Looks Like
Average quota attainment across B2B sat at 74% in 2025, and only 39% of organizations see more than half their sellers hitting quota. Those numbers haven't improved much heading into 2026.
The practical interpretation: if your team is pacing at 80%+ of weighted target mid-quarter, you're ahead of most. At 90%+ with strong pipeline coverage, you're in excellent shape. Don't benchmark against perfection - benchmark against the field. And remember, pacing at 100% on a linear model mid-quarter probably means you're actually behind if your close pattern is end-loaded.
If you want to pressure-test your assumptions, compare your numbers to sales pipeline benchmarks and track pipeline health alongside pacing.
Behind pace? The fastest way to close the gap is generating new pipeline from verified contacts who actually pick up. Prospeo gives you 125M+ verified mobile numbers with a 30% pickup rate and 300M+ profiles filtered by buyer intent, job changes, and headcount growth - so reps spend selling days selling, not chasing bad numbers.
Fill the pipeline gap with contacts that connect on the first dial.
FAQ
What's a good sales pacing percentage?
With average quota attainment at 74% industry-wide, pacing at 80%+ of your weighted target mid-quarter puts you ahead of most B2B teams. If your revenue pattern is heavily end-loaded, hitting 40% mid-quarter on a weighted model is perfectly on track.
How often should I check pacing?
Daily for individual reps as a quick pulse, weekly for team reviews where managers spot trends and adjust tactics, monthly for leadership strategy. Avoid hourly checks - noise drowns signal and reps start gaming daily numbers instead of running good process.
Do I need a dedicated tool or is a spreadsheet enough?
Under 50 reps, a well-built Google Sheets pacing report handles most needs. At scale, platforms like Gong Forecast or Clari at roughly $50-150/user/month add pipeline intelligence and automated weighted models. Clean pipeline data matters more than the tool you pick - if your CRM records are outdated, no dashboard will save your pacing math.
What's the difference between pacing and activity variance?
Sales pacing tracks revenue progress against quota over time. Activity variance measures the gap between a rep's expected activities (calls, emails, demos) and actual output. Use pacing to flag who's behind on outcomes, then use the activity variance formula to diagnose whether the root cause is effort, efficiency, or conversion.