Sales Pipeline Metrics: Benchmarks, Formulas, and Frameworks for 2026
It's Thursday afternoon. Your VP of Sales asks for a pipeline number. Three reps give three different answers - one's counting deals that haven't moved in 90 days, another's using last quarter's close dates, and the third just eyeballs it. 69% of B2B reps missed quota last year, and bad pipeline visibility is a massive reason why. The problem isn't that teams lack sales pipeline metrics. It's that they're tracking the wrong ones, with the wrong math, against no benchmarks.
The Five Metrics That Actually Matter
If you're building a pipeline dashboard from scratch, start here:
- Pipeline velocity - how fast revenue moves through your funnel
- Pipeline coverage - calibrated to your actual win rate, not the lazy 3x rule
- Stage conversion rates - where deals stall, stage by stage
- Deal aging - your zombie deal early-warning system
- Forecast accuracy - the meta-metric that tells you whether your other numbers are trustworthy
Everything else is a refinement. Below: the formulas, industry benchmarks most articles skip, and how to wire this into your CRM.
Core Metrics Every Team Should Track
Pipeline Velocity
Pipeline velocity captures all four levers of pipeline health in a single number:
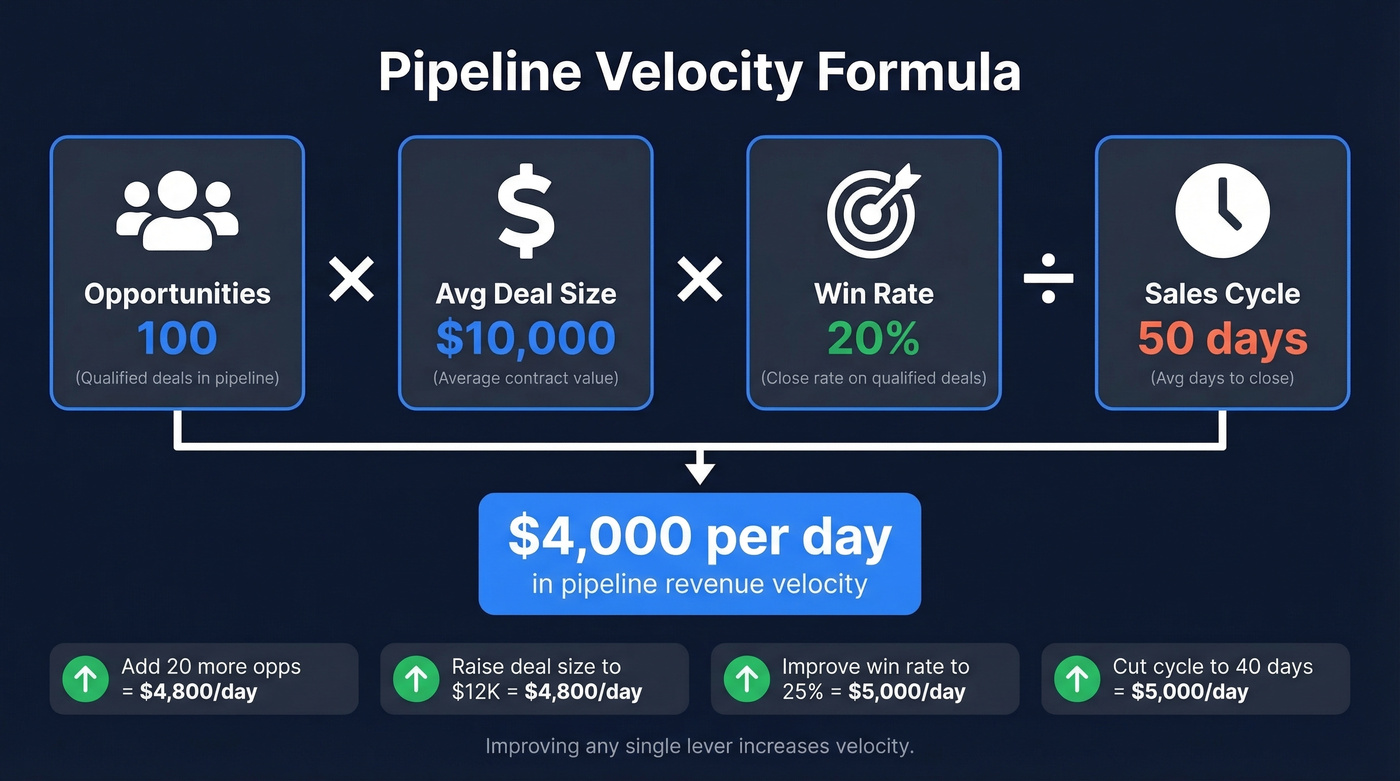
(Number of Opportunities x Average Deal Size x Win Rate) / Sales Cycle Length = Daily Revenue Velocity
Say you've got 100 qualified opportunities, $10,000 average deal size, 20% win rate, and a 50-day average sales cycle. That gives you (100 x $10,000 x 0.20) / 50 = $4,000/day in pipeline velocity.
The beauty of velocity is that improving any single lever moves the number. Shorten your cycle by 10 days? Velocity jumps. Increase win rate by 5 points? Same effect. Teams that compress their cycle to 30-45 days see 38% higher velocity than those running 76-90 day cycles, which is why cycle reduction is one of the highest-leverage plays available to most orgs.
Here's where teams mess this up: they mix segments. If you blend your SMB deals (30-day cycles) with enterprise deals (120-day cycles), the number becomes meaningless. Calculate velocity per segment, always. And don't ignore lost deals when calculating win rate - if you only count deals that reached a decision stage, you're inflating your win rate and lying to yourself about velocity.
Pipeline Coverage
The "3x pipeline coverage" rule is lazy math. Coverage should be tied directly to your historical win rate, and most teams skip this step entirely.
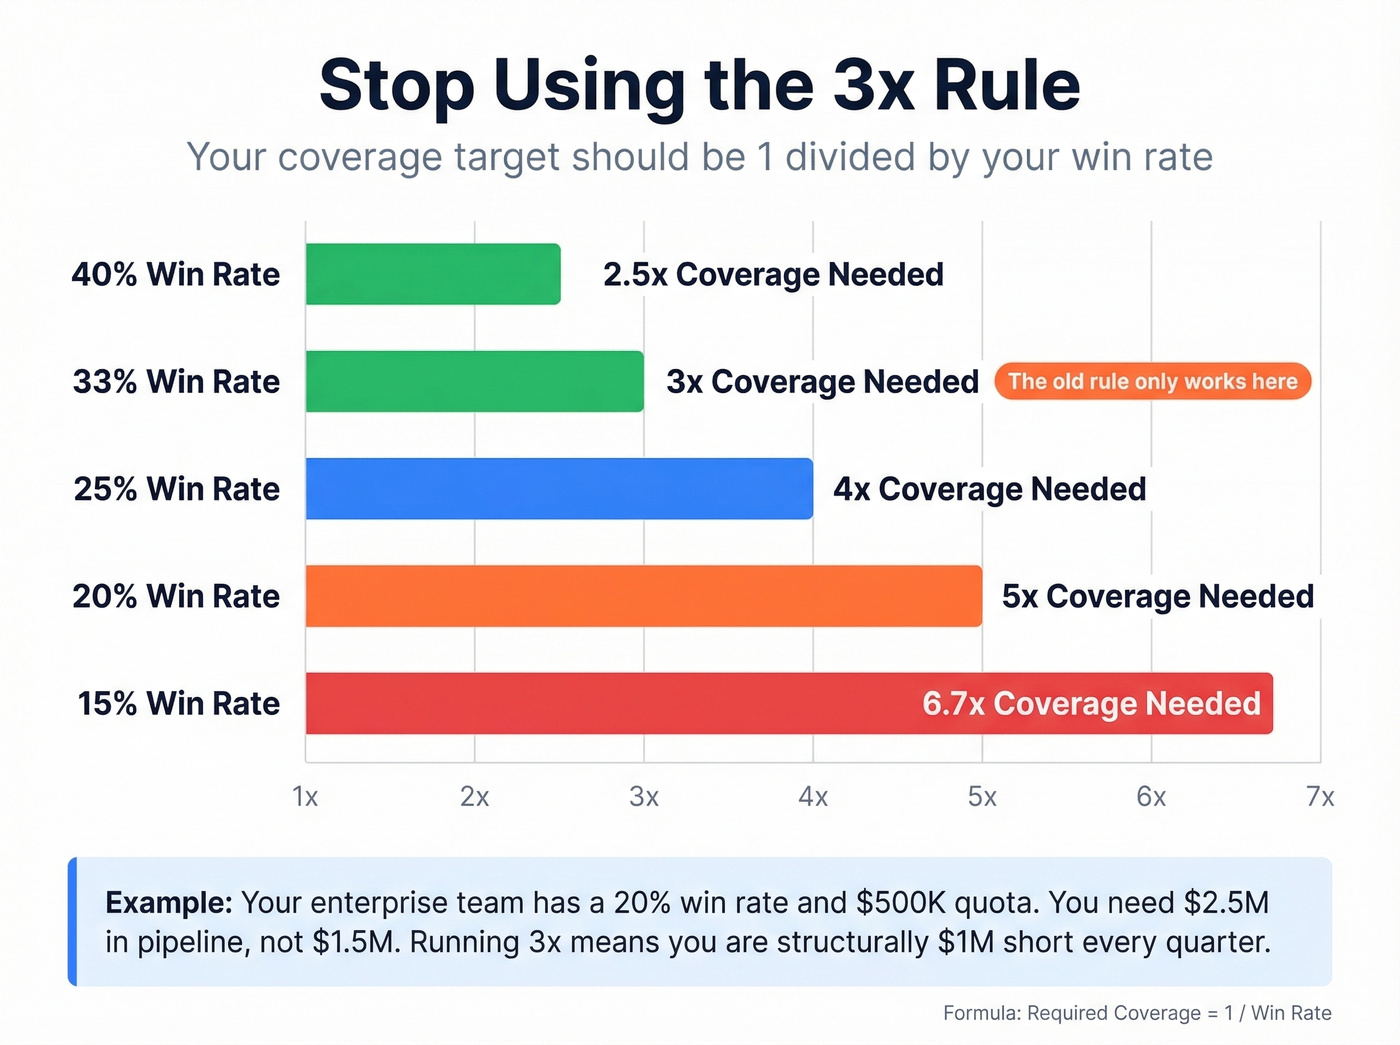
If your win rate is 25%, you need 4x coverage to hit quota. If it's 20%, you need 5x. The 3x rule only works if your win rate is roughly 33% - and most B2B teams aren't there.
| Segment | Win Rate | Target Coverage |
|---|---|---|
| Enterprise (1,000+) | 20-25% | 3-5x |
| Mid-market (100-999) | 25-35% | 2.5-4x |
| SMB (<100) | 30-40% | 2-3x |
If your enterprise team is running 3x coverage with a 20% win rate, they're structurally short. That's not a motivation problem - it's a math problem.
Win Rate
Average outbound win rates hover around 20%. Best-in-class teams with strong qualification push past 35-40%. But the number that matters most isn't your blended win rate - it's your cohorted win rate.
David Sacks lays this out well: group opportunities by the month they were created, then track what percentage close over the following months. This prevents you from blending Q1 deals (which had time to close) with Q4 deals (which haven't). We've run this analysis across dozens of pipeline reviews, and cohorted win rates always tell a different story than blended ones. Usually a less flattering one.
Stage Conversion Rates
Top-to-bottom conversion - lead to closed-won - is a vanity metric. What actually helps you diagnose problems is stage-to-stage conversion. If your MQL-to-SQL rate is 38% but your SQL-to-Opportunity rate drops to 15%, you know exactly where the leak is. These stage-level numbers are where coaching conversations should start.
Most articles skip stage-to-stage benchmarks because the data is hard to find. We'll cover them in the benchmark tables below.
Deal Aging and Cycle Length
Every pipeline has zombie deals - opportunities that stopped moving but nobody killed them. They inflate your coverage numbers and make forecasts unreliable.
A practical rule: any deal inactive for 45-60 days gets flagged for review. Not automatically closed-lost - reviewed. Close-date slippage is another zombie indicator. If a deal has pushed its expected close date forward twice, it belongs in a review, not your forecast.
Time-in-stage is the early warning version of deal aging. If your average SQL-to-proposal time is 12 days and a deal has been sitting there for 30, something's wrong. Track median time per stage and set alerts at 1.5x the median.
Forecast Accuracy
Teams that review pipeline metrics weekly achieve 87% forecast accuracy and 34% revenue growth. Teams that review ad-hoc? 52% accuracy and 11% growth. That's not a marginal difference - it's the gap between a predictable business and a guessing game.
Forecast accuracy is the meta-metric. If it's low, every other number you're tracking is suspect. Build weekly pipeline reviews into your Monday or Friday cadence and measure forecast accuracy as a trailing 4-week average.
Benchmark Tables by Industry and Size
Benchmarks turn metrics from abstract numbers into actionable signals. A study of 247 B2B organizations provides some of the most granular velocity data published.
Velocity by Industry
| Industry | Deal Size | Win Rate | Cycle (days) | Velocity/Day |
|---|---|---|---|---|
| SaaS & Tech | $12,400 | 22% | 67 | $1,847 |
| Financial Services | $31,200 | 18% | 89 | $2,134 |
| Healthcare | $18,700 | 25% | 72 | $1,523 |
| Manufacturing | $47,800 | 19% | 124 | $1,289 |
| Prof. Services | $8,900 | 28% | 51 | $876 |
| Real Estate | $89,300 | 16% | 147 | $2,456 |
| Marketing & Ads | $15,200 | 24% | 58 | $743 |
Velocity figures reflect the full formula including opportunity volume, which varies by industry.
Professional Services has the highest win rate but the lowest velocity because deal sizes are small. Real Estate has the lowest win rate but high velocity because the deal sizes are massive. Velocity normalizes these tradeoffs into one comparable number - that's the whole point.
Velocity by Company Size
| Revenue Tier | Deal Size | Win Rate | Cycle | Velocity |
|---|---|---|---|---|
| $1M-$5M | $6,200 | 26% | 43 days | $687/day |
| $5M-$25M | $12,800 | 23% | 61 days | $1,303/day |
| $25M-$100M | $22,700 | 21% | 78 days | $3,484/day |
| $100M-$500M | $35,300 | 19% | 95 days | $6,919/day |
| $500M+ | $57,600 | 17% | 118 days | $12,945/day |
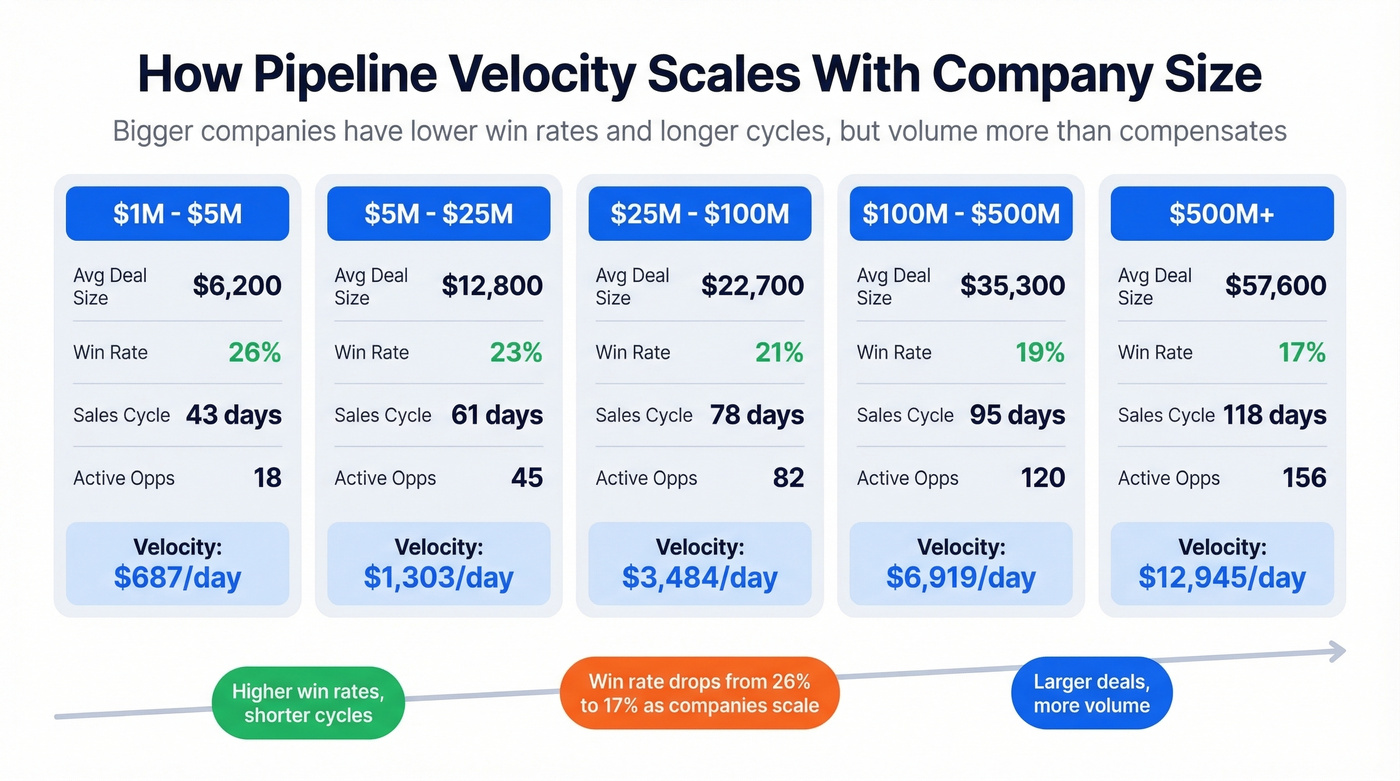
The pattern is clear: as companies scale, win rates drop and cycles lengthen, but volume and deal size more than compensate. Early-stage companies ($1M-$5M) typically run 18 active opportunities; $500M+ companies run 156. That volume gap is the primary velocity driver at scale.
Stage Conversion Benchmarks
Based on First Page Sage's funnel data, here's what stage-to-stage conversion looks like for B2B SaaS:
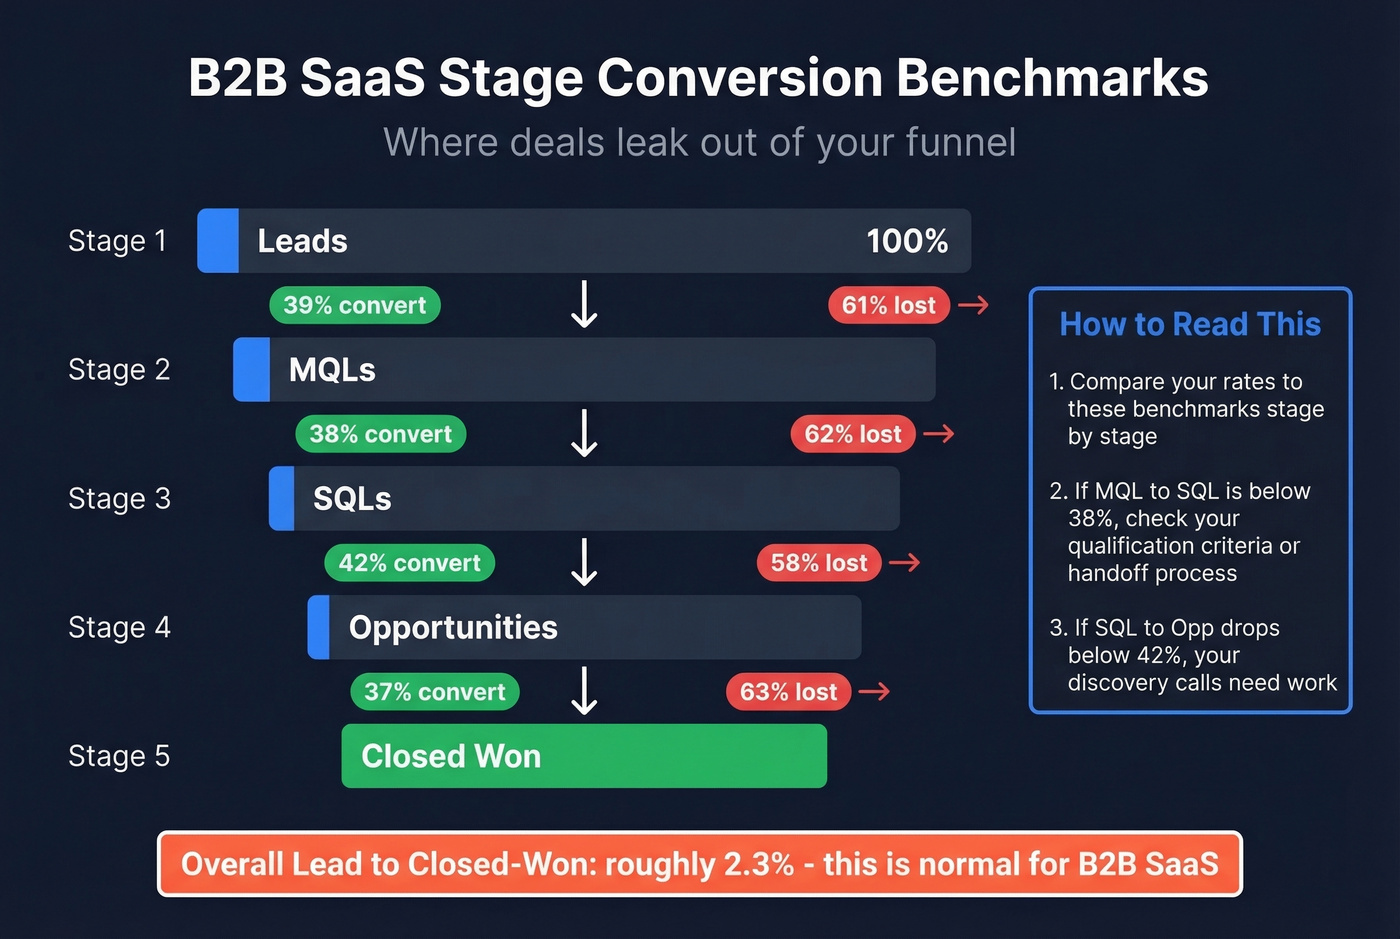
| Stage Transition | Benchmark |
|---|---|
| Lead to MQL | 39% |
| MQL to SQL | 38% |
| SQL to Opportunity | 42% |
| SQL to Closed-Won | 37% |
If your SaaS team's MQL-to-SQL rate is 25% against a 38% benchmark, that's a qualification or handoff problem - not a pipeline generation problem. Benchmarks tell you where to look.
Pipeline velocity has four levers - and the one most teams ignore is opportunity volume. Prospeo's 300M+ profiles with 30+ filters (intent data, headcount growth, technographics) let you fill your pipeline with qualified opportunities, not noise. 98% email accuracy means your coverage numbers reflect real, reachable buyers.
Teams using Prospeo book 26% more meetings than ZoomInfo users.
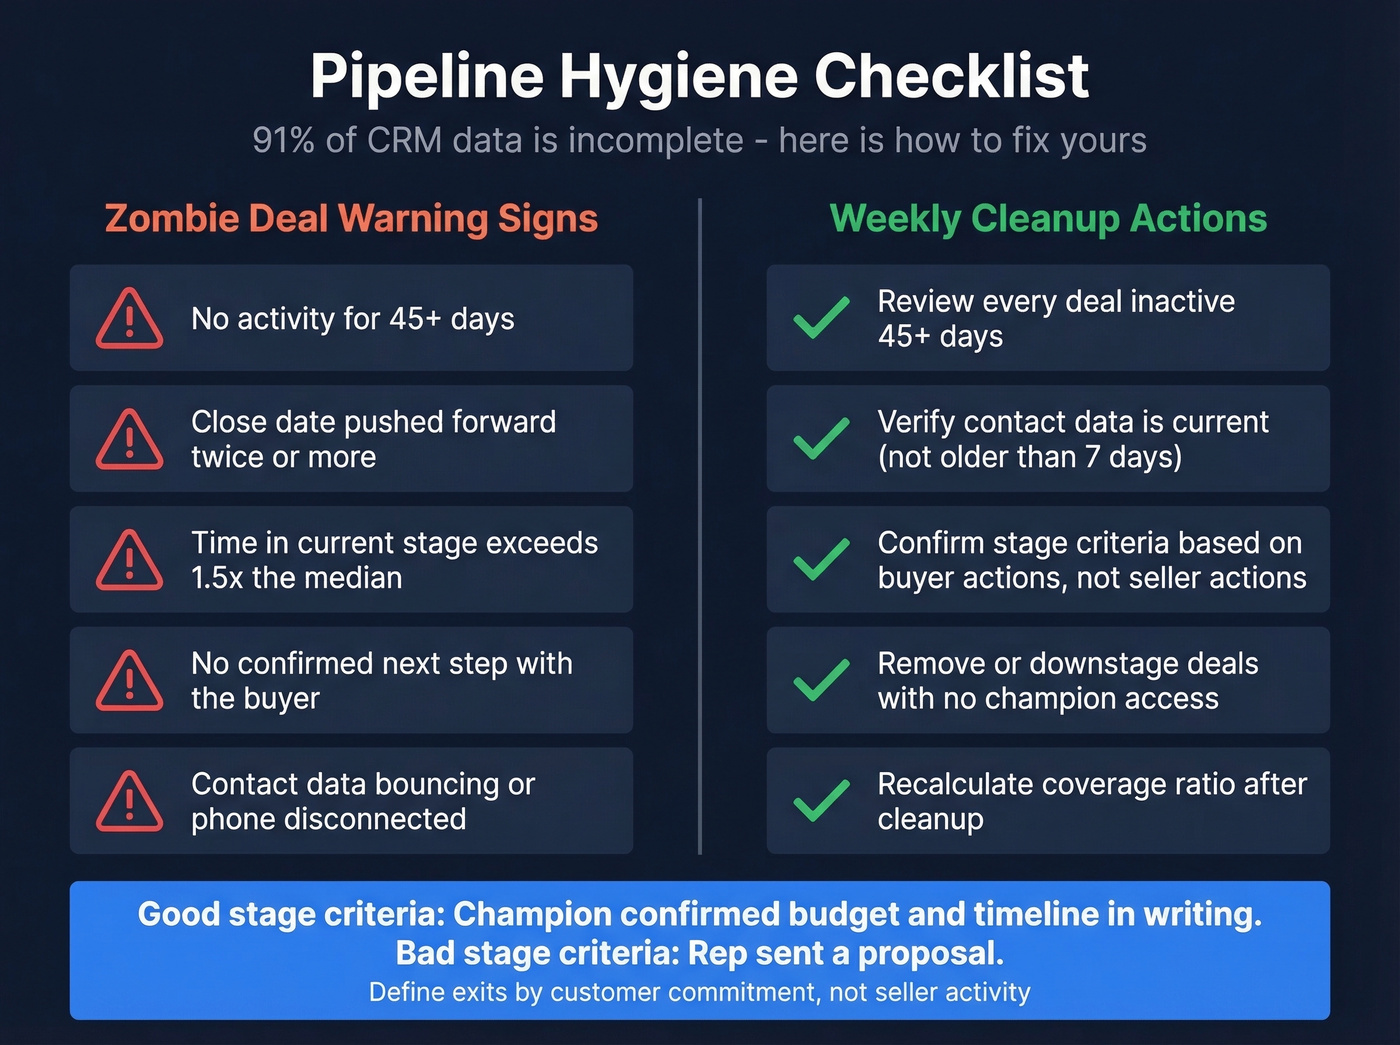
Pipeline Hygiene - The Metric Nobody Tracks
91% of CRM data is incomplete, and roughly 70% of contact data becomes obsolete within a year. The numbers you're reviewing every Monday are built on a foundation of decaying information.
Pipeline hygiene isn't glamorous, but it's the difference between a forecast you can trust and one that's fiction.
Objective exit criteria. Define what moves a deal from one stage to the next based on customer actions, not seller actions. "Sent proposal" is a seller action. "Champion confirmed budget and timeline in writing" is a customer action. The SBI framework gets this right - stage definitions should reflect buyer commitment, not rep activity.
Zombie deal cleanup. Flag any deal inactive for 45+ days. Review weekly. Kill what's dead. Your coverage ratio will drop, and that's a good thing - it'll finally reflect reality.

In our experience, the biggest pipeline accuracy killer isn't bad math - it's stale data. When teams run outreach on outdated contacts, bounce rates climb, meetings get booked with the wrong people, and every downstream metric gets distorted.
Input Metrics That Feed Your Pipeline
Pipeline metrics measure what's already in the funnel. But the health of what enters the funnel determines everything downstream.
Cold email reply rates run 1-5%. 80% of deals require five or more touches, yet 44% of reps give up after one. Speed matters too - the first responder wins 35-50% of deals, and conversion rates are 8-21x higher when response time is under five minutes. Reps spend roughly 28% of their time actually selling; the rest goes to admin, CRM updates, and internal meetings.
This means upstream data quality isn't a nice-to-have - it's the constraint. If your reps are spending their limited selling time reaching out to invalid emails and disconnected phone numbers, every pipeline metric suffers. Velocity drops, coverage shrinks, and cycles lengthen because reps waste days chasing ghosts. Meritt saw this firsthand after switching to Prospeo for email verification: bounce rate dropped from 35% to under 4%, and pipeline tripled from $100K to $300K per week. That's a 3x pipeline increase from fixing one upstream variable.
Zombie deals and inflated coverage kill forecasts. But so does bad contact data - every bounced email is a dead opportunity dragging down your win rate. Prospeo's 7-day data refresh cycle means the contacts in your pipeline are current, not stale records from six weeks ago.
Stop forecasting on ghost data. Get contacts verified every 7 days.
How to Build Pipeline Dashboards
Knowing which metrics to track is half the battle. The other half is building dashboards that surface the right numbers to the right people. On r/SalesOperations, the recurring question isn't "what metrics should I track?" - it's "which metrics do you actually act on?" That distinction should drive your dashboard design.
In HubSpot (Sales Hub Professional or Enterprise): navigate to Reporting, then Reports, then Sales. Customize filters by date range, deal owner, team, and pipeline. Save reports to role-specific dashboards. Build three distinct views:
Rep dashboard: deal aging alerts, personal pipeline value, and next-step compliance. Reps need to see what's stalling and what needs action today.
Manager dashboard: stage conversion rates, velocity by rep, and coverage vs. quota. Managers need to spot coaching opportunities and forecast risk.
Executive dashboard: aggregate coverage ratio, forecast accuracy trending, and pipeline generation trends. Executives need the 30,000-foot view with enough detail to ask the right questions.
In Salesforce: use Opportunity reports filtered by stage, close date, and owner. Build forecast category reports to track commit vs. best-case vs. pipeline. Create aging bucket reports (0-30, 31-60, 61-90, 90+ days) and set up dashboard alerts when deals exceed your zombie threshold.
The common mistake is building one dashboard for everyone. A rep doesn't need forecast accuracy trending. A CRO doesn't need daily call counts. Match the dashboard to the decision the viewer needs to make.
Mistakes That Destroy Pipeline Accuracy
Mixing segments. A 30-day SMB cycle and a 120-day enterprise cycle averaged together tells you nothing about either. Calculate velocity per segment.
Ignoring lost deals in win rate. Count everything that entered the pipeline, not just deals that reached "decision made."
Using arbitrary stage probabilities. Assigning 50% to "proposal sent" because it feels right is guesswork. Ground probabilities in actual historical stage win rates.
Not cohorting. Blending Q1 and Q4 opportunities mixes mature deals with brand-new ones. Cohort by creation month and track outcomes over time, as Sacks recommends.
Reviewing ad-hoc instead of weekly. Weekly review correlates with 34% revenue growth. Ad-hoc correlates with 11%. Build the cadence and protect it.
Treating 3x coverage as universal. If your win rate is 20%, 3x coverage means you'll structurally miss quota. Do the math for your actual win rate.
Ignoring activity data. Tracking pipeline KPIs without examining the activity behind them - calls made, emails sent, meetings held - leaves you diagnosing symptoms instead of root causes. (If you need a clean way to define and standardize those, start with these sales activities.)
Let's be honest about something most pipeline consultants won't say: if your average deal is under $8K, you probably don't need sophisticated pipeline analytics at all. You need more at-bats. We've seen teams obsess over dashboards at low deal sizes, using analytics as a procrastination tool instead of picking up the phone.
FAQ
What's the most important sales pipeline metric?
Pipeline velocity. It combines opportunities, deal size, win rate, and cycle length into one number showing how fast revenue moves through your funnel. If you can only track one metric, track velocity - improving any of its four inputs directly increases the output.
How much pipeline coverage do you actually need?
Divide 1 by your historical win rate. At a 25% win rate you need 4x coverage; at 20% you need 5x. The popular "3x rule" only works if your team closes at roughly 33%, which most B2B orgs don't. Segment by deal size for accuracy.
How often should you review pipeline metrics?
Weekly. Teams reviewing weekly see 34% revenue growth and 87% forecast accuracy, versus 11% growth and 52% accuracy for ad-hoc reviews. Build it into your Monday or Friday cadence and protect the meeting.
How do you improve pipeline data quality?
Verify contact data before it enters your CRM - tools like Prospeo catch invalid emails at 98% accuracy before they inflate your metrics. Then enforce objective stage exit criteria based on buyer actions, and flag any deal inactive for 45+ days for review.