Sales Rep Productivity Metrics: What to Track, What to Skip, and What "Good" Looks Like
It's Monday morning. You open the dashboard. Forty-seven widgets, twelve charts, a pipeline number that looks healthy, and a quota attainment figure that tells a completely different story. 43.5% of sales professionals hit quota in recent quarters. Ebsta's benchmarks paint it worse: 69% of reps fell short. The problem isn't effort - it's which sales rep productivity metrics you're actually measuring.
Most productivity guides hand you 30 metrics and call it a framework. That's not a framework. That's a spreadsheet someone got promoted for building. Here's what actually moves revenue, broken down by role, with real benchmarks and the anti-patterns that quietly destroy rep efficiency.
The Only Metrics You Need (Quick Version)
If you track nothing else, track these per role. Everything below is context, nuance, and the "why."
| Role | Metric | Why It Matters |
|---|---|---|
| SDR | Qualified conversations/day | Activity without quality is noise |
| SDR | Meeting-to-opportunity rate | Measures handoff quality |
| SDR | Pipeline created ($) | The output that funds the team |
| AE | Win rate | Efficiency of closing motion |
| AE | Pipeline velocity | Single best diagnostic metric |
| AE | Quota attainment | The scoreboard |
| Manager | Time spent selling (%) | Reveals hidden capacity drains |
| Manager | Forecast accuracy | Trust signal for the board |
| Manager | Ramp time to quota | Hiring ROI indicator |
Here's the contrarian thesis: tracking more metrics doesn't make you more productive. It makes you more confused. Three to five per role, reviewed on a set cadence, is the ceiling. Everything beyond that is dashboard theater.
If your average deal is under $15K, you probably don't need 12 dashboard widgets. You need three numbers and a weekly coaching conversation. We've seen teams spend more time debating metric definitions than actually coaching reps - and that obsession with measurement sophistication is itself a productivity drain.
How to Measure Sales Rep Productivity
The simplest framework that works: inputs vs. outputs. Inputs are leading indicators you can coach - calls made, emails sent, time spent prospecting. Outputs are lagging indicators you can only measure - revenue closed, deals won, quota attainment. The Enboarder framework breaks this further into three pillars: quantity (volume of activity), quality (conversion and impact per activity), and efficiency (output per unit of effort).
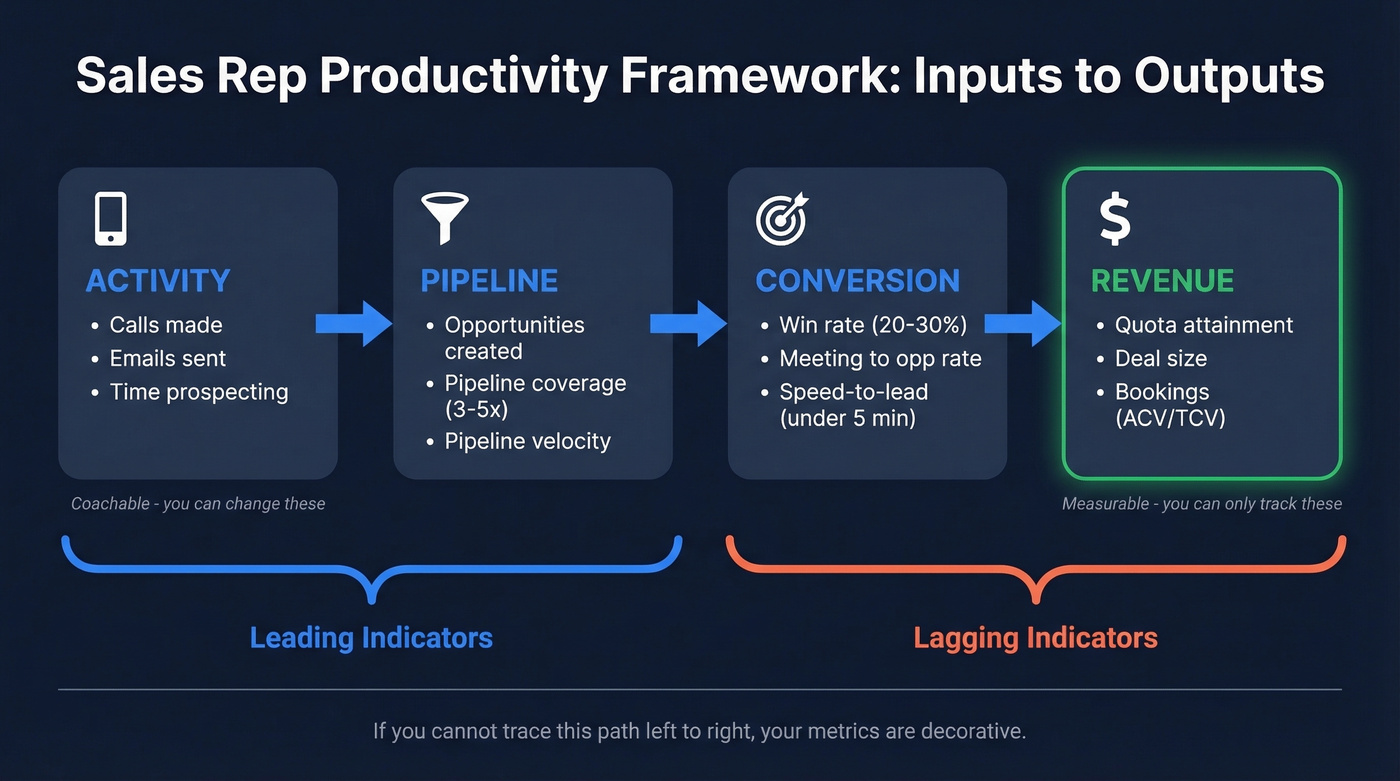
You can coach inputs. You can only measure outputs. When a rep's win rate drops, you don't coach "win more" - you look upstream. Are they qualifying well? Are discovery calls thorough? Is pipeline coverage thin? Leading metrics tell you where to intervene. Lagging metrics just tell you something's wrong.
Most sales orgs over-index on lagging metrics and under-invest in the leading indicators that predict them. Your dashboard should flow left to right: activity, then pipeline, then conversion, then revenue. If you can't trace that path, your metrics are decorative.
12 Metrics That Actually Move Revenue
Activity Metrics
Reps spend only 30% of their time actually selling. Forrester puts a finer point on it: the average rep wastes about 14 out of 51 working hours per week on admin tasks alone. Top-performing B2B organizations that tackle this head-on free up about 20% of sellers' capacity and improve efficiency by up to 30%.
Track this: qualified conversations per day. For SDRs, the benchmark is 15-20 meaningful conversations daily. For AEs, 8-12. These aren't dial counts - they're actual two-way exchanges where something progresses.
Skip this: raw activity volume. Total calls logged, emails sent, CRM tasks completed. A rep who makes 80 calls and books zero meetings isn't productive. They're busy. Big difference.
The metric that reveals capacity problems is time spent selling as a percentage of total hours. Below 35%? You don't have a performance problem. You have a process problem.
Pipeline Metrics
Pipeline velocity is the single most diagnostic metric in B2B sales. The formula from Outreach is clean:
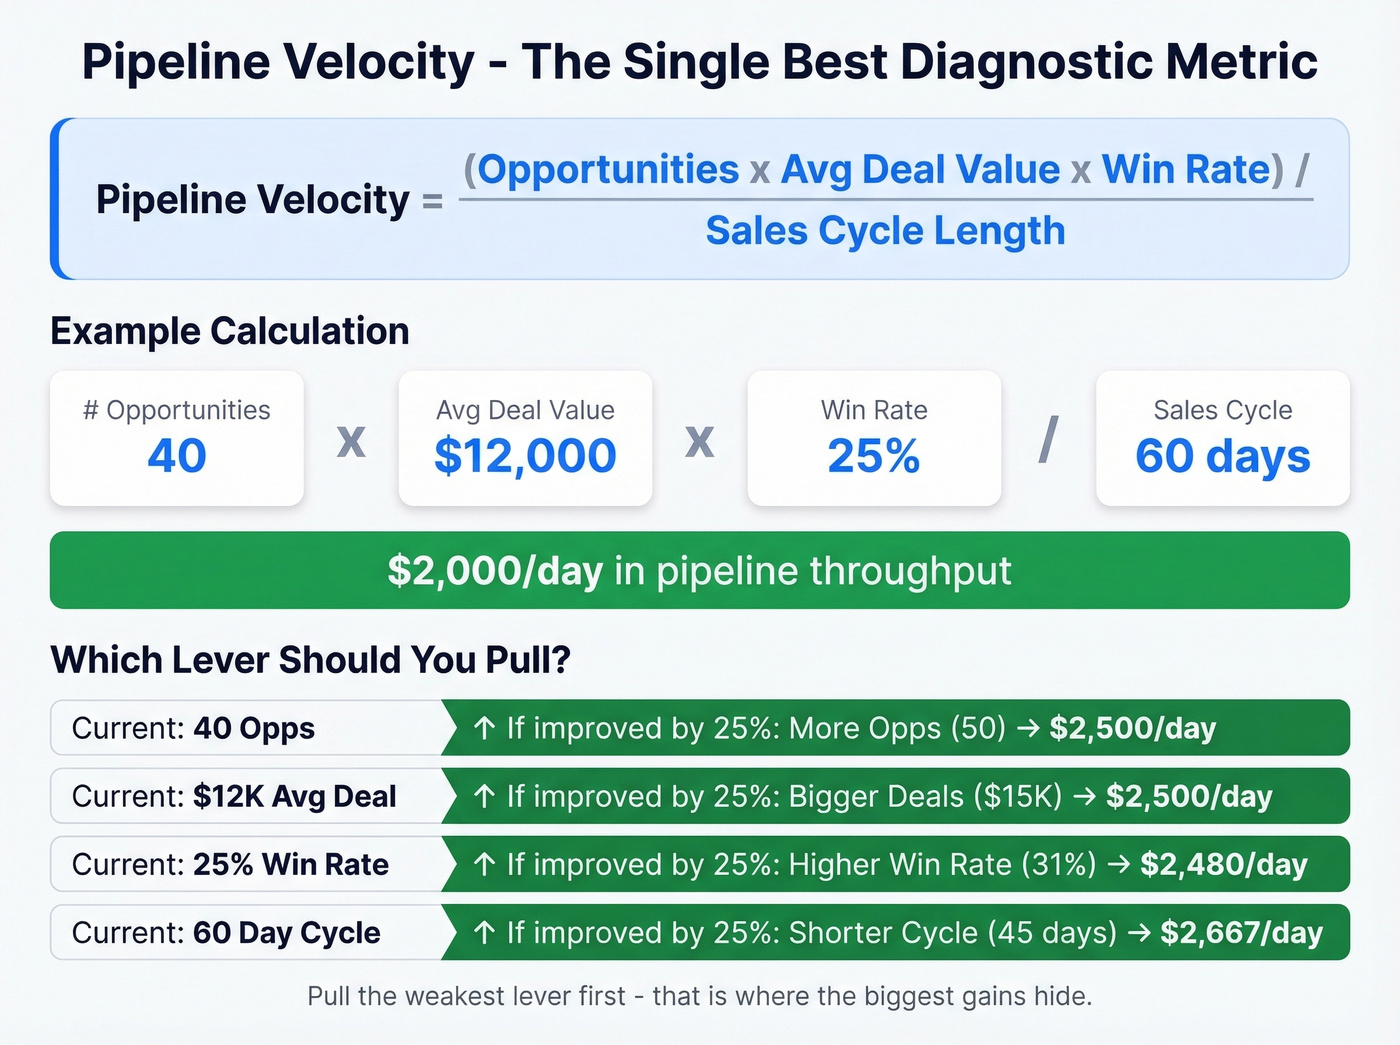
Pipeline Velocity = (# Opportunities x Average Deal Value x Win Rate) / Sales Cycle Length
Let's run the math. Your team has 40 qualified opportunities, average deal value of $12K, a 25% win rate, and a 60-day average cycle. That's (40 x $12,000 x 0.25) / 60 = $2,000/day in pipeline throughput. Now you can see which lever to pull - more opps, bigger deals, higher win rate, or shorter cycles.
Pipeline coverage should sit at 3-5x your target. But pipeline size is the most overrated metric in sales. A $5M pipeline with 75% of deals stalled in stage two is worth less than a $2M pipeline with validated next steps and real buyer engagement. Coverage matters only when the pipeline is real.
Conversion Metrics
| Metric | Target | Elite |
|---|---|---|
| Win rate | 20-30% | 35-40%+ |
| Meeting to opportunity | 25-40% | 40%+ |
| Speed-to-lead | < 1 hour | < 5 minutes |
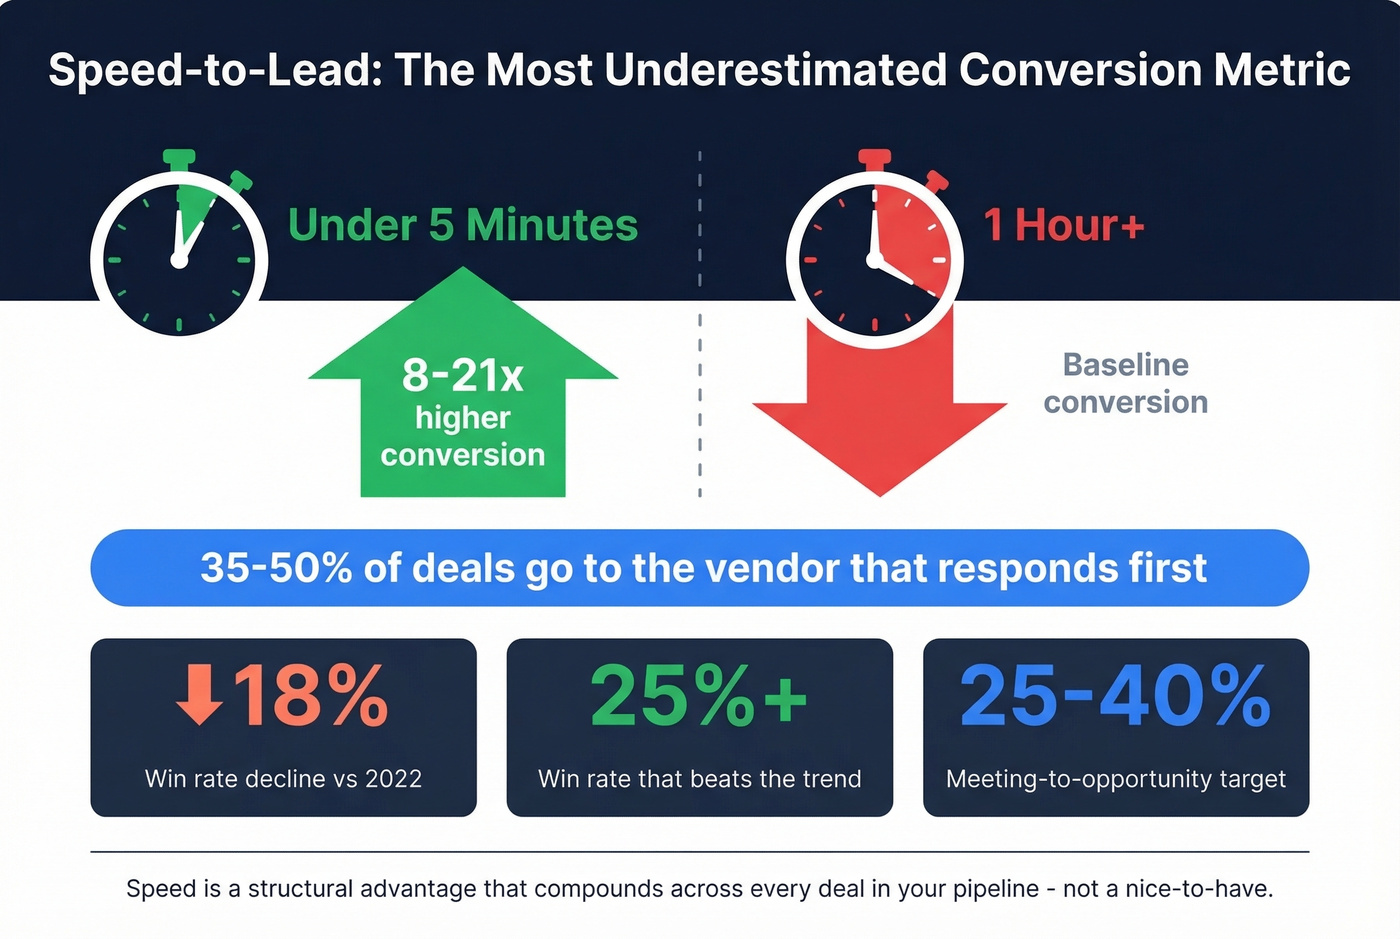
Win rates have declined 18% compared to 2022 - longer buying committees, tighter budgets, more competitive deals. If your win rate holds steady at 25%+, you're outperforming the trend.
Speed-to-lead is the conversion metric most teams underestimate. Responding within 5 minutes produces 8-21x higher conversion than waiting an hour, and 35-50% of deals go to the vendor that responds first. That's not a nice-to-have. It's a structural advantage that compounds across every deal in your pipeline.
Rep Efficiency Metrics
Sales cycles grew 16% in H1 2023 and 38% compared to 2021 before stabilizing. Average deal values decreased 21% over a similar timeframe. The math is brutal: longer cycles, smaller deals, same headcount costs.
Quota attainment hovers around 43% regardless of which benchmark you check - RepVue puts it at 43.5%, Fullcast at 43.14%. Fullcast's benchmarks found 76.6% of reps missed already-lowered quotas. If your team is above 50% attainment, you're beating the current baseline.
Track average deal size and cycle length together. They're connected. A shrinking deal size with a lengthening cycle is the worst combination, and when you spot that pattern, it's usually a qualification problem, not a closing problem.
Benchmark Summary
| Metric | Formula / Definition | Benchmark | Cadence | Coaching Tip |
|---|---|---|---|---|
| Conversations/day | Qualified two-way exchanges | SDR: 15-20; AE: 8-12 | Daily | Coach call quality, not volume |
| Time selling (%) | Selling hrs / total hrs | 30-35% avg; 40%+ target | Weekly | Audit admin/meeting load |
| Pipeline velocity | (Opps x Value x Win%) / Cycle | $2K+/day (varies) | Weekly | Pull the weakest lever |
| Pipeline coverage | Pipeline $ / quota $ | 3-5x | Weekly | Validate, don't inflate |
| Forecast accuracy | Forecast vs actual (%) | +/-10-15% | Monthly | Stage exit criteria |
| Win rate | Won / (Won + Lost) | 20-30% avg; 35%+ elite | Monthly | Review lost-deal patterns |
| Meeting to opp rate | Opps created / meetings | 25-40% | Weekly | Tighten qualification |
| Speed-to-lead | Time to first response | < 5 min best-in-class | Daily | Automate routing |
| Sales cycle length | Avg days, create to close | SMB: 14-30d; Ent: 60-120d | Monthly | Identify stall stages |
| Avg deal size | Total revenue / deals closed | SMB: $5-15K; Ent: $50K+ | Monthly | Watch for discounting |
| Quota attainment | Actual / quota (%) | 43% avg; 60%+ strong | Quarterly | Adjust quotas to reality |
| Ramp time | Days to first quota period | 4-8 weeks (SDR) | Quarterly | Onboarding content audit |
Productivity Metrics by Role
SDR Metrics
SDRs need a blend of activity and outcome metrics. Pure activity tracking creates "spray and pray" behavior - reps optimizing for volume at the expense of everything else. Pure outcome tracking ignores the ramp period where reps are building pipeline but haven't closed anything yet.
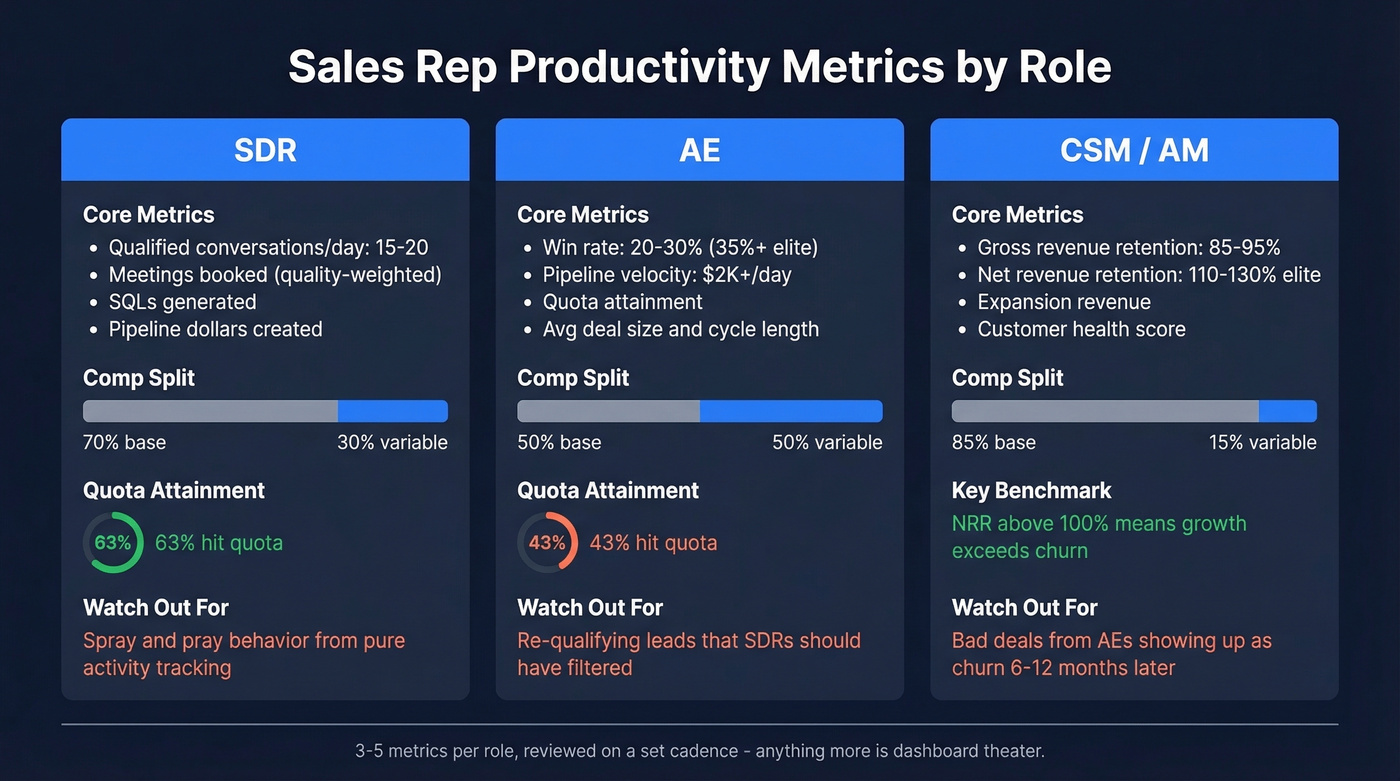
The core stack: qualified conversations per day (15-20), meetings booked (quality-weighted), SQLs generated, and pipeline dollars created. The comp split is typically 70/30 or 60/40 base-to-variable. About 63% of SDRs achieve quota - notably higher than AE attainment, partly because SDR quotas are set closer to realistic output.
Here's where data quality becomes a force multiplier. If half the list is dead data - bounced emails, disconnected numbers - your 15-20 daily conversations target becomes 30-40 dials for the same output. Prospeo's 98% email accuracy and 125M+ verified mobile numbers cut that waste at the source, so reps spend time talking instead of chasing ghosts.
AE Metrics
AEs are measured on bookings - ACV or TCV depending on your model. Secondary metrics include cycle length, deal size, and win rate. The median commission rate at 100% attainment runs about 11.5% of ACV in SaaS, with a 50/50 base-to-variable comp split.
The SDR-to-AE handoff is where metrics break down. Define "AE-ready" criteria using BANT or MEDDIC: budget authority confirmed, pain identified, timeline within 3-6 months, ICP fit validated. Companies with dedicated SDR teams convert leads at 40%, compared to under 5% without one. When AEs spend 30%+ of their time re-qualifying leads that should've been filtered upstream, it shows up as inflated cycle length and depressed win rates. That's a handoff problem, not a closing problem.
CSM / Account Manager Metrics
Primary metrics: gross revenue retention (GRR) and net revenue retention (NRR). Healthy GRR runs 85-95% depending on segment. NRR above 100% means expansion revenue exceeds churn - best-in-class SaaS companies hit 110-130%. Comp splits are heavily weighted toward base at 80/20 or 90/10.
Let's be honest: closing bad deals isn't productive. If AEs stuff unqualified accounts into the book of business to hit quota, it shows up 6-12 months later as churn. Connect deal quality at the top of the funnel to retention at the bottom, and you'll see why "quota attainment" without a quality filter is a dangerous metric.
If reps only sell 30% of the time, every minute spent hunting for bad contact data is a productivity killer. Prospeo delivers 98% accurate emails and 125M+ verified mobiles - so reps connect with real buyers instead of bouncing off dead addresses.
Stop measuring activity. Start measuring conversations that convert.
Metrics That Backfire
A LinkedIn poll on the most dangerous metric to obsess over returned telling results: 47% said CRM activity counts, 37% said pipeline size, 11% said meetings booked, and just 5% said revenue closed. Practitioners on r/sales describe a "tyranny of metrics" where orgs become "managed by numbers," optimizing for motion without impact.
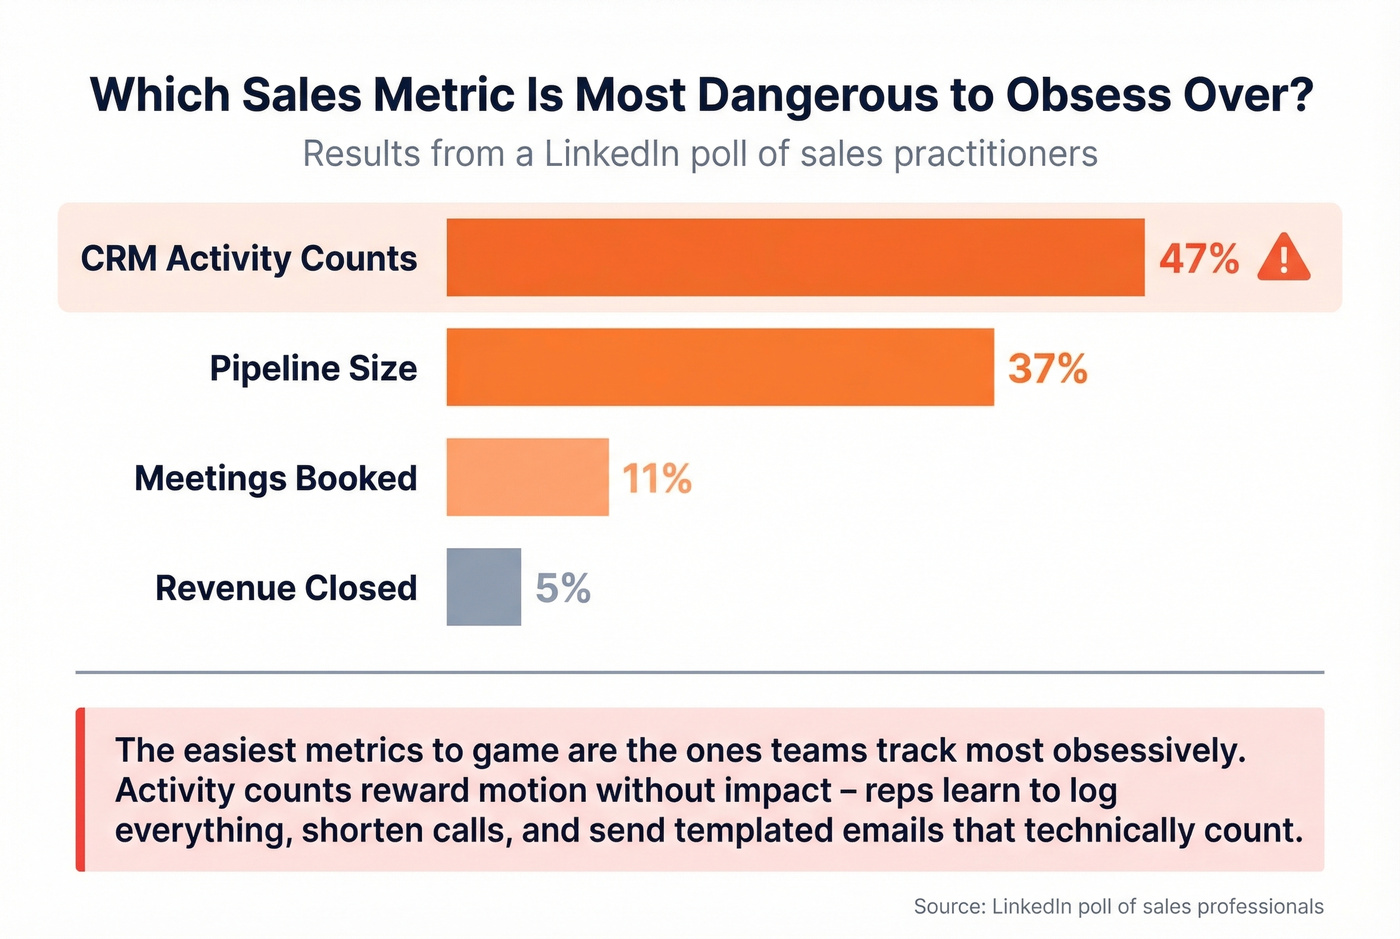
Activity counts are the easiest metrics to game. Reps learn to log everything, shorten calls, and send templated emails that technically count as "outreach" but generate nothing. Pipeline size is the second trap - as one practitioner put it, "75% of your sales pipeline is rubbish." Deals sit in stage two for months, inflating coverage ratios while contributing zero revenue.
The pattern is predictable. Every problem becomes a new KPI. Reps aren't booking enough meetings? Add a meetings KPI. Meetings aren't converting? Add a conversion KPI. Now you've got 15 metrics, nobody knows which ones matter, and you've created the "flavor of the week" trap where the team chases whatever the VP mentioned in the last all-hands. I've watched this cycle repeat at three different companies, and it always ends the same way: metric fatigue and a dashboard nobody opens.
The fix is tension metrics - pairing quantity with quality. Don't track calls made without tracking call-to-meeting conversion. Don't track pipeline created without tracking pipeline validity. Every volume metric needs a quality counterweight, or you're incentivizing the wrong behavior.
The Data Quality Multiplier
Every metric above assumes one thing: the underlying data is accurate. Bad contact data silently destroys the entire measurement system. If 35% of your emails bounce, your activity metrics are inflated, your pipeline is padded with contacts who'll never respond, and your conversion rates are artificially depressed because the denominator is full of ghosts.
Snyk's 50-person AE team was running bounce rates of 35-40% before switching to Prospeo. After the switch, bounces dropped to under 5%, AE-sourced pipeline jumped 180%, and the team generated 200+ new opportunities per month. That kind of improvement starts with trusting the numbers your team sees every day.
GreyScout saw a similar pattern: bounce rates went from 38% to under 4%, pipeline grew 140%, and rep ramp time was cut from 8-10 weeks to just 4. When the data feeding your metrics is refreshed every 7 days instead of the industry-average 6 weeks, every downstream number becomes trustworthy.
Skip this section if your bounce rates are already under 5% and your CRM data is fresh. For everyone else, data quality isn't a nice-to-have. It's the foundation everything else sits on.
Speed-to-lead under 5 minutes drives 8-21x higher conversion. That's impossible when reps are manually researching contacts. Prospeo's Chrome extension gives your team verified emails and direct dials in one click - from any website or CRM.
Cut list-building from 15 hours to 3. Your pipeline velocity will thank you.
Building Your Sales Productivity Dashboard
The CRM market hit $73.4B in 2024 and is growing at 14.6% annually - yet most dashboards built on those CRMs still track the wrong things. Salesforce recommends 3-4 metrics per goal. Beyond 5-7 visible reports per dashboard, adoption drops because reps stop looking at it.
Structure your dashboard around cadence tiers:
| Cadence | Who Reviews | What to Show |
|---|---|---|
| Daily | SDRs, AE frontline | Conversations, meetings booked, speed-to-lead |
| Weekly | AEs, managers | Pipeline velocity, win rate, coverage ratio |
| Monthly | Directors, VP Sales | Quota attainment, forecast accuracy, cycle length |
| Quarterly | CRO, executive team | Revenue per rep, ramp time, retention metrics |
The daily view should take 30 seconds to scan. The weekly view should prompt one coaching conversation. The monthly view should drive one strategic decision. If your dashboard doesn't map to actions at each cadence, it's a screensaver.
Don't track metrics you won't review. If nobody looks at "average email open rate" in the Monday standup, remove it. Dashboard clutter dilutes attention from the metrics that actually warrant action. Build role-specific views - an SDR doesn't need forecast accuracy, and a VP doesn't need daily dial counts. In our experience, the teams with the best dashboards aren't the ones with the most widgets. They're the ones where every single number triggers a specific action or conversation.
AI's Impact on Rep Productivity in 2026
88% of organizations now report regular AI use in at least one business function. McKinsey estimates that companies empowering sales teams through technology and automation see 10-15% efficiency uplifts, with genAI potentially unlocking $0.8-1.2 trillion in incremental productivity across sales and marketing.
The practical applications moving the needle right now: automated CRM entry (reclaiming some of those 14 wasted admin hours per week), genAI-powered coaching dashboards that surface call patterns and deal risks, and data enrichment that keeps contact records fresh without manual research. A European telco using a genAI coaching dashboard saw 20-30% improvement in customer satisfaction scores - proof that AI coaching translates to measurable outcomes.
But only 21% of commercial leaders report fully enabled enterprise-wide genAI adoption, and just 23% are scaling AI agents in production. The gap between "we use AI" and "AI meaningfully changes our metrics" is still enormous.
The teams seeing real lift connect AI to the metrics that matter: automated enrichment to improve data quality (which lifts every downstream number), AI coaching to improve conversion rates, and admin automation to increase time spent selling. The tool isn't the strategy. The metric improvement is.
FAQ
What's the most important sales rep productivity metric?
Pipeline velocity. It combines opportunity count, deal value, win rate, and cycle length into one diagnostic number. When velocity drops, you can immediately identify which of the four levers needs attention, making it the single best metric for both coaching and forecasting.
How many metrics should a sales team track?
Three to five per role, reviewed on a set cadence. Salesforce recommends 3-4 metrics per goal, and dashboard adoption drops sharply beyond 5-7 visible reports. Pick the ones that map directly to coachable actions and cut the rest.
What's a good win rate for B2B sales in 2026?
The average B2B win rate sits at 20-30%, while best-in-class teams hit 35-40%+. Win rates have declined 18% since 2022 due to longer buying cycles and tighter budgets. Consistently above 25% means you're outperforming the market.
How does bad data affect productivity measurement?
Bad contact data inflates activity metrics and depresses conversion rates at the same time - reps appear busy while reaching nobody. Teams that've cleaned up their data (cutting bounce rates from 35%+ down to under 5%) typically see pipeline jump 140-180% almost immediately, proving that clean data is the fastest fix for unreliable metrics.
What's the difference between leading and lagging sales metrics?
Leading metrics like calls made, emails sent, and meetings booked predict future outcomes and are directly coachable. Lagging metrics like revenue, quota attainment, and win rate measure past results. Effective dashboards track both - leading metrics daily, lagging metrics monthly and quarterly.