Sales Velocity: The Complete Guide With 2026 Benchmarks
Win rates have declined 18% since 2022. Sales cycles have stretched 38% compared to 2021. And 69% of reps missed quota in early 2024. If your pipeline feels slower than it used to, the math confirms it. Sales velocity is the single metric that captures all of this in one number - and most teams either aren't tracking it or are tracking it wrong.
What You Need (Quick Version)
- The formula: (Number of Opportunities x Average Deal Value x Win Rate) / Sales Cycle Length = Revenue per day
- What "good" looks like: SaaS median is $1,847/day. Professional services runs ~$876/day. Jump to the benchmarks section to find your industry.
- The #1 reason your number is wrong: Inconsistent stage definitions. If your team can't agree on what "qualified opportunity" means, the formula is garbage in, garbage out.
- The single highest-leverage fix: Shorten the sales cycle. It's the denominator. Even a modest reduction compounds across every deal in the pipeline.
What Is Sales Velocity?
It measures how much revenue your pipeline generates per day. Think of it as the speed of money through your funnel, distilled into a single number you can track weekly and act on immediately.
You'll see this called pipeline velocity, sales funnel velocity, or just "velocity" in RevOps conversations. They all mean the same thing. Don't confuse it with inventory velocity from supply chain - that's a different metric entirely.
Here's the critical distinction: this metric uses qualified opportunities, not raw leads. Counting every inbound form fill inflates the numerator and makes your velocity look healthier than it is. Only count opportunities that have passed your qualification threshold - whatever that threshold is, document it and stick to it.
The Formula Explained
Sales Velocity = (Number of Opportunities x Average Deal Value x Win Rate) / Sales Cycle Length
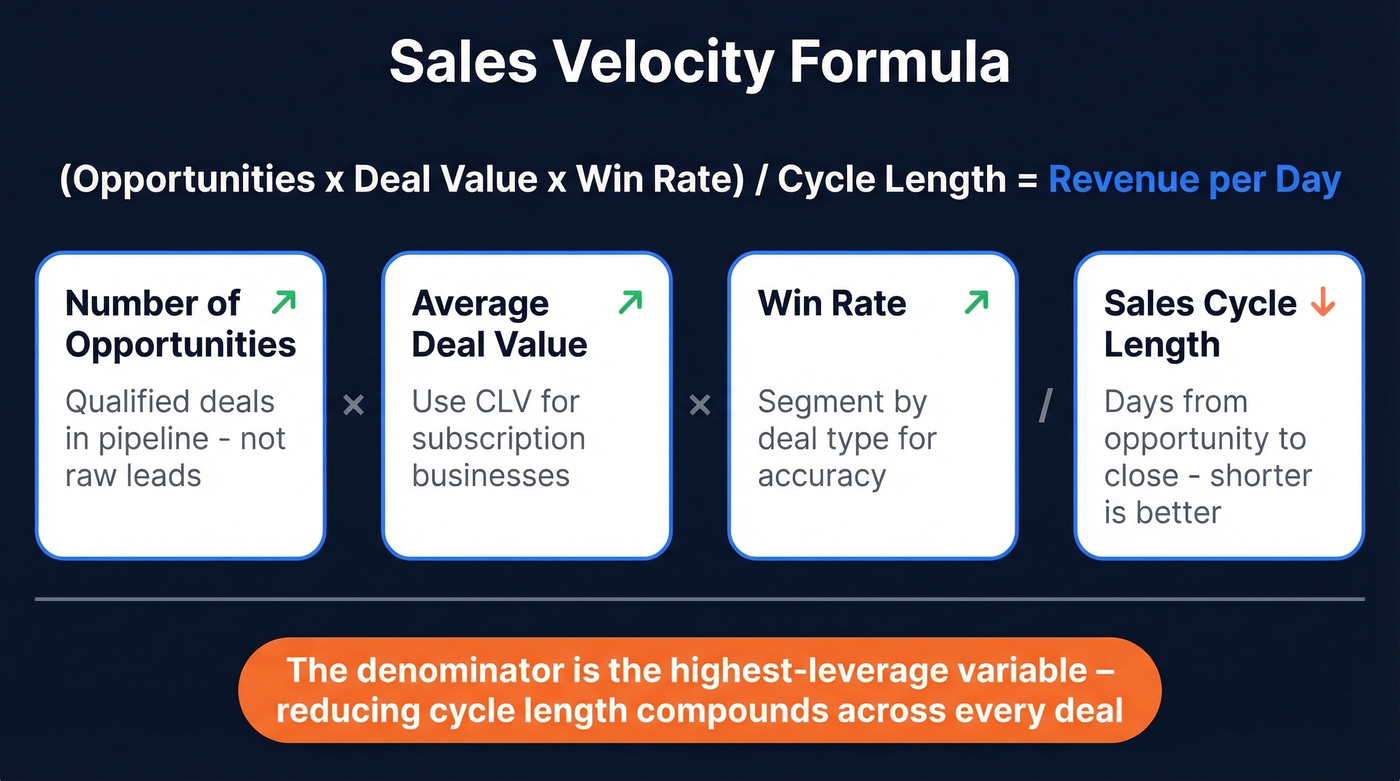
Three variables in the numerator, one in the denominator. That denominator matters more than most teams realize.
Number of Opportunities
This is the count of qualified opportunities entering your pipeline during the measurement period. Not leads. Not MQLs. Opportunities your team has accepted and is actively working. The tighter your qualification criteria, the more accurate your velocity reading - pumping raw lead counts into the formula gives you a vanity metric, not an actionable one.
Average Deal Value (+ CLV Variant)
For transactional sales, this is straightforward: the average closed-won deal size. For SaaS and subscription businesses, Pipedrive recommends substituting customer lifetime value (CLV) instead of first-year ACV. A $12,000 ACV deal with 3-year average retention is really a $36,000 deal, and your velocity should reflect that.
Win Rate
The percentage of opportunities that close won. Express it as a decimal in the formula, so 25% becomes 0.25. A common mistake: using overall win rate when you should be segmenting by deal type, region, or rep tier. Blended win rates hide problems.
Sales Cycle Length
The average number of days from opportunity creation to close. This is where most teams introduce errors - some measure from lead creation, others from first meeting, others from when the deal hits a specific stage. The consensus in RevOps communities is that consistency matters more than which starting point you pick. Document your definition and never change it mid-quarter.
Also keep your units consistent. If you're measuring cycle length in days, your velocity output is revenue per day. Mixing days and months is a surprisingly common spreadsheet error.
Worked Examples
Three scenarios to make the formula concrete.
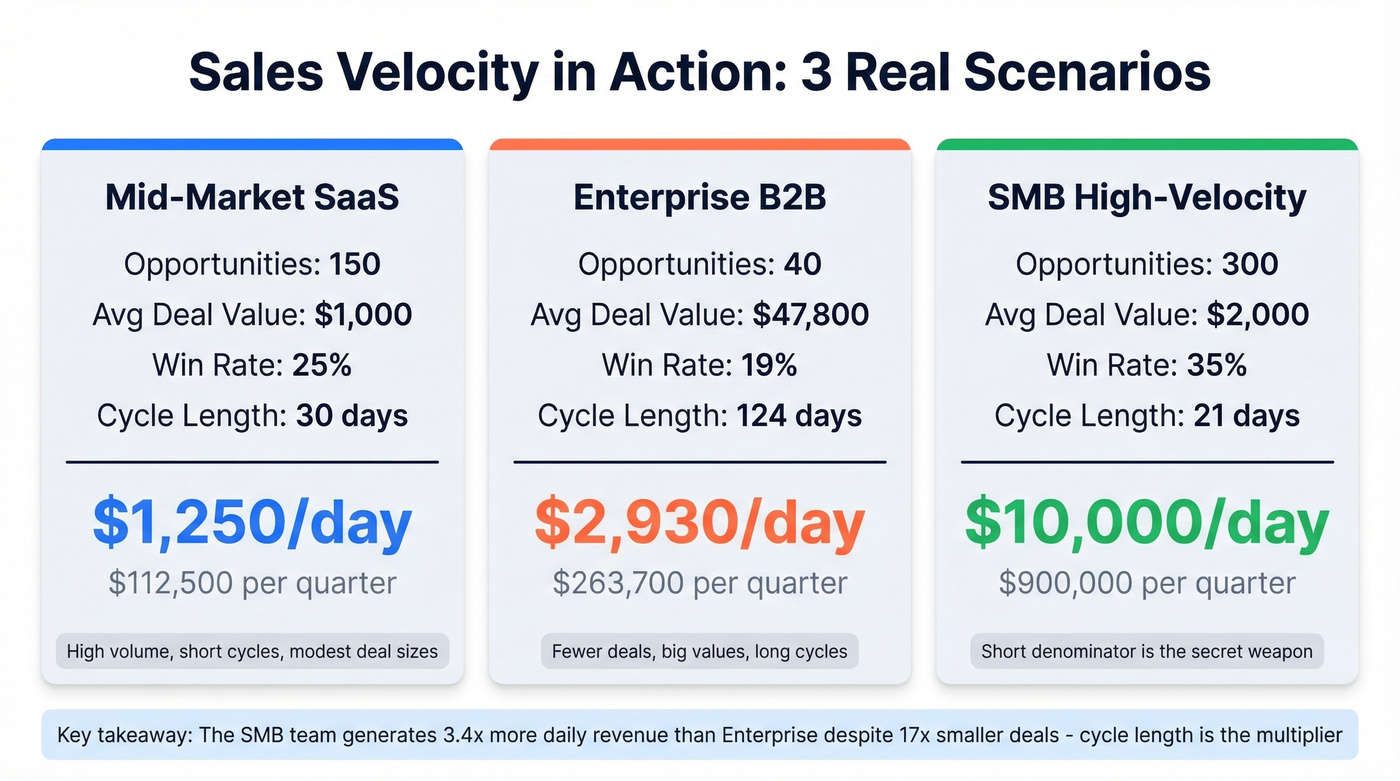
Mid-Market SaaS Team
150 opportunities x $1,000 average deal x 25% win rate / 30-day cycle = $1,250/day
Over a 90-day quarter, that's $112,500 in pipeline-generated revenue. This team has high volume and short cycles but modest deal sizes - velocity is driven by throughput.
Enterprise B2B
40 opportunities x $47,800 average deal x 19% win rate / 124-day cycle = ~$2,930/day
Fewer deals, much larger values, lower win rate, longer cycle. Despite working a fraction of the opportunities, this enterprise team generates higher daily revenue because deal size compensates. The risk: losing even two or three deals in a quarter dramatically shifts the number.
SMB / High-Velocity Sales
300 opportunities x $2,000 average deal x 35% win rate / 21-day cycle = $10,000/day
That's the power of a short denominator. A 21-day cycle with decent win rates and volume produces eye-catching results. The trap is assuming this scales linearly - at some point, opportunity quality degrades as you push volume higher.
Sales velocity lives and dies on opportunity quality. Pump unverified contacts into your pipeline and you inflate the numerator with deals that never close - tanking your win rate and stretching your cycle. Prospeo's 98% email accuracy and 30% mobile pickup rate mean your reps connect with real buyers, not dead ends. That's how Snyk's 50 AEs grew their pipeline 180% and added 200+ new opportunities per month.
Fix the inputs and the velocity formula fixes itself.
2026 Benchmarks by Industry
Benchmarks give you context, not targets. Your velocity depends on your market, deal size, and sales motion. Use these tables to understand where you sit relative to peers, then focus on the levers that matter for your specific situation.
Velocity by Industry
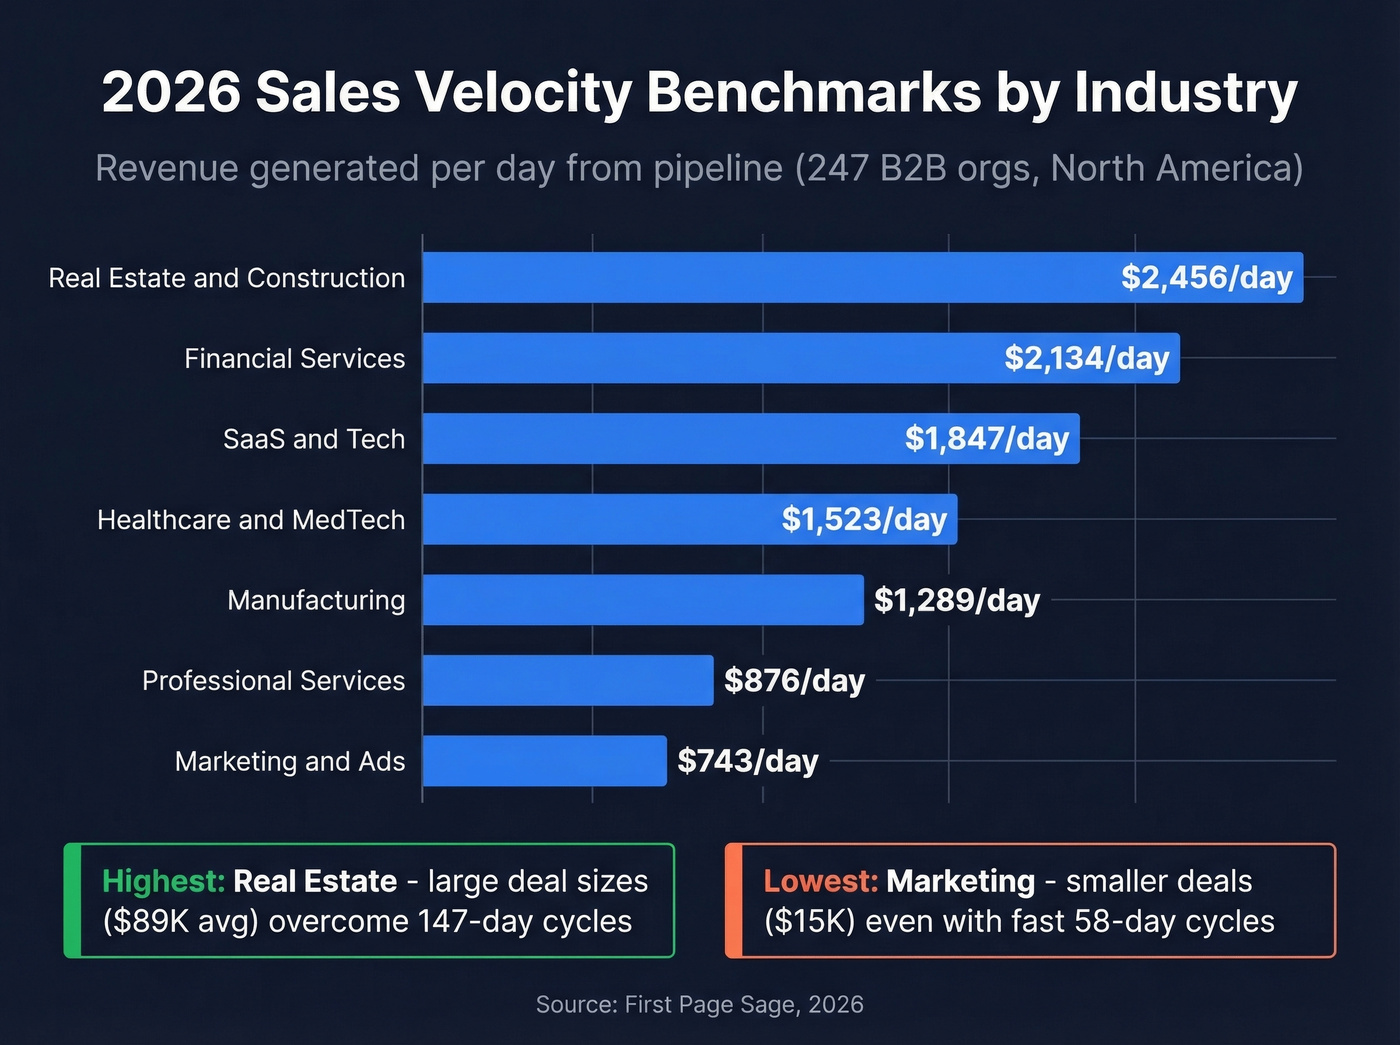
Data from a First Page Sage study of 247 B2B organizations in North America. Note: velocity figures incorporate opportunity volume per industry, which isn't shown in the table - so you can't derive the velocity column from the three visible variables alone.
| Industry | Deal Size | Win Rate | Cycle (Days) | Velocity |
|---|---|---|---|---|
| SaaS & Tech | $12,400 | 22% | 67 | $1,847/day |
| Financial Services | $31,200 | 18% | 89 | $2,134/day |
| Healthcare/MedTech | $18,700 | 25% | 72 | $1,523/day |
| Manufacturing | $47,800 | 19% | 124 | $1,289/day |
| Professional Svcs | $8,900 | 28% | 51 | $876/day |
| Real Estate/Constr | $89,300 | 16% | 147 | $2,456/day |
| Marketing/Ads | $15,200 | 24% | 58 | $743/day |
Real estate and construction shows the highest velocity despite the longest cycles - deal size does the heavy lifting. Marketing and advertising has the lowest velocity, driven by smaller deal sizes even with relatively fast cycles.
Velocity by Company Size
| Company Revenue | Avg Velocity |
|---|---|
| $1M-$5M | $687/day |
| $5M-$25M | $1,303/day |
| $25M-$100M | $3,484/day |
| $100M-$500M | $6,919/day |
| $500M+ | $12,945/day |
The jump from $25M to $100M revenue is where velocity really accelerates - larger deal sizes and more mature sales operations compound together.
Sales Cycle Benchmarks
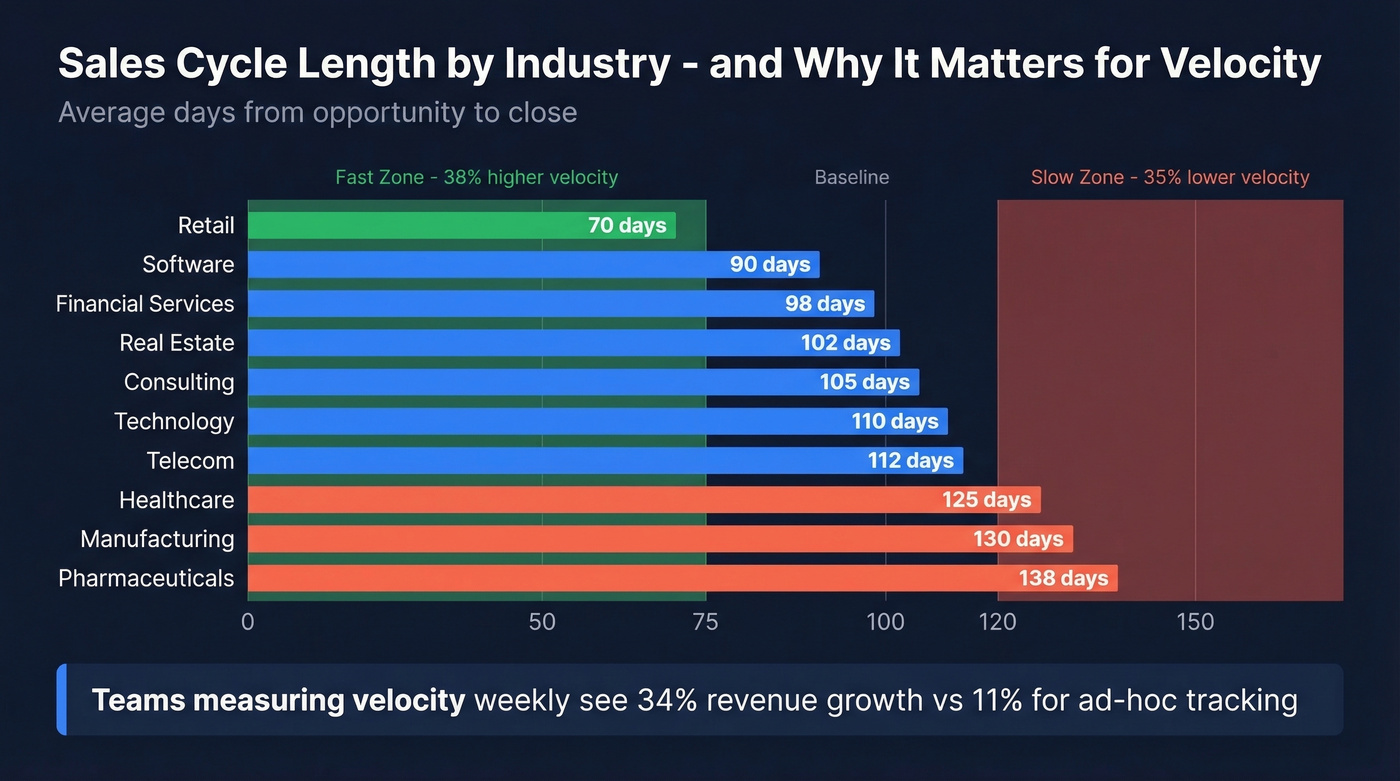
Average cycle length by industry:
| Industry | Avg Cycle (Days) |
|---|---|
| Retail | 70 |
| Software | 90 |
| Financial Services | 98 |
| Real Estate | 102 |
| Consulting | 105 |
| Technology | 110 |
| Telecom | 112 |
| Healthcare | 125 |
| Manufacturing | 130 |
| Pharmaceuticals | 138 |
Teams with cycles in the 30-45 day range see 38% higher velocity compared to the 76-90 day baseline. Cycles over 120 days correlate with 35% lower velocity. The denominator is ruthless.
Cycle Length by Company Size
This data rarely gets published, which is why most velocity calculators miss it.
| Company Size (Employees) | Avg Cycle (Days) |
|---|---|
| 1-10 | 38 |
| 11-50 | 57 |
| 51-200 | 77 |
| 201-500 | 95 |
| 501-1,000 | 115 |
| 1,001-5,000 | 135 |
| 10,001+ | 185 |
The pattern is clear: every order-of-magnitude increase in headcount adds roughly 30-40 days to the cycle. If you're selling into enterprises with 10,000+ employees and your cycle is under 120 days, you're doing something right. If it's over 200, you're probably normal - but there's room to improve.
Deal size tells a similar story. Deals under $1,000 close in about 25 days. Deals over $500,000 average 270 days. That 10x increase in deal size buys you roughly a 10.8x increase in cycle length - which is why bigger deals don't always produce higher velocity.
Win Rate Benchmarks
Win rates vary dramatically by sales model, per Monday.com's analysis:
- Enterprise software: 20-30%
- Complex B2B sales: 15-25%
- Transactional B2C: 50-60%
- Average B2B: 28%
If your win rate is significantly below these ranges, the problem usually isn't your closers. It's qualification. You're letting bad opportunities into the pipeline.
SaaS ACV-to-Cycle Rules of Thumb
Jason Lemkin's widely-cited benchmarks from SaaStr:
| ACV | Expected Cycle |
|---|---|
| < $2,000 | ~14 days |
| < $5,000 | ~30 days |
| < $25,000 | ~90 days |
| < $100,000 | 90-180 days |
| > $100,000 | 3-9 months |
| > $500,000 | 6-18+ months |
If your cycle is significantly longer than these ranges for your ACV tier, something in your process is creating friction. For reference, Gong's customer base averages a $97k deal size with a 69-day cycle - faster than the rule of thumb would suggest, which tells you optimization is possible even at the high end.
One more stat that should change how you think about tracking cadence: teams that measure velocity weekly see 34% revenue growth and 87% forecast accuracy. Teams tracking ad-hoc? 11% growth and 52% accuracy. Weekly measurement isn't optional.
Why Your Number Is Probably Wrong
Most teams that calculate velocity get a number that looks reasonable but is actually misleading. Here are the six most common reasons.
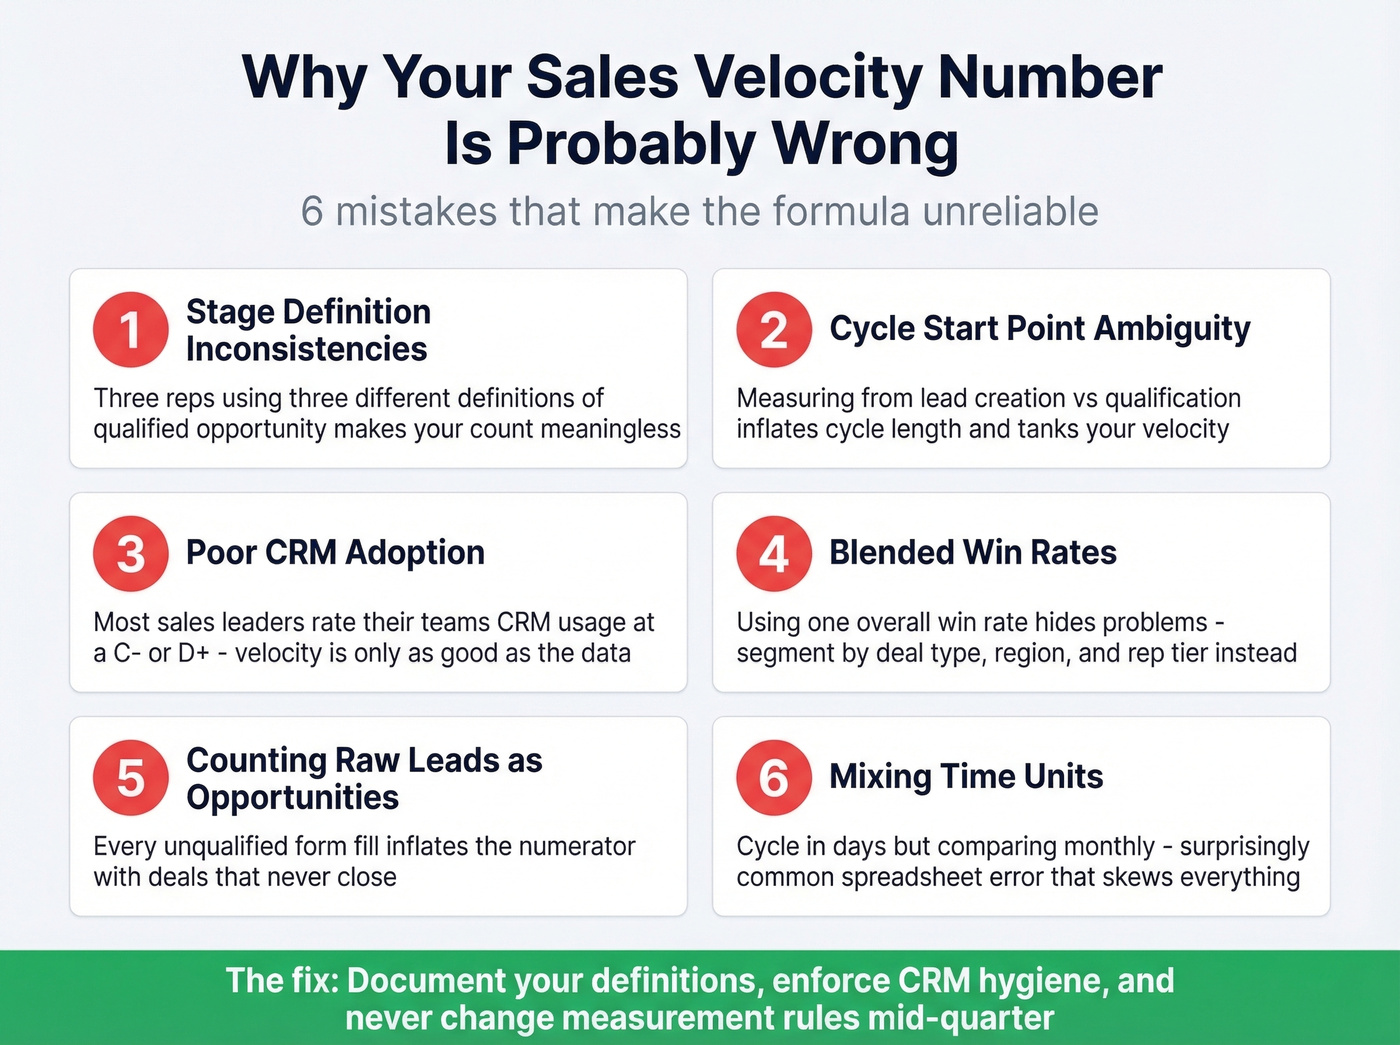
1. Stage definition inconsistencies. What counts as an "opportunity" on your team? Is it when a meeting is booked? When discovery is complete? When a champion is identified? If three reps use three different definitions, your opportunity count is meaningless. Same goes for "proposal sent" - does that mean a formal SOW, a pricing email, or a verbal quote on a call?
2. Cycle start point ambiguity. Some CRMs default to the opportunity created date. Others use the date it entered a specific stage. If you're measuring from lead creation rather than qualification, your cycle length is artificially inflated and your velocity looks worse than reality. Pick one. Stick with it.
3. CRM adoption problems. We've seen this pattern repeatedly: leadership asks for velocity metrics, RevOps pulls the data, and the numbers look bizarre because reps aren't updating stages consistently. The team at LLR Partners put it bluntly - most sales leaders would rate their team's CRM usage at a "C- or D+." Velocity is only as good as the data feeding it.
4. Blended vs. segmented velocity. A single velocity number across your entire pipeline is almost useless. Enterprise wins with 6-month cycles mask the fact that your SMB motion is collapsing. Segment by deal size tier, sales motion, region, or rep cohort. The blended number is for board decks. The segmented numbers are for actually fixing things.
5. Outlier skew. One $500k deal that took 14 months to close will wreck your averages. Use medians, not means. This is especially critical for teams with fewer than 50 closed deals per quarter - a single outlier can swing velocity by 30%+.
6. Insufficient baseline timeline. If your average cycle is 6-12 months, you need 12-18 months of clean data before your velocity baseline is trustworthy. Teams that implement velocity tracking and try to draw conclusions after one quarter are reading noise, not signal.
Let's make this concrete. It's Thursday afternoon, your VP of Sales pulls up the pipeline review, and the velocity chart shows a 15% drop. Is it real? Or did someone bulk-update 40 opportunities yesterday and change the stage definitions? If you can't answer that question in under two minutes, your dashboard isn't ready.
How to Improve Sales Velocity
You have four levers. Here's each one with specific tactics, then a look at how they interact.
Increase Qualified Opportunities
More opportunities in the numerator means higher velocity - but only if they're real. An SDR team generating 200 "opportunities" per month sounds impressive until you realize half of those contacts bounce on the first email or go to voicemail on a disconnected number. That's not pipeline. That's noise dressed up as pipeline.
The fix starts at the data layer. If your reps are working with stale emails and dead phone numbers, your opportunity count is inflated with prospects who'll never respond. Prospeo's 98% email accuracy and 125M+ verified mobile numbers (with a 30% pickup rate) mean every opportunity in your formula represents someone your team can actually reach, and the 7-day data refresh cycle keeps contacts current rather than decaying between quarterly list pulls.

Beyond data quality, focus on channel diversification. Referrals close in 20 days versus 60 days for cold outbound - that's a 3x speed advantage. Build referral programs alongside your outbound motion.
Increase Average Deal Size
Upselling and cross-selling existing pipeline is easier than finding new pipeline. Train reps to multi-thread into additional departments during discovery. With an average B2B buying committee of 6.3 stakeholders, there are almost always adjacent budget holders who can expand the deal.
Bundle pricing strategically. If a prospect needs your core product, package it with implementation services or an expanded license tier. The goal isn't to inflate deal size artificially - it's to capture the full value of the problem you're solving.
Improve Win Rate
Win rate improvements come from two places: better qualification at the top and better execution in the middle.
On qualification, be ruthless. If a deal doesn't have a confirmed budget, an identified decision-maker, and a timeline, it shouldn't be in your pipeline. Every unqualified deal drags down your win rate and makes velocity look worse.
On execution, invest in sales enablement. Reps spend roughly 30% of their time actually selling. The other 70% goes to admin, internal meetings, and content searching. AI-driven automation can reclaim up to 20% of that lost capacity - which translates directly into more selling time and higher win rates. Every percentage point you shift from admin to selling shows up in the formula.
Shorten the Sales Cycle
This is the highest-leverage move. Because cycle length is the denominator, reducing it amplifies everything else. A team that cuts their cycle from 90 days to 60 days gets a 50% velocity increase - without changing a single other variable.
Here's the thing: most teams obsess over the numerator - more pipeline, bigger deals, higher win rates - while ignoring the denominator. That's backwards. If your average contract value sits below $25k, you should be spending 80% of your optimization energy on sales process optimization. The math favors it, and it's usually the easiest lever to move because so much cycle bloat comes from process friction, not buyer hesitation.
58% of B2B professionals report cycles have gotten longer over the past year. You're swimming against the current. The teams winning this fight focus on two things: removing friction from the buying process and ensuring reps aren't wasting time on dead contacts. Stale data doesn't just reduce connect rates - it adds days or weeks to every deal as reps loop back to find updated information.
On process friction, map your buyer's journey and identify where deals stall. Is it legal review? Procurement? Technical evaluation? Each bottleneck is a cycle-shortening opportunity. Skip this exercise if you don't have at least 6 months of stage-level data in your CRM - you'll be guessing, not diagnosing.
The Compounding Flywheel
Not all levers are created equal, and they don't operate in isolation. Take the mid-market SaaS example from earlier at $1,250/day. What happens with a 10% improvement to each lever?
| Lever | Change | New Velocity | Impact |
|---|---|---|---|
| +10% Opportunities | 150 -> 165 | $1,375/day | +$125/day |
| +10% Deal Size | $1K -> $1.1K | $1,375/day | +$125/day |
| +10% Win Rate | 25% -> 27.5% | $1,375/day | +$125/day |
| -10% Cycle Length | 30 -> 27 days | $1,389/day | +$139/day |
Mathematically, a 10% cycle reduction produces slightly more impact than a 10% improvement in any numerator variable. In practice, the gap is even larger because shortening cycles also frees rep capacity to work more deals - creating a flywheel where each improvement compounds into the next. Shorter cycles mean reps handle more opportunities, which increases volume, which builds momentum across the entire team. In our experience, cycle reduction is where most teams see the fastest ROI.
The fastest way to shorten your sales cycle - the denominator that crushes velocity - is reaching decision-makers directly. Prospeo gives you 125M+ verified mobile numbers and 143M+ verified emails, refreshed every 7 days. Layer in buyer intent data across 15,000 topics to prioritize prospects already in-market. Teams using Prospeo book 26% more meetings than ZoomInfo users, at $0.01 per email.
Shrink your cycle length by talking to the right people on day one.
Building a Velocity Dashboard
A velocity formula on a spreadsheet isn't a dashboard. Here's what you actually need.
Required CRM Fields
Before you build anything, make sure these fields exist and are consistently populated:
- Opportunity created date
- Close date (won or lost)
- Deal amount
- Stage + stage history (not just current stage)
- Win/loss outcome
- Segment tag (SMB / mid-market / enterprise)
If your CRM doesn't have stage history, you can't accurately calculate cycle length. Fix this first.
Dashboard Configuration
Use a rolling 90-day window for stability. Shorter windows introduce too much volatility, especially for teams closing fewer than 30 deals per month. Set up automated alerts when velocity drops more than 10% week-over-week - that's your early warning system.
Document your segment definitions explicitly. What revenue range defines "SMB" vs. "mid-market"? If someone changes the definition six months from now, your historical comparisons break. Version your definitions.
We've found that teams with fewer than 20 monthly closes need a 120-day rolling window minimum. Anything shorter and you're reacting to statistical noise rather than real trends.
Weekly Report Template
| Component | This Week | Last Week | 90-Day Avg |
|---|---|---|---|
| Opportunities | - | - | - |
| Win Rate | - | - | - |
| Avg Deal Size | - | - | - |
| Cycle (Days) | - | - | - |
| Velocity | - | - | - |
Fill this in every Monday morning. The 90-day average column is your baseline - it smooths out weekly noise and gives you a trend line.
Edge Cases to Watch
Use medians instead of means for deal size and cycle length. A single outlier deal can swing your average by 20%+ in a small sample.
For teams with fewer than 20 closed deals per month, consider extending your rolling window to 120 or even 180 days. And watch for small sample volatility in segment-level views - if your enterprise segment closes 3 deals per quarter, weekly velocity for that segment is meaningless. Report it quarterly instead.
Where Velocity Fits Your Stack
Sales velocity is a diagnostic metric. It tells you something is wrong and points you toward which lever to investigate. But it doesn't work in isolation.
Pipeline coverage ratio measures whether you have enough pipeline to hit quota. Most high-performing teams target 3-4x coverage. If coverage is healthy but velocity is low, the problem is execution, not volume.
Stage-by-stage conversion rates tell you where deals are dying. If your demo-to-proposal conversion is 80% but proposal-to-close is 15%, you've found your bottleneck. Velocity alone won't surface this.
Lead response time matters most for inbound. Time kills deals, and the data consistently shows that responding within 5 minutes versus 30 minutes dramatically changes conversion rates.
Revenue per rep is the capacity metric. If velocity is rising but revenue per rep is flat, you're adding headcount faster than you're improving efficiency.
Think of velocity as the speedometer. Coverage is the fuel gauge. Stage conversion is the diagnostic readout. You need all of them, but velocity is the number you check first every Monday morning.
FAQ
What's a good sales velocity?
SaaS median is $1,847/day; professional services averages ~$876/day; manufacturing sits at $1,289/day despite larger deal sizes because 124-day cycles drag the denominator. Use the benchmark tables above to find your peer group, then segment by deal size tier for a more accurate comparison.
Is pipeline velocity the same thing?
Yes. Sales velocity, pipeline velocity, and sales funnel velocity all refer to the same metric - revenue generated per day from your active pipeline. Different vendors use different terms, but the formula is identical.
How often should I measure it?
Weekly. Teams tracking weekly see 34% revenue growth and 87% forecast accuracy, compared to 11% growth and 52% accuracy for ad-hoc tracking. Build it into your Monday pipeline review with a rolling 90-day window for stability.
Can it be negative?
No. All four inputs are positive numbers by definition. A zero reading means zero qualified opportunities or a 0% win rate - both signal a pipeline emergency, not a math error. If your dashboard shows a negative number, check for data entry errors.
How do I fix velocity when contact data is bad?
Bad data inflates your opportunity count with unreachable prospects, dragging down win rate and stretching cycles as reps chase dead ends. Verify emails and direct dials before they enter the pipeline. Cleaning up contact data is one of the fastest ways to restore pipeline momentum - our team has seen bounce rates drop from 35%+ to under 4% just by switching to verified contact sources.