Scenario-Based Forecasting: The Practitioner's Playbook
96% of teams still run their forecasts entirely in spreadsheets. One CFO on Reddit described the experience as "47 tabs and praying nothing breaks." We've been there - and the spreadsheet isn't even the real problem.
Scenario-based forecasting doesn't fail because the methodology is flawed. It fails because the inputs are garbage.
What You Need (Quick Version)
- Use driver-based models, not static spreadsheets. Organizations using driver-based forecasting rate their forecasts as good or great 77% of the time, versus 38% for those that don't.
- Build 2 or 4 scenarios - not 3. Three scenarios create a "middle child" everyone defaults to. Two forces a real strategic choice; four covers enough ground without paralysis.
- If you have fewer than 400 historical opportunities, don't build sales scenarios yet. You're fitting noise, not signal.
What This Discipline Actually Is
Shell's planning team built this discipline in the late 1960s. When crude oil sat at $4/barrel, Pierre Wack and his colleagues - influenced by Herman Kahn's work at RAND - built scenarios that included a world where OPEC restricted supply. In 1973, oil prices quadrupled to $16/barrel in weeks. Shell wasn't surprised. Everyone else was.
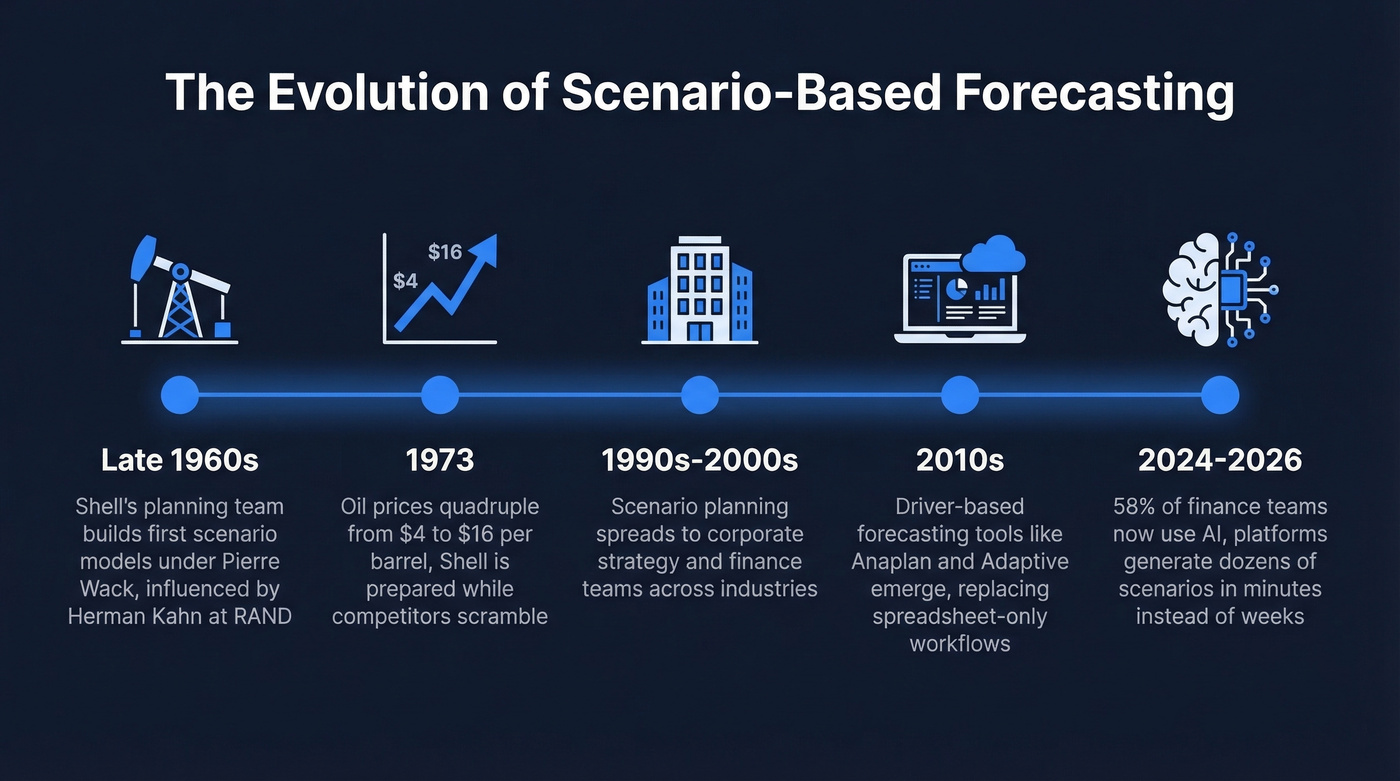
The point wasn't prediction. It was changing decision-makers' mental models so they could act faster when reality shifted. Scenario-based forecasting replaces the single-point "we'll hit $12M this quarter" prediction with multiple internally consistent narratives, each carrying different assumptions about win rates, deal velocity, and market conditions. That's why scenario planning for sales has become a core discipline in modern RevOps - not just a finance exercise.
How to Build Scenario-Based Forecasts
Most sales forecast scenario planning guides give you theory. Here are the five steps that produce usable output.
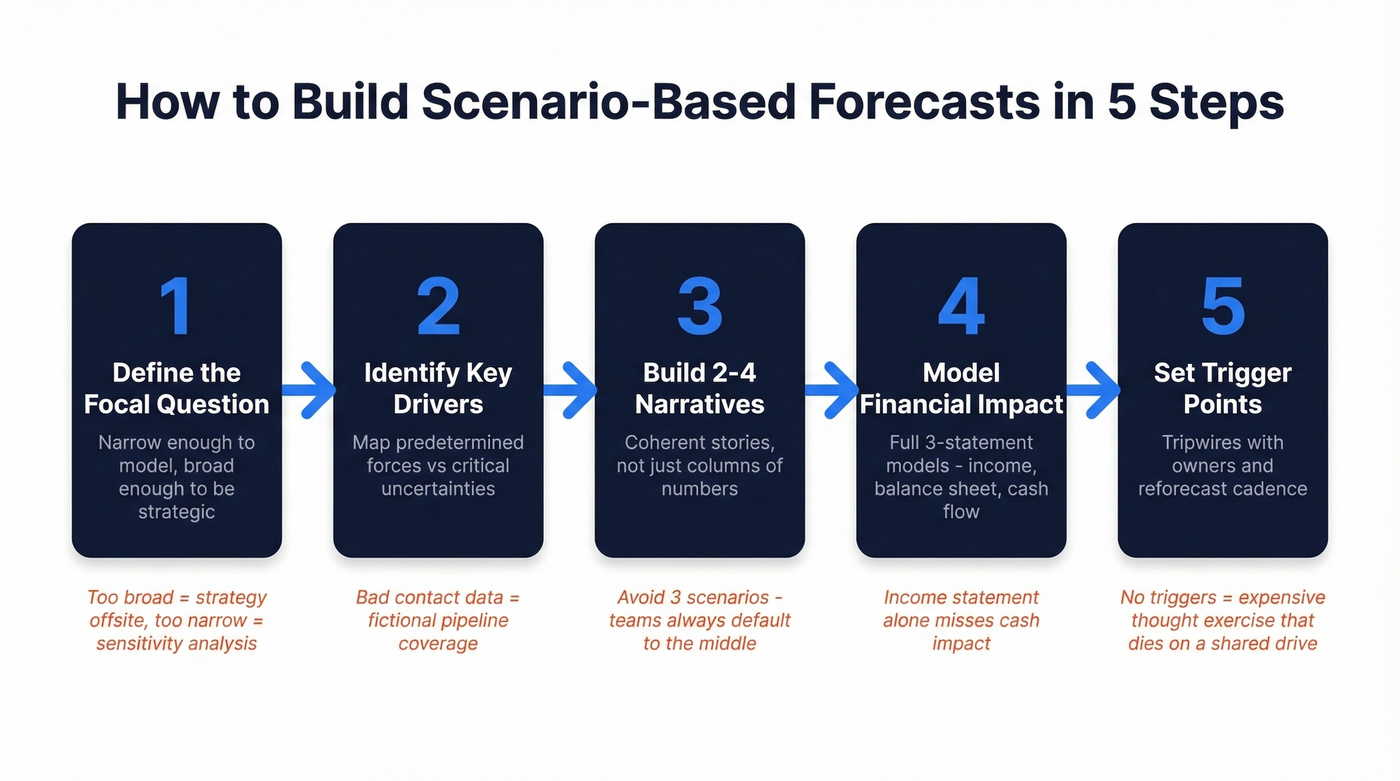
Step 1: Define the Focal Question
Start narrow enough to be actionable, broad enough to be strategic. "What happens to our revenue if the economy slows?" is too vague. "What's our Q3 pipeline coverage under different enterprise win-rate assumptions?" - that you can model.
Too broad and you get a strategy offsite exercise. Too narrow and you've built a glorified sensitivity analysis.
Step 2: Identify Key Drivers
This is where most teams cut corners - and where the model lives or dies.
Map the predetermined forces versus critical uncertainties that shape your focal question. Predetermined forces like demographic trends and existing contracts form the backdrop. Critical uncertainties like competitive moves, budget freezes, and regulatory shifts become your scenario axes.
Here's the thing most guides skip: those pipeline numbers are only real if the underlying contact data is real. We've seen teams where bounce rates above 30% meant their pipeline coverage ratios were pure fiction - phantom opportunities inflating every scenario. Cleaning up contact data with a tool like Prospeo (98% email accuracy, 7-day refresh cycle) turned one team's pipeline from wishful thinking into something they could actually model against.
Step 3: Build 2-4 Consistent Narratives
Each scenario needs to be a coherent story, not just a column of numbers. "Downside" isn't "everything goes wrong simultaneously." It's a specific narrative: budget freezes extend deal cycles, a new competitor enters your segment, and your mid-market conversion drops while enterprise holds steady. Best case worst case forecasting only works when each end of the spectrum is internally consistent and grounded in real driver assumptions.
We've watched three different RevOps teams build 3 scenarios and default to the middle one within a week. Build two to force a real choice, or four to cover enough strategic ground.
Step 4: Model Financial Implications
Each scenario needs a full financial model - income statement, balance sheet, and cash flow. A common requirement in FP&A tool evaluations is 3-statement support, because modeling only the income statement misses what happens to cash. Your revenue forecasting scenarios should connect top-line assumptions to bottom-line impact so leadership can see the full picture.
Step 5: Set Trigger Points
This step separates the teams that actually use their scenarios from the ones that let them rot on a shared drive.
Every scenario needs a tripwire. "If enterprise win rates drop below 22% for two consecutive months, we activate the downside playbook." Assign an owner to each trigger. Set a reforecast cadence - monthly at minimum, weekly during disruption. Nearly 25% of FP&A teams reforecast daily or weekly during volatile periods. Without trigger points, assigned owners, and a reforecast cadence, you've built an expensive thought exercise that'll be forgotten by next quarter.
Scenario-based forecasts collapse when 30%+ of your pipeline contacts bounce. Prospeo's 98% email accuracy and 7-day data refresh cycle mean your pipeline coverage ratios reflect real opportunities - not phantom deals inflating every scenario you build.
Stop modeling against fictional pipeline. Start with verified data.
Worked Example: Sales Forecast Scenario Analysis
These are the scenario ranges for an enterprise sales team, adapted from Outreach's forecasting framework:
| Metric | Downside | Expected | Upside |
|---|---|---|---|
| Win rate | 20-22% | 28% | 32-35% |
| Deal velocity | 109-122 days | 87 days | 61-70 days |
| Win rate shift | -20 to -30% | Baseline | +15 to +25% |
| Cycle shift | +25 to +40% | Baseline | -20 to -30% |
You want 400+ historical opportunities per forecast segment and at least one year of complete data before these ranges mean anything. With fewer records, you're pattern-matching on noise.
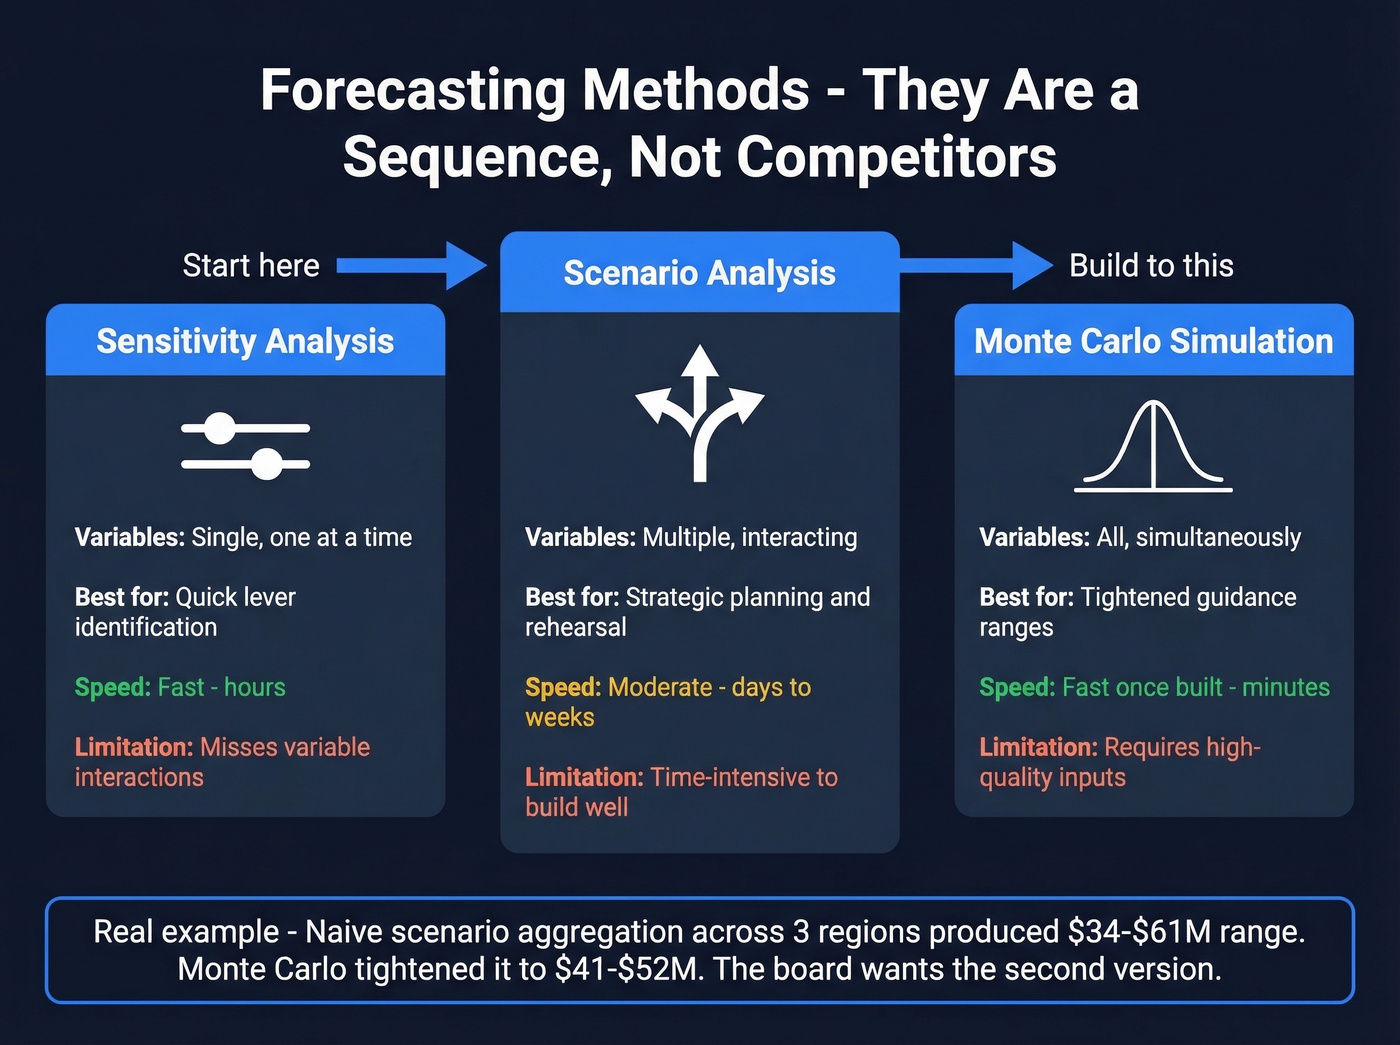
Scenarios vs Sensitivity vs Monte Carlo
These three methods aren't competitors - they're a sequence.
| Method | What It Does | Variables | Best For | Limitation |
|---|---|---|---|---|
| Sensitivity | One input at a time | Single | Quick lever ID | Misses interactions |
| Scenario | Coherent narratives | Multiple, interacting | Strategic planning | Time-intensive |
| Monte Carlo | Probability distributions | All, simultaneously | Tightened guidance | Requires good inputs |
A Minitab worked example shows why the sequence matters: naive scenario aggregation across three regions produced a range of $34-$61M. Running Monte Carlo tightened the 10th/90th percentile band to roughly $41-$52M. The board wants the second version. Scenario-based projections give you the strategic narratives; Monte Carlo gives you the confidence intervals.
Five Mistakes That Kill Scenario Planning
1. Treating scenarios as predictions. The moment someone asks "which scenario is most likely?" the exercise has failed. Scenarios are strategic rehearsals, not forecasts.
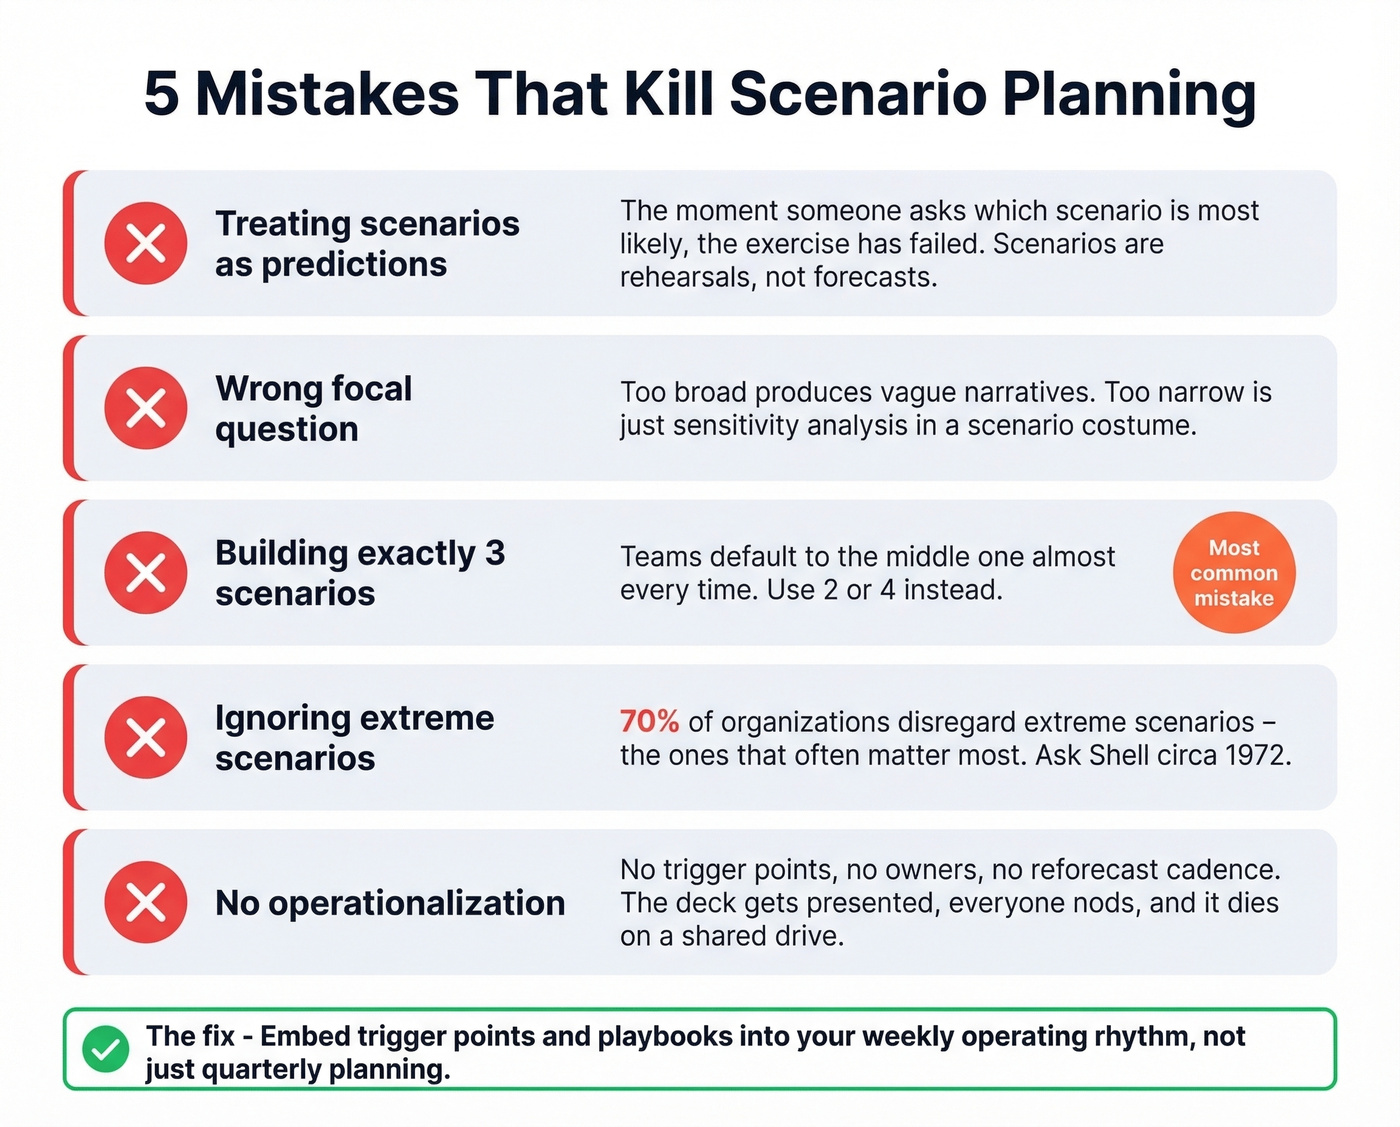
2. Wrong focal question. Too broad produces vague narratives nobody can model. Too narrow is just sensitivity analysis wearing a scenario costume.
3. Building exactly three scenarios. Teams default to the middle one almost every time. We've seen it happen three times in the last year alone, and the "expected" case always wins by inertia.
4. Ignoring extreme scenarios. 70% of organizations disregard extreme scenarios. The scenarios that feel implausible are often the ones that matter most - ask Shell circa 1972.
5. No operationalization. The scenario deck gets presented, everyone nods, and it dies on a shared drive. Effective scenario planning for sales forecasting requires embedding trigger points and playbooks into your weekly operating rhythm, not just your quarterly planning cycle.
Tools for Forecast Scenario Planning
Start in Excel with a driver-based template. When you outgrow it - and you will within one quarter - evaluate Runway or Pigment first.
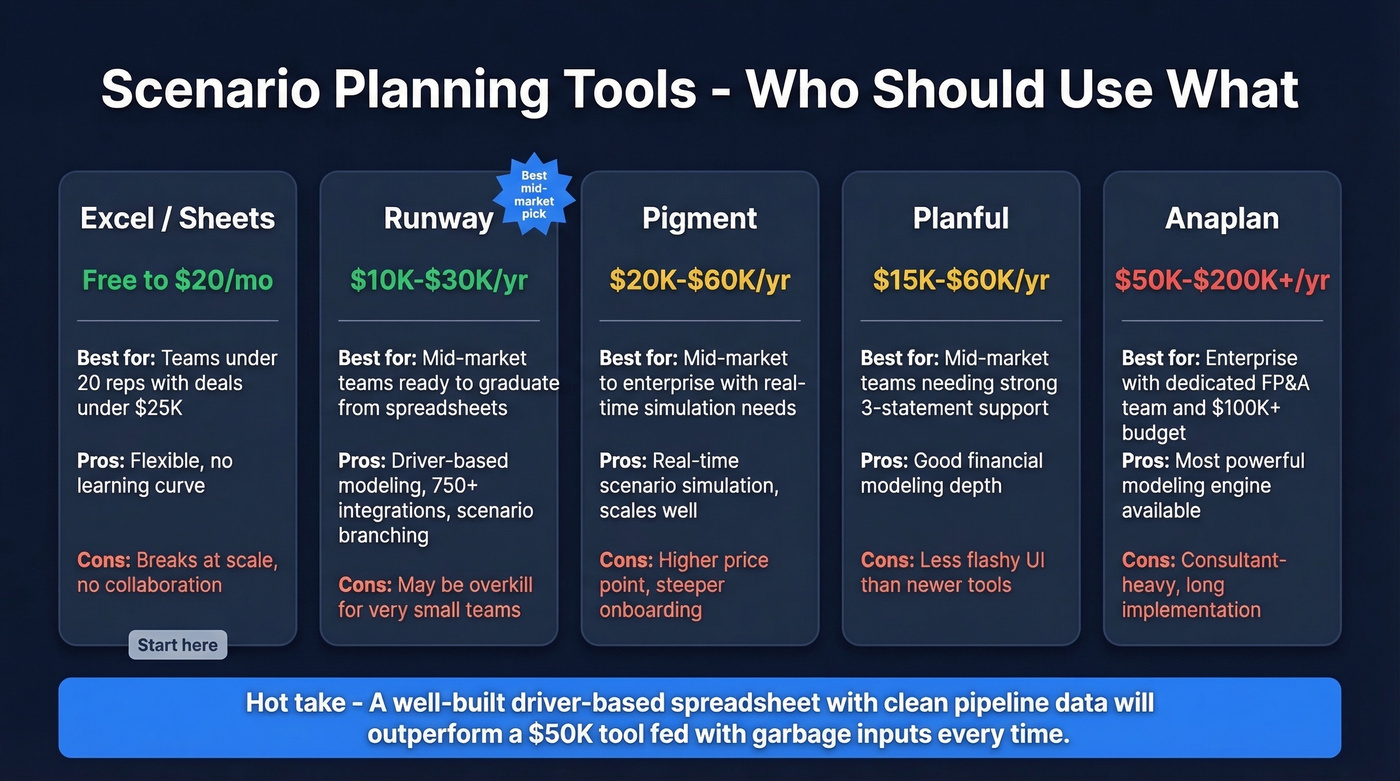
Runway is the mid-market sweet spot: driver-based modeling with scenario branching and 750+ integrations. Expect roughly $10k-$30k/year for a typical mid-market setup. It's where we'd point most teams reading this article.
Pigment handles mid-market to enterprise complexity with real-time simulation. Expect roughly $20k-$60k/year depending on scope.
Anaplan is the enterprise standard. Skip it unless you have a dedicated FP&A team and a $100K+ budget - it's powerful but consultant-heavy, and all-in costs often land around $50k-$200k+/year plus implementation.
Workday Adaptive Planning is strong for Workday shops at around $20k-$80k/year. Planful is a solid mid-market option with good 3-statement support at around $15k-$60k/year.
The AI angle is real: 58% of finance functions already use AI, up 21 points year-over-year. AI-enabled platforms generate dozens of scenarios in minutes and update them continuously. That's a genuine step-change from the weeks-long manual process.
Hot take: If your average deal size is under $25K and your team is under 20 reps, you probably don't need a dedicated scenario planning platform. A well-built driver-based spreadsheet with clean pipeline data will outperform a $50K tool fed with garbage inputs every time.
Driver-based models need real inputs. Prospeo enriches your CRM with 50+ data points per contact at a 92% match rate - so your win rates, deal velocity, and coverage metrics actually mean something when you stress-test scenarios.
Every scenario you build is only as good as the data underneath it.
FAQ
How many scenarios should I build?
Two or four. Three creates a default-to-the-middle problem that collapses the exercise into a single-point forecast with extra steps. Two forces a genuine strategic choice; four covers enough ground without decision paralysis.
How often should I update scenarios?
Monthly at minimum, weekly during disruption - nearly 25% of FP&A teams already operate at that cadence. Treat your scenario models as living documents tied to trigger points, not one-time deliverables that gather dust on a shared drive.
What data do I need before building scenarios?
At least 12 months of historical data and 400+ opportunities per forecast segment. Verify contact data accuracy first - if your bounce rates are above 10%, your pipeline coverage ratios are lying to you, and every scenario you build on top of them will be wrong.
When should a sales team start using scenario-based forecasting?
Once you have 400+ closed opportunities and at least 12 months of CRM history - enough to identify meaningful patterns in win rates and deal velocity. Before that threshold, start with a simple best case worst case framework and graduate to full multi-driver scenarios as your data matures.