Standard Email Open Rates: What the Benchmarks Actually Mean in 2026
Your ESP says your open rate is 43%. Your CMO wants to know why it dropped from 48% last quarter. Meanwhile, the actual number of humans reading your emails hasn't changed at all.
Standard email open rates in 2026 range from 31% to 43.46% depending on which platform's benchmark report you trust - and Apple Mail Privacy Protection inflates most of those numbers by 15-20+ points. Your real human open rate is probably sitting somewhere between 20% and 30%.
Every number in this article comes from datasets published between December 2024 and January 2026. The most methodologically sound benchmark source right now is MailerLite's 2025 dataset: 3.6 million campaigns, 181,000 accounts, median values across 46 industries. If you only track one metric post-MPP, make it click-to-open rate (CTOR), which sits at 6.81% and is far more useful than raw open rate for understanding what happens after someone actually reads your email.
2026 Email Open Rate Benchmarks
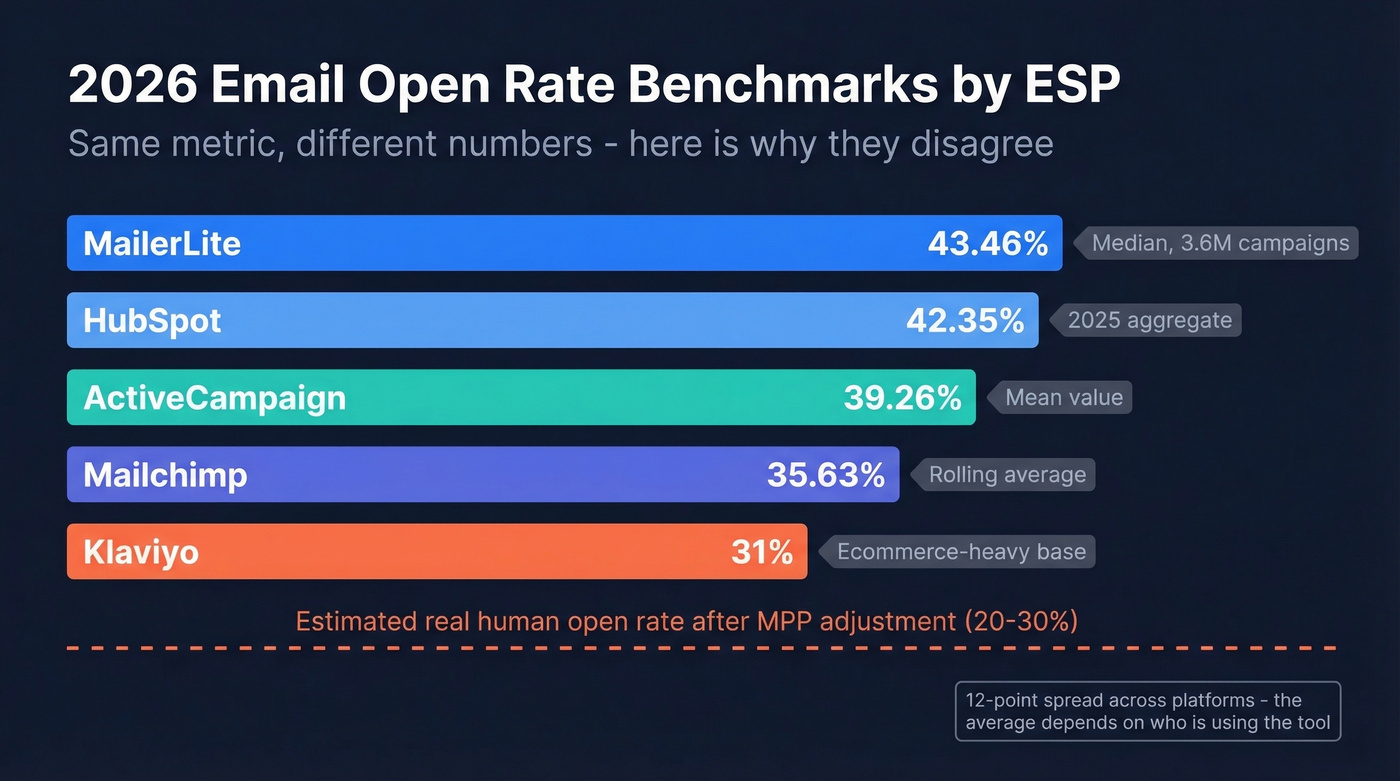
Let's start with the numbers everyone's looking for, then explain why they contradict each other.
| ESP / Source | Overall Open Rate | Methodology | Sample Size |
|---|---|---|---|
| MailerLite | 43.46% (median) | Dec 2024-Nov 2025 | 3.6M campaigns |
| HubSpot | 42.35% | 2025 aggregate | Not disclosed |
| ActiveCampaign | 39.26% (mean) | Jan 1-Dec 10, 2025 | Not disclosed |
| Mailchimp | 35.63% | Rolling average | Not disclosed |
| Klaviyo | ~31% (campaigns) | 2026, 183K customers | Ecommerce-heavy |
That's a 12-point spread across five major platforms, all claiming to report "the" average email open rate. None of them are wrong, exactly. They're just measuring different things.
HubSpot's 42.35% aligns closely with MailerLite's median, likely because both platforms serve a broad customer base beyond ecommerce. Klaviyo sits about 12 points lower because its user base skews heavily toward online retail.
Why Benchmarks Disagree
Four factors drive the discrepancy.
Platform customer base. Klaviyo skews toward ecommerce, where open rates run lower (32.67% for E-commerce in MailerLite's industry data). MailerLite serves a broader mix including nonprofits and religion - industries that can hit 50%+ opens. The "average" reflects who's using the tool, not some universal truth about email.
Mean vs. median. ActiveCampaign reports a mean of 39.26%. MailerLite reports a median of 43.46%. Means get dragged down by low-engagement senders blasting unclean lists. Medians better represent what a typical sender actually sees, and this single methodological choice explains a 4-point gap between two otherwise similar platforms.
Email types included. ActiveCampaign's click rate of 6.21% looks suspiciously high until you realize they include transactional emails alongside marketing campaigns. Order confirmations and password resets get opened at dramatically higher rates. Mix them in and your "benchmark" inflates.
MPP handling. Major ESP benchmark reports still include Apple MPP phantom opens. They acknowledge the problem - MailerLite explicitly notes that Apple MPP "automatically marks emails sent to Apple Mail clients as opened" - but the correction doesn't make it into the headline number. Every benchmark you see is inflated.
Open Rate Benchmarks by Industry
MailerLite's 46-industry breakdown is one of the most granular public datasets available. Here are the highlights, supplemented by ActiveCampaign's data where MailerLite doesn't cover a sector.
| Industry | Open Rate | Click Rate | Source |
|---|---|---|---|
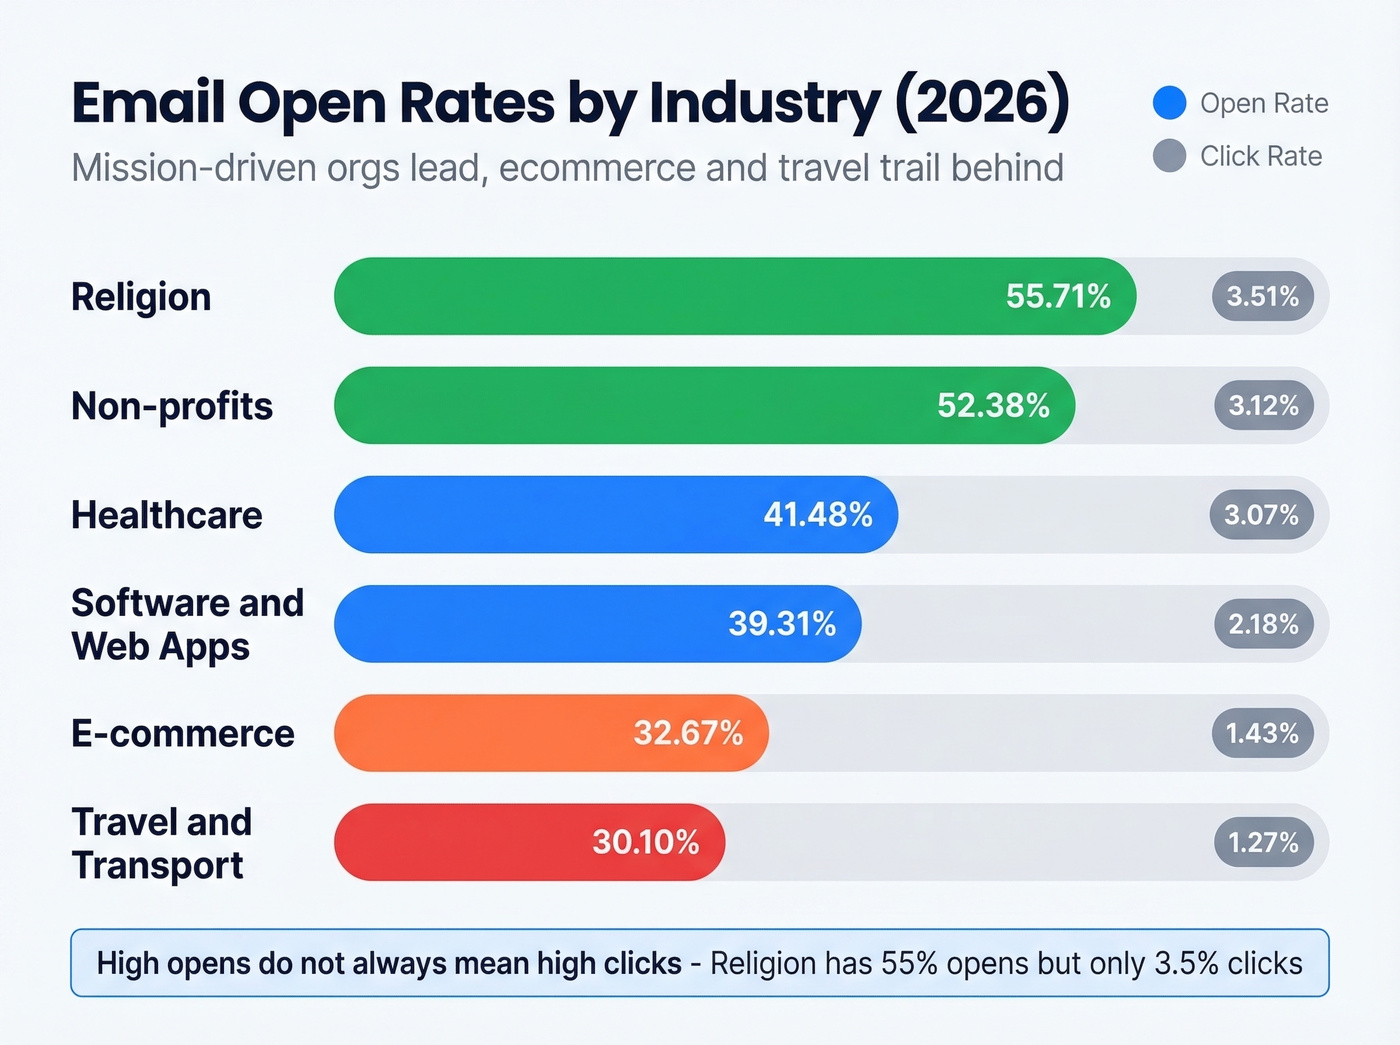
| Religion | 55.71% | 3.51% | MailerLite |
| Non-profits | 52.38% | 3.12% | MailerLite |
| Healthcare | 41.48% | 3.07% | ActiveCampaign |
| Software & Web Apps | 39.31% | 2.18% | MailerLite |
| E-commerce | 32.67% | 1.43% | MailerLite |
| Travel & Transport | 30.10% | 1.27% | MailerLite |
The pattern is intuitive. Mission-driven organizations with passionate audiences see the highest engagement. High-frequency, promotion-heavy industries sit at the bottom. Notice that the highest-open industries don't necessarily produce the highest click rates - religion at 55.71% opens but only 3.51% clicks suggests engaged audiences that read but don't always act.
B2B opt-in newsletters typically land in the 25-35% reported range, while B2C spans much wider - from 20% for aggressive retail senders up to 50%+ for niche content brands. If you're in ecommerce and comparing yourself to a 43% "average," you're benchmarking against the wrong number. Your real peer group is closer to 30-33% reported, and after MPP adjustment, around 13-18% actual human opens.
Why Your Open Rate Is Inflated
Apple Mail Privacy Protection accounts for 49.29% of all email opens as of January 2025. Nearly half of every "open" your ESP reports isn't a human reading your email - it's Apple's proxy server preloading a tracking pixel.
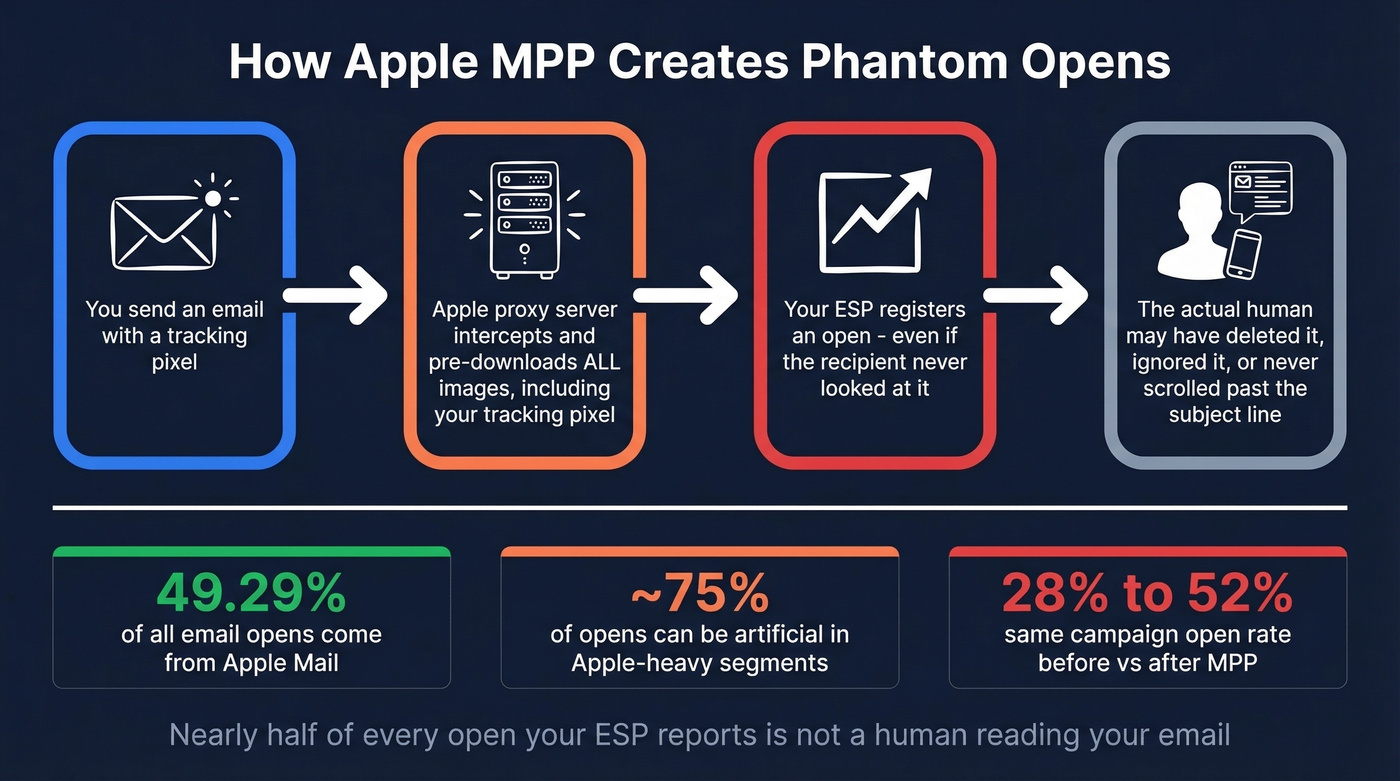
Here's how it works: when someone uses Apple Mail on iPhone, iPad, or Mac, Apple routes email content through its own servers and pre-downloads all images, including your invisible tracking pixel. Your ESP registers an "open." The recipient may never have glanced at the subject line. Campaigns that tracked ~28% open rates pre-MPP now show ~52% with identical click and conversion numbers. In Apple-heavy audience segments, up to 75% of reported opens are artificial.
And it's not just Apple. Security bots from Gmail, Outlook, and Yahoo generate "dark clicks" - automated link scanning that inflates click metrics and can trigger automations prematurely.
Are Open Rates Still Useful?
They're not dead. They're demoted.
Klaviyo's guidance is practical: use open rates for list hygiene, campaign exclusions for long-term non-openers, and deliverability trend monitoring where a sudden drop signals inbox placement problems rather than engagement problems. We've watched teams panic over open rate drops that turned out to be pure MPP noise. One important caution from Klaviyo's customer success team: excluding Apple-privacy openers entirely from your segments can reduce revenue significantly, because those phantom "opens" include real customers who do buy - you just can't tell which ones from the open data alone.
What to Track Instead
CTOR is the post-MPP metric that actually works. MailerLite's 2025 benchmark puts it at 6.81%. It's more reliable because it measures clicks as a percentage of opens, filtering out some MPP noise - though bot clicks can still distort it slightly.
Beyond CTOR, focus on click rate (2.09% benchmark), conversion rate or revenue per email, and - for cold outreach - reply rate. These are all intentional-action metrics that bots can't easily fake.
Open rates are inflated by MPP, but bounce rates aren't. When 35% of your emails bounce, no benchmark report can save your sender reputation. Prospeo delivers 98% verified email accuracy - so every send reaches a real inbox, and the engagement metrics you track actually mean something.
Stop measuring phantom opens. Start measuring real replies.
Benchmarks Most Reports Miss
Campaign vs. Automated Flow
Don't compare your welcome series to your newsletter blast. Klaviyo's 2026 data across 183,000 customers shows automated flows deliver ~3x higher click rates than campaigns (5.58% vs. 1.69%). Flows generate roughly 41% of total email revenue from just 5.3% of send volume.
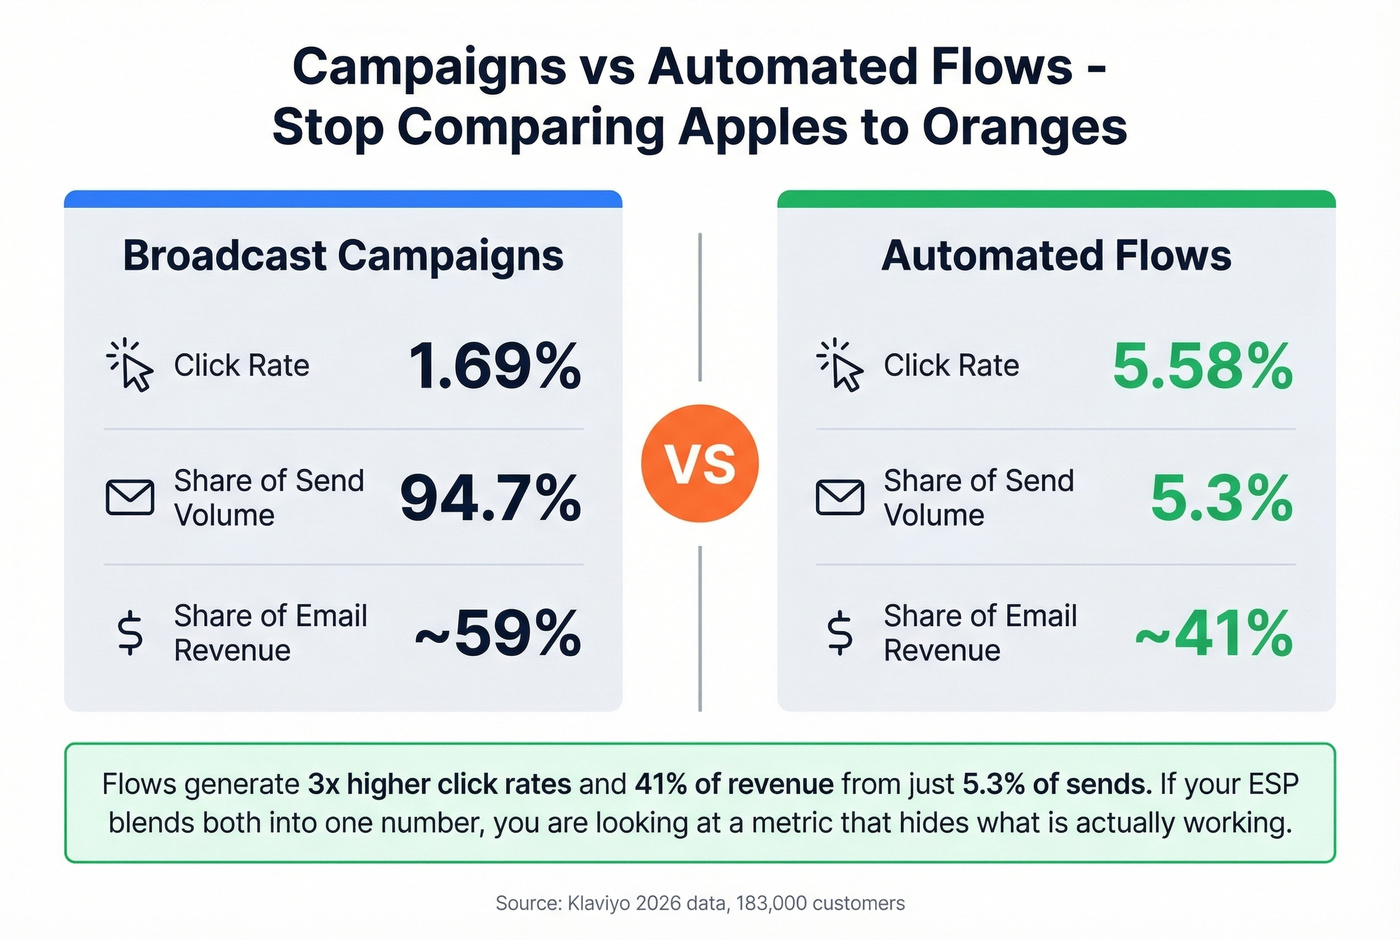
A "low" open rate on your broadcast campaigns is perfectly normal while your flows quietly drive the majority of your revenue. If your ESP lumps both into one dashboard number, you're looking at a blended metric that obscures what's actually working.
Cold Email vs. Opt-In
If you're comparing your cold outreach open rate to Mailchimp's benchmark and panicking - stop.
The average cold email open rate in 2026 is 27.7%. Top-performing cold campaigns hit 45%+ according to Belkins' 2024 analysis. These numbers can't be compared to opt-in benchmarks because the audiences, expectations, and deliverability dynamics are completely different. Cold recipients didn't ask for your email. The fact that over a quarter open it is actually remarkable.
Here's the thing: if your deal sizes sit below five figures, you probably don't need a 45% cold email open rate. A 25% open rate with tight targeting and a strong offer will outperform a 50% open rate on a spray-and-pray list every single time. The obsession with open rate benchmarks in cold email is a distraction from what actually matters - reply rate and pipeline generated.
One interesting finding from an analysis of 44 million cold emails: turning off open tracking more than doubled reply rates (2.36% vs. 1.08%). The tracking pixel itself hurts deliverability - something worth testing if you're running outbound at scale.
Benchmarks by List Size
No major ESP publishes clean benchmarks segmented by list size, but the pattern is consistent across every dataset we've analyzed. Smaller lists produce higher open rates.
| List Size | Estimated Open Rate |
|---|---|
| Under 1K | ~45-55% |
| 1K-10K | ~35-45% |
| 10K-50K | ~25-35% |
| 50K+ | ~20-30% |
A Reddit thread in r/Emailmarketing captures this well: one marketer reported ~50% opens with lists under 1,000 contacts versus ~35% at 5,000 contacts, with identical cadence and industry targeting. Small lists tend to be highly engaged - early subscribers, hand-curated contacts. As lists grow, engagement concentration dilutes, list hygiene degrades, and deliverability reputation faces more pressure from inactive addresses and spam complaints.
The Deliverability Ceiling
Before engagement even enters the picture, your open rate is capped by inbox placement. Global inbox placement sits at roughly 84% - meaning one in six emails never reaches the inbox at all.
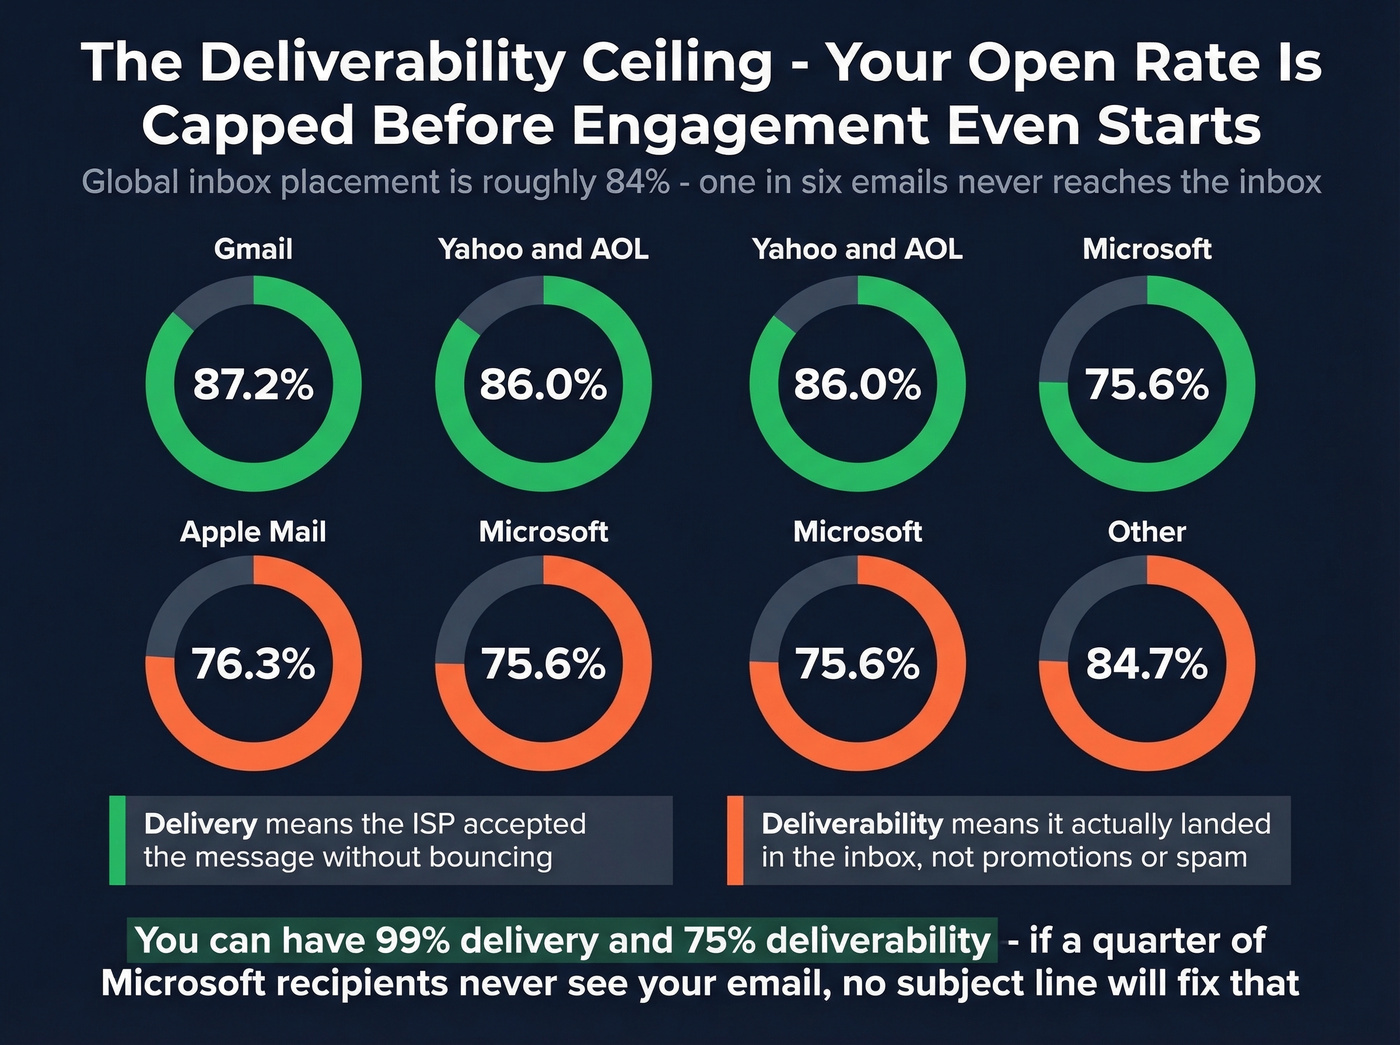
| ISP | Inbox Placement |
|---|---|
| Gmail | 87.2% |
| Yahoo / AOL | 86.0% |
| Apple Mail | 76.3% |
| Microsoft | 75.6% |
If a quarter of your Microsoft-hosted recipients never see your email in their inbox, no subject line optimization will fix that. The distinction matters: "delivery" means the ISP accepted the message without bouncing. "Deliverability" means it actually landed in the inbox, not promotions or spam. You can have 99% delivery and 75% deliverability.
Stale contact data accelerates the problem. B2B contact databases decay roughly 30% annually - people change jobs, companies restructure, email addresses go dead. Every bounce chips away at your sender reputation, pushing more sends toward spam folders. This is why we built Prospeo's verification on a 7-day data refresh cycle: fewer bounces means a healthier sender reputation, which means more of your emails actually reach the inbox.
What Changed in 2024-2025
2024 was a rough stretch for email marketers. Gmail and Yahoo enforced new authentication requirements, and the impact was immediate.
A beehiiv user on Reddit reported their 6,000-subscriber newsletter dropping from ~35% to ~18% open rates after July 2024, with clicks falling proportionately. Authentication was already set up. beehiiv support blamed content quality. The poster wasn't buying it - the drop was too sudden and too clean. A Mailchimp user reported an even more dramatic collapse: weekly open rates of ~31% until late June 2024, then ~9% ongoing. The consensus on r/Emailmarketing is that something changed at a structural level in how Gmail processes and filters bulk email.
Then came Apple iOS 18.2 with inbox tabs that sort emails by category, plus AI-generated previews that can replace your carefully crafted preheader text with Apple's own summary. Gmail's "Manage subscriptions" feature made unsubscribing trivially easy, and high-frequency senders got hit hardest - Gmail now sorts subscriptions by volume, exposing the brands that email most often.
The email environment in 2026 is harder to read than it's ever been. Open rates are inflated by bots and deflated by filtering changes, sometimes simultaneously.
How to Improve Your Open Rate
Even in a post-MPP world, the fundamentals still move the needle. In our experience, fixing data quality moves the needle faster than any subject line hack.

Fix your data quality first. The fastest way to destroy sender reputation is emailing addresses that don't exist. Every hard bounce signals to ISPs that you're not maintaining your list. Prospeo runs real-time email verification with 98% accuracy across 143M+ verified emails, including catch-all domain handling and spam-trap removal through a 5-step verification process. Before you optimize a single subject line, verify your list.
Authenticate your domain. SPF, DKIM, and DMARC aren't optional anymore. Gmail and Yahoo enforce them. If you haven't set these up, a meaningful percentage of your emails are going straight to spam.
Segment ruthlessly. Stop sending the same email to your entire list. Segment by engagement recency, purchase behavior, and content interest. Smaller, targeted sends consistently outperform blasts - the list-size data above proves it.
A/B test subject lines continuously. The difference between a 25% and 35% open rate often comes down to six words. Test length, personalization, emoji usage, and question vs. statement formats. Not once - every send.
Manage frequency. Gmail's new subscription sorting penalizes high-frequency senders. If you're emailing daily and seeing declining engagement, pull back to 2-3 times per week and watch what happens. For teams sending over 1 million emails per month, a dedicated IP gives you full control over your sender reputation - but only if your list hygiene supports it.
Skip the "optimize send timing" advice you'll see in most guides. The gains are real but tiny (2-5 points) and most ESPs handle this automatically now. Spend that energy on segmentation instead.
You just learned that half your open rate is Apple's proxy servers, not humans. The fix isn't better tracking - it's better data. Prospeo's 5-step email verification and 7-day data refresh cycle mean sub-4% bounce rates and reply rates you can actually trust.
Replace inflated vanity metrics with emails that get real responses.
FAQ
What's a good email open rate in 2026?
A good reported open rate falls between 35-45%, but after adjusting for Apple MPP inflation, your real human open rate is closer to 20-30%. Anything above 40% reported almost certainly includes significant phantom opens from Apple's privacy proxy. Focus on CTOR (6.81% benchmark) and click rates for a more honest performance picture.
How do standard email open rates vary by industry?
Religion (55.71%) and nonprofits (52.38%) top the charts, while ecommerce (32.67%) and travel (30.10%) sit near the bottom. Mission-driven organizations with passionate audiences consistently outperform high-frequency promotional senders. Always benchmark against your own vertical, not the cross-industry average.
Are email open rates still reliable?
Not as a primary success metric. Apple MPP inflates opens by 15-20+ points, and security bots generate dark clicks that further distort engagement data. Open rates remain useful for deliverability monitoring and list hygiene decisions, but CTOR and conversion metrics should drive your actual performance evaluation.
What is CTOR and why does it matter?
Click-to-open rate measures clicks as a percentage of opens. The 2025 average is 6.81% per MailerLite. It's more reliable than raw open rate because it focuses on post-open engagement, filtering out some MPP noise - though bot clicks can still distort it slightly.
How can I improve my email open rate quickly?
Start with data quality - verify your list to reduce bounces and protect sender reputation. Then authenticate your domain (SPF, DKIM, DMARC), segment by engagement recency, and A/B test subject lines every send. The upstream fix (clean data, strong authentication) always outperforms the downstream hack (better subject lines, send-time optimization).