Startup Sales Metrics: 10 KPIs That Actually Matter in 2026
Most Metric Guides Are Useless
Only 16% of sales reps hit quota in recent years. Average B2B sales cycles stretch to 6.5 months, buying committees balloon to 25 stakeholders, and the typical "startup metrics" article dumps 20 KPIs on you like that's supposed to help. It doesn't. It creates busywork, not clarity.
Here's our take: if you can't explain your sales performance with 10 metrics, you don't have a measurement problem - you have a focus problem. Nail the right 10 and you'll know what to fix this week, what to ignore this quarter, and what to show investors without sweating the Q&A.
Stage-Specific Defaults
Not every metric matters at every stage. Use this as your starting stack:
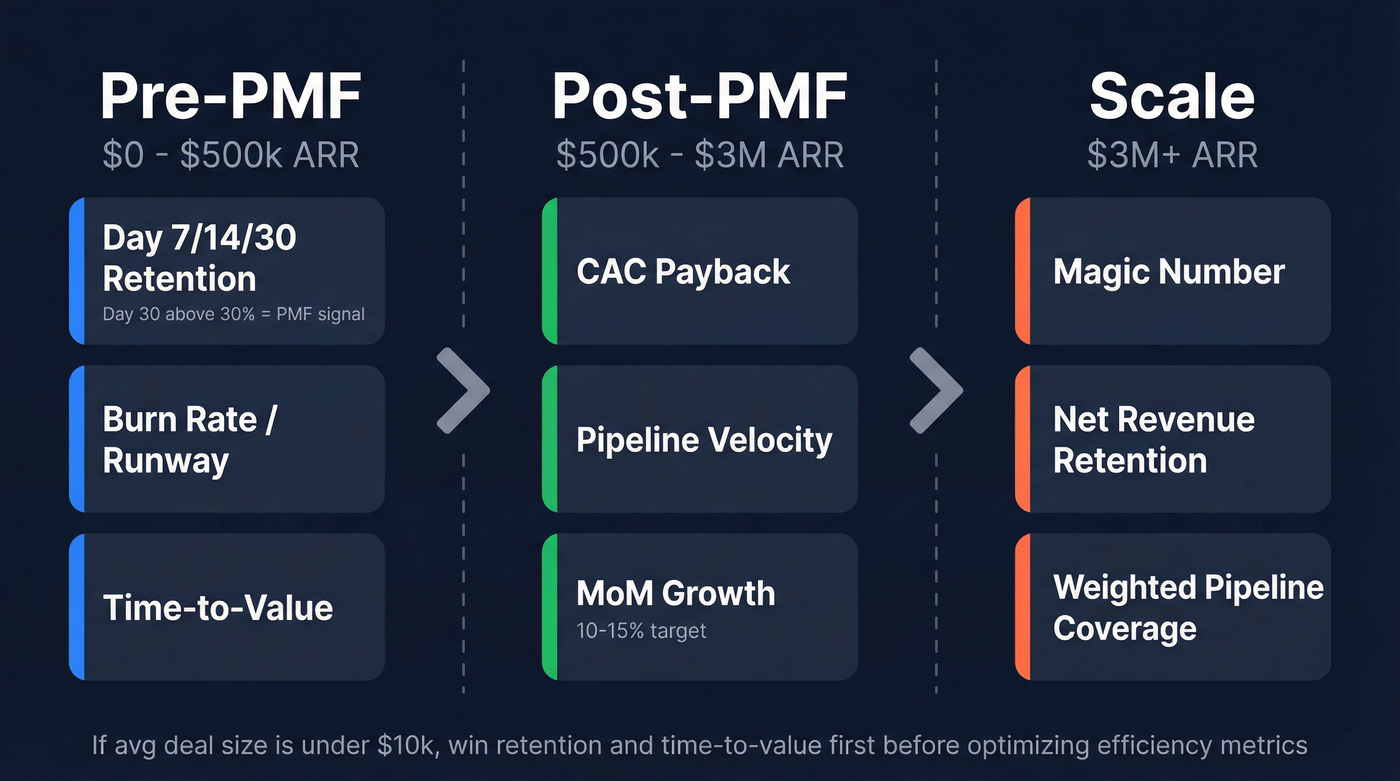
Pre-PMF ($0-$500k ARR): Day 7/14/30 retention, burn rate/runway, time-to-value. Day 30 retention above ~30% is a strong PMF signal.
Post-PMF ($500k-$3M): CAC payback, pipeline velocity, MoM growth. Growth targets by ARR band: $0-$500k at 15-20% MoM, $500k-$1M at 10-15%, $1M-$3M at 8-12%.
Scale ($3M+): Magic Number, NRR, weighted pipeline coverage. These are board-level metrics.
If your average deal size is under $10k, obsessing over board metrics early is a distraction. Win retention and time-to-value first, then earn the right to optimize efficiency.
Revenue and Unit Economics
MRR and ARR
MRR is your baseline reality: the sum of recurring subscription revenue in a month. ARR is simply MRR x 12. At seed, many VCs look for $20k-$50k MRR as a minimum traction signal, with late-seed standouts pushing much higher.
CAC
CAC = Total Sales & Marketing Spend / New Customers Acquired
Count the full cost of acquisition: salaries, tools, ads, contractors, overhead. The fastest way to lie to yourself is "forgetting" SDR and RevOps costs. Your CAC will look healthier than it is, and you'll scale a broken motion without realizing it until the cash is gone.
CAC Payback Period
Use gross margin. Always.
CAC Payback = CAC / (MRR x Gross Margin %)
Example: $12,000 CAC, $1,000 MRR, 80% gross margin = 15 months.
Payback math breaks if you ignore timing. A practitioner thread on r/FPandA nails the lag rule: enterprise deals with 180+ day cycles need a 2-quarter lag on S&M spend, mid-market needs a 1-quarter lag, and SMB can usually use current-period spend. Early-stage teams land around 12-18 months. Strong growth-stage motions push under 12.
LTV:CAC Ratio
LTV:CAC = Lifetime Value / CAC
3:1 is the line you should defend. Below 1:1 means you're paying for customers you can't afford. Above 5:1 isn't "amazing" - it usually means you're under-spending and letting competitors buy the market while you congratulate yourself on efficiency.
One thing worth doing right: calculate LTV using contribution margin, not just top-line revenue, or you'll overestimate how much a customer is actually worth.
Pipeline Health
Pipeline Coverage Ratio
Pipeline Coverage = Total Pipeline Value / Sales Quota
| Segment | Raw Coverage | Weighted Target |
|---|---|---|
| SMB | 2x-3x | ≥1.5x |
| Mid-Market | 2.5x-4x | ≥2.0x |
| Enterprise | 3x-5x | ≥2.5x |
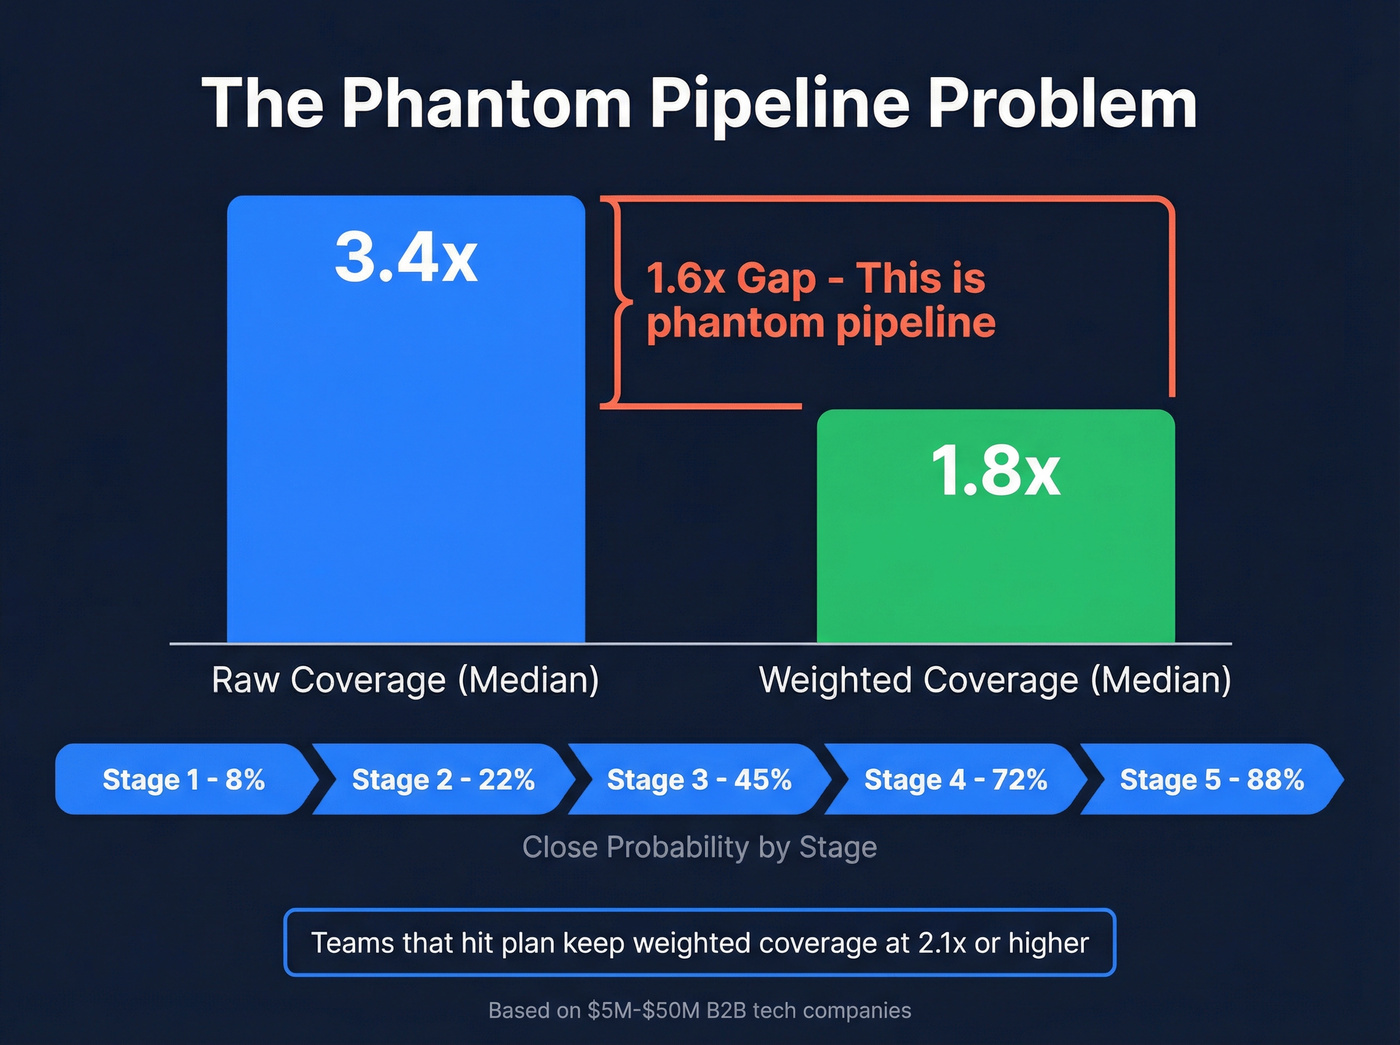
Raw coverage is a comfort blanket. Weighted coverage is the truth. A TechGrowth Insights analysis of $5M-$50M B2B tech companies found median raw coverage of 3.4x but probability-weighted coverage of just 1.8x - a 1.6x gap of phantom pipeline. That gap is often the difference between hitting plan and missing by 30%.
To weight pipeline, multiply each deal by a close probability: Stage 1 at 8%, Stage 2 at 22%, Stage 3 at 45%, Stage 4 at 72%, Stage 5 at 88%. Teams that hit plan keep weighted coverage at 2.1x or higher, with most weighted value sitting in Stage 2+. Fullcast's benchmarks add another gut punch: high-ICP accounts are often only 23% of total pipeline, which is exactly why raw coverage overstates reality.
So what creates phantom pipeline in the first place? Bad contact data is a top culprit. When reps sequence bounced emails, deals sit in pipeline that were never real. Prospeo's 98% email accuracy and 7-day refresh cycle keep outreach grounded so reps build pipeline with actual buyers instead of bouncing into the void.

Sales Velocity
Sales Velocity = (Deals x Win Rate x Avg Deal Size) / Sales Cycle Length
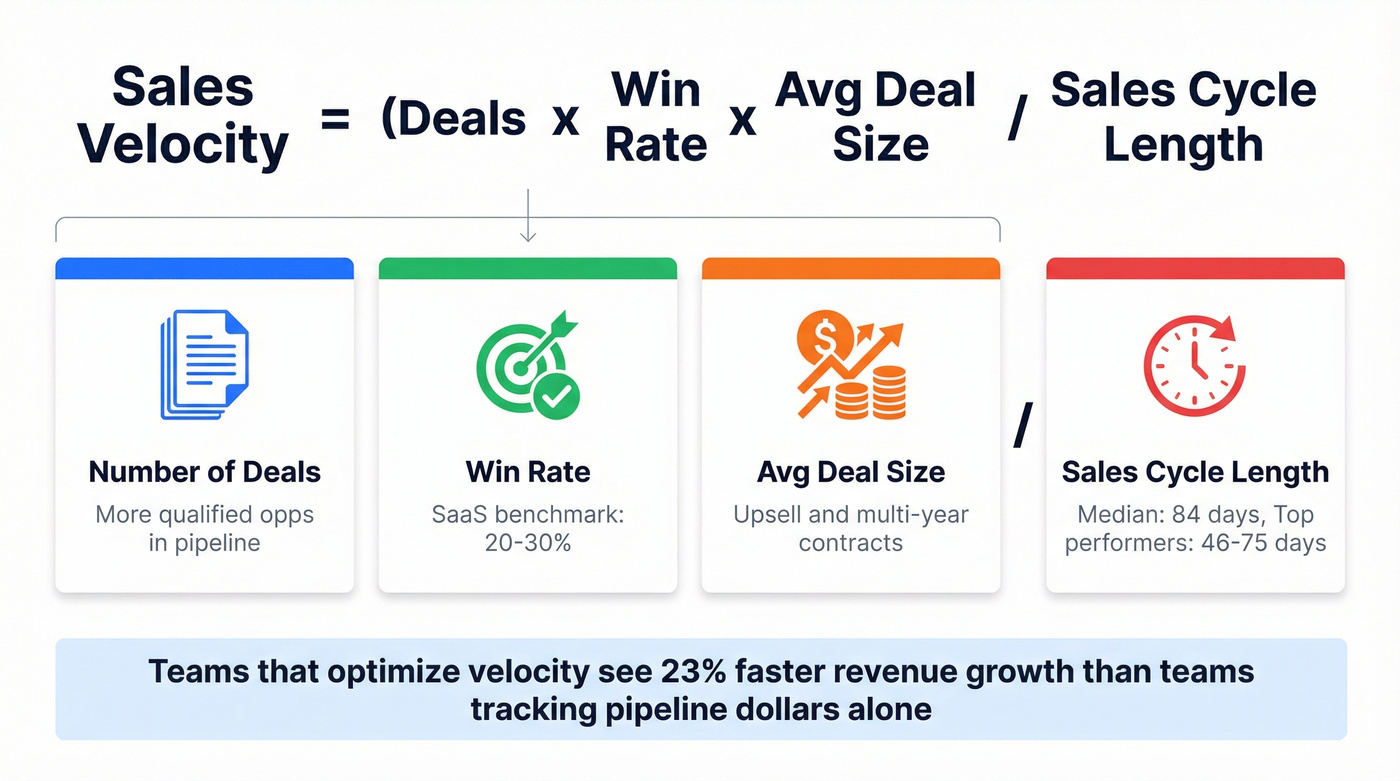
This metric forces you to stop arguing about "pipeline quality" in the abstract and fix the actual constraint. Median B2B SaaS sales cycles run 84 days, and top performers close in 46-75 days.
Teams that track and optimize velocity see 23% faster revenue growth than teams that only track pipeline dollars. That's not a rounding error. That's a different company.
Win Rate
Win Rate = Closed Won / Total Opportunities
For SaaS, 20-30% is a solid range. The most reliable lever is focus: Gradient Works found that cutting rep books from 300-400 to 200-250 accounts pushed win rates from 13% to 20%+ in under a year. Focus beats volume every time.
Stage Conversion Rates
Track where deals stall, not just where they end.
| Stage | Conversion Rate (blended) |
|---|---|
| MQL → SQL | 31-39% |
| SQL → Opportunity | 36-42% |
| Opportunity → Close | 31-39% |
MQL → SQL is consistently the biggest bottleneck, and it's where most startups bleed out. Fix that first and everything downstream gets easier.
Your MQL→SQL conversion rate tanks when reps chase bad contact data. Prospeo delivers 98% email accuracy with a 7-day refresh cycle - so every deal in your pipeline is attached to a real, reachable buyer. That's how startups close the 1.6x gap between raw and weighted coverage.
Stop measuring phantom pipeline. Start building real revenue.
Sales Efficiency
Magic Number
Magic Number = (ARR This Quarter - ARR Last Quarter) x 4 / S&M Spend Last Quarter
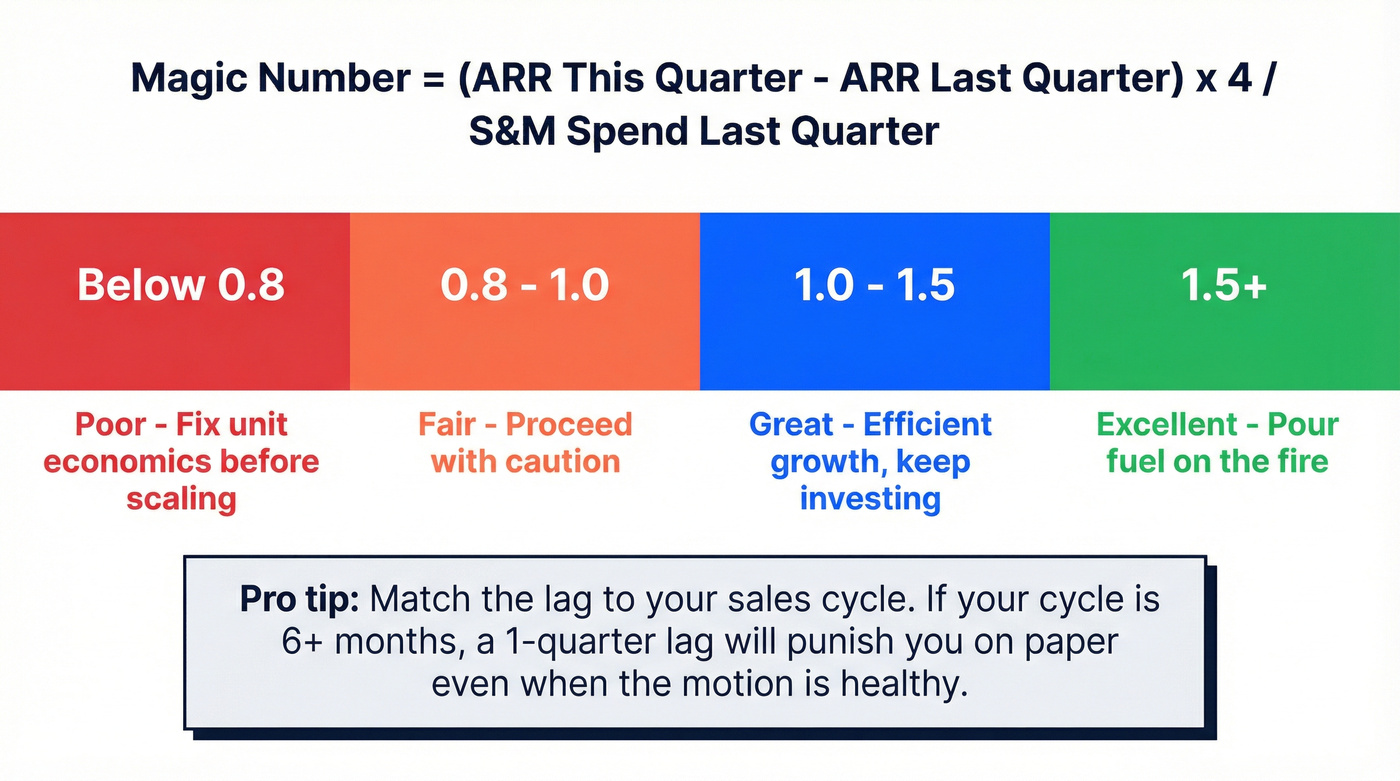
| Magic Number | Rating |
|---|---|
| ≥1.5 | Excellent |
| 1.0-1.5 | Great |
| 0.8-1.0 | Fair |
| <0.8 | Poor |
Match the lag to your sales cycle. If your cycle is 6+ months, a 1-quarter lag will punish you on paper even when the motion is healthy.
Net Revenue Retention
NRR is the compounding force behind SaaS growth. The ARR identity is the simplest way to see it:
Current ARR = (Last Period ARR x NRR) + New ARR
Seed-stage, 100-120% is strong. Below 100% means churn is eating your new sales - you're filling a leaky bucket.
Quota Attainment
Quota attainment is a systems check. With only 16% of reps hitting quota, low attainment across the team usually means your process is broken, your territories are a mess, or your quotas are fantasy. It's rarely a "coaching" problem.
Reps spend only 28-30% of their time actually selling. If you want attainment to rise, cut admin and tool sprawl before you run another training session.
What Investors Expect at Seed
If you're raising, this is the scoreboard:
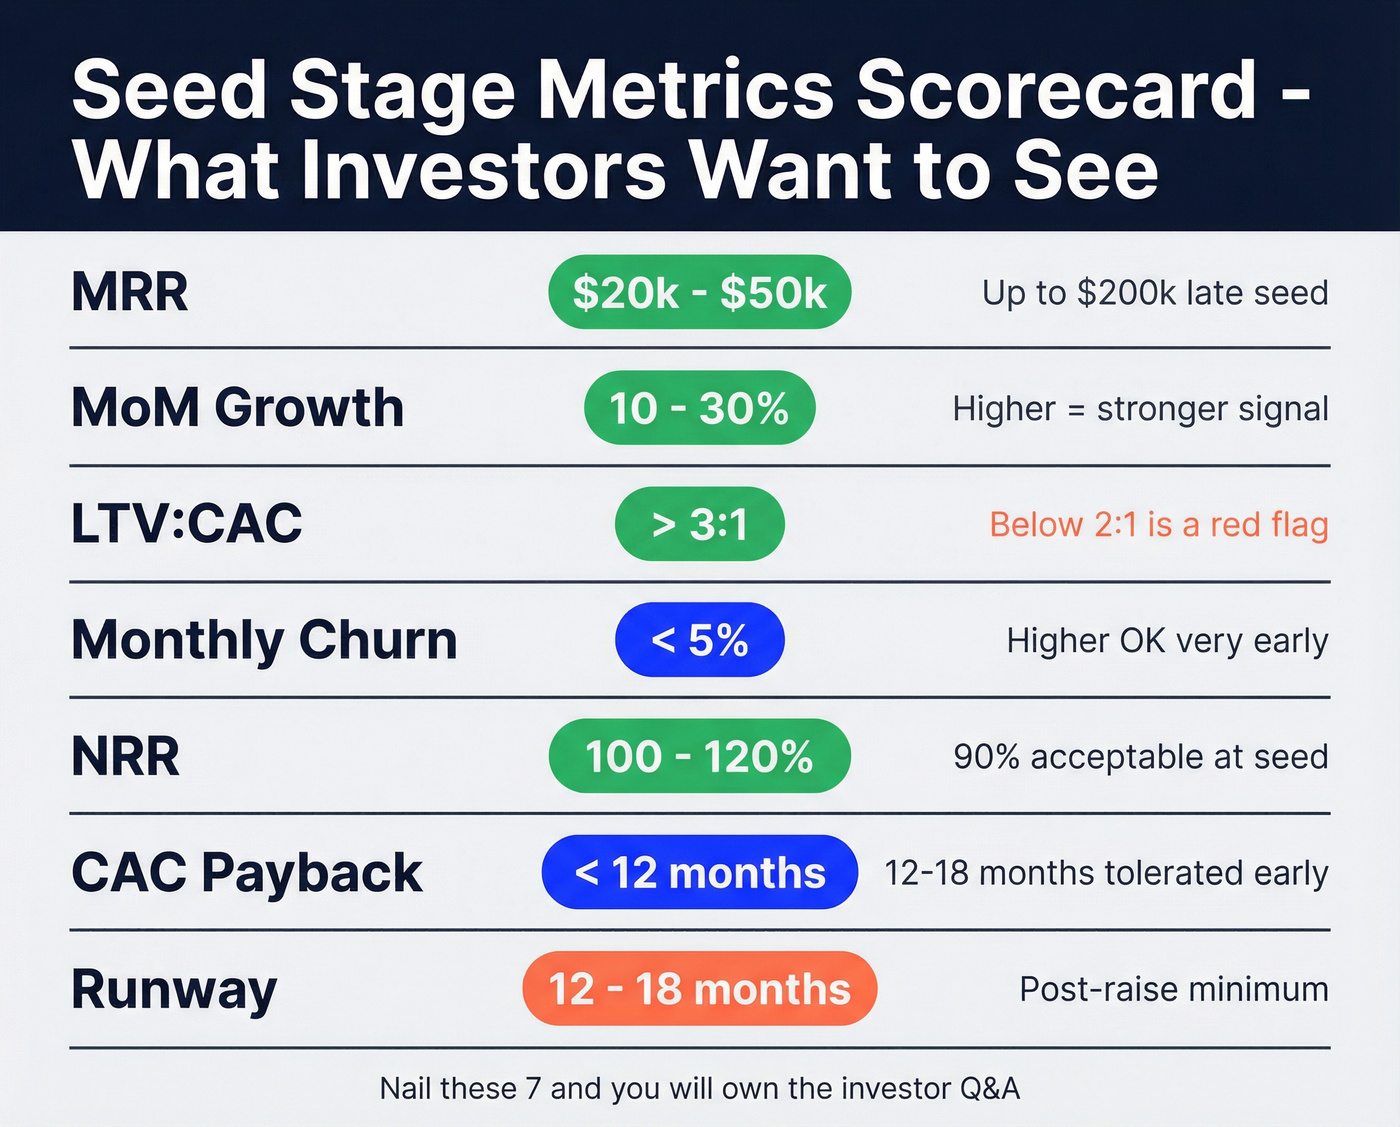
| Metric | Seed Target | Notes |
|---|---|---|
| MRR | $20k-$50k | Up to $200k late seed |
| MoM Growth | 10-30% | Higher = stronger signal |
| LTV:CAC | >3:1 | Below 2:1 is a red flag |
| Monthly Churn | <5% | Higher OK very early |
| NRR | 100-120% | 90% acceptable at seed |
| CAC Payback | <12 months | 12-18mo tolerated early |
| Runway | 12-18 months | Post-raise minimum |
How to Track Without Losing Your Mind
If your CRM data is messy, your metrics are just confident fiction.
Standardize definitions first: what qualifies an MQL, when an SQL becomes an opportunity, and what "exit criteria" means for each stage. Then enforce a simple SLA - sales accepts or rejects qualified leads within 24 hours and logs a reason when rejecting. We've seen teams skip this step and then wonder why their conversion rates look insane in both directions.
Require a minimum opportunity record: amount, stage, stage-entered date, close date, source, owner, last activity date. Without those fields, you can't compute velocity, conversion, or coverage without guessing. HubSpot's free tier works fine early on, and Salesforce plans start around $25/user/month when you're ready to scale.
Let's be honest: get these 10 startup sales metrics right and you'll have a clearer picture of your business than 90% of companies at your stage.
Clean Data Powers Every Metric
Every metric above depends on reaching real people. When reps sequence bounced emails, CAC inflates, pipeline coverage becomes fantasy, and win rate drops for reasons that have nothing to do with your pitch. Snyk's team cut bounce rates from 35-40% to under 5% and increased AE-sourced pipeline by 180% after switching to verified contact data - that's the kind of downstream impact bad data hides from your dashboards.
Sales velocity has four levers - and bad data drags down three of them. Bounced emails kill deal count, stall cycle length, and crater win rates. Prospeo gives your team 300M+ verified profiles at $0.01/email so reps spend their 28% selling time on buyers who actually exist.
Hit quota with data that connects, not data that bounces.
Startup Sales Metrics FAQ
How many KPIs should a startup track?
Track 5-7 until you have a repeatable sales motion, then expand to 10. Pre-PMF founders need retention, runway, and time-to-value. Post-PMF teams add CAC payback, pipeline velocity, and MoM growth. Anything beyond 10 is usually spreadsheet theater.
What's a good LTV:CAC ratio for a startup?
3:1 is the standard benchmark. Below 1:1 means you lose money on every customer. Above 5:1 typically signals under-investment in growth - you're leaving market share on the table for competitors to capture.
How do you calculate pipeline coverage correctly?
Compute raw coverage (pipeline / quota), then weight each deal by its stage close probability and sum the results. Benchmark data shows median raw coverage at 3.4x but weighted coverage at just 1.8x. That 1.6x gap is phantom pipeline, and it's often the difference between hitting plan and missing by 30%.
What tools help startups track these metrics?
A CRM handles pipeline hygiene - HubSpot's free tier works early on, Salesforce starts around $25/user/month. For the contact data feeding your pipeline, Prospeo provides 98% verified emails on a free tier with 75 credits/month, which keeps your outreach and downstream metrics anchored to reality instead of bounced addresses.