Types of Sales Forecast: The 5 Dimensions Most Guides Miss
It's Thursday afternoon. The CRO asks for the Q3 forecast. Three people send three different numbers - and none of them are wrong. The VP of Sales rolled up rep commits. Finance modeled off historical bookings. RevOps pulled a weighted pipeline report. Three legitimate forecasts, three wildly different answers, and a meeting that goes nowhere.
This happens because most teams treat "sales forecast" as a single thing when it's actually five different decisions layered on top of each other. Gartner found that only 45% of sales leaders are confident in their forecast accuracy, and the root cause usually isn't the math - it's that people are forecasting different objects, over different horizons, using different methods, and nobody agreed on definitions first.
Most guides list forecasting methods and call them "types." That's like listing car engines and calling them "types of vehicles." The most useful way to think about the types of sales forecast is as a set of dimensions that apply across the broader types of forecasting in business.
The Quick Version
Five distinct dimensions define every forecast. Every number you produce sits somewhere on each of these axes:
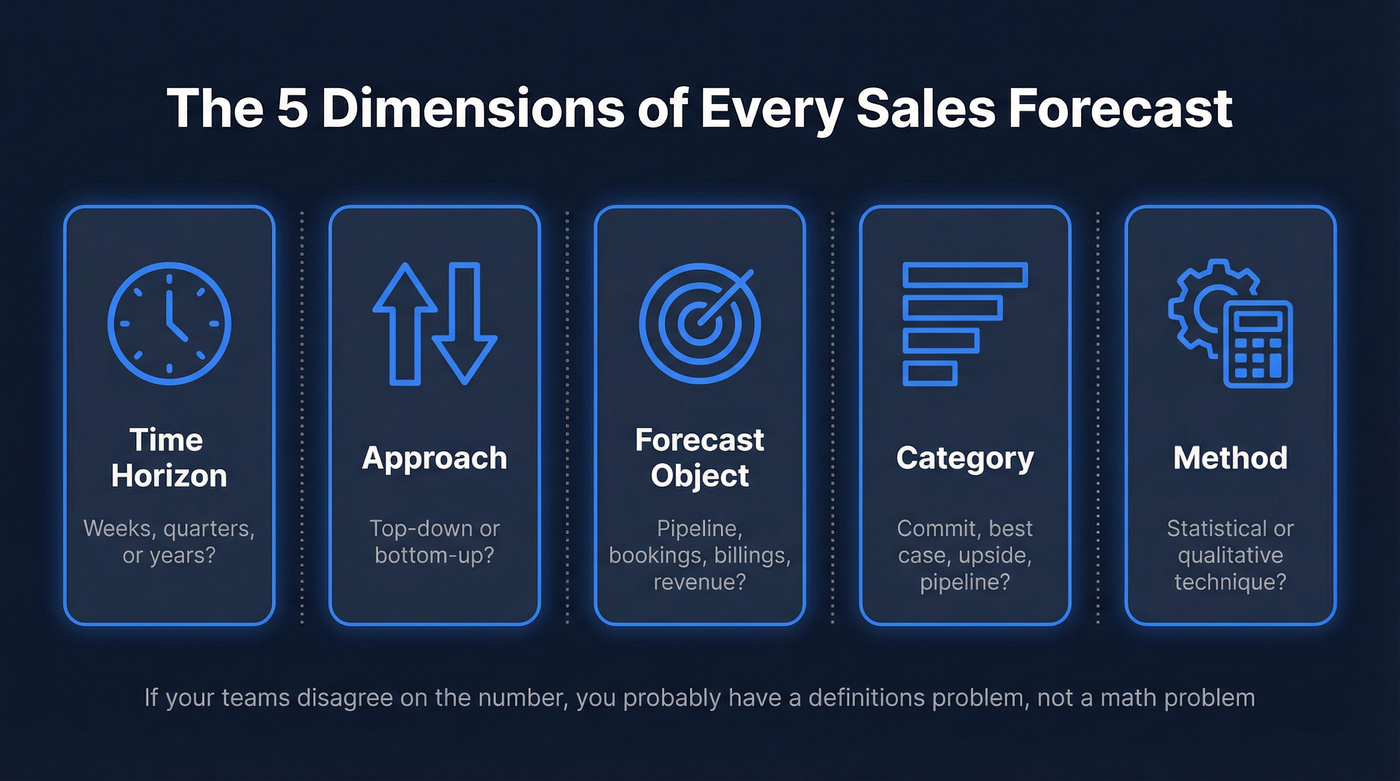
- Time horizon - Are you forecasting this month, this quarter, or next year?
- Approach - Top-down from market data, or bottom-up from rep pipelines?
- Forecast object - Pipeline? Bookings? Billings? Recognized revenue?
- Category - Commit, best case, upside, or full pipeline?
- Method - The statistical or qualitative technique generating the number
If your sales team and finance team are looking at different numbers, you have a definitions problem, not a methodology problem. The single highest-ROI improvement most orgs can make is agreeing on what "commit" means before debating which regression model to run.
Forecast Horizon Types
Every forecast has a time window, and accuracy drops as that window stretches. This is the heart of short-term vs. long-term forecasting: the further out you go, the more assumptions replace observable pipeline signals.
| Horizon | Timeframe | Primary Inputs | Typical MAPE |
|---|---|---|---|
| Short-term | Weeks to months | Pipeline, seasonality, campaigns | 10-20% |
| Medium-term | 1-4 quarters | Pipeline trends, rep capacity, quota | 15-30% |
| Long-term | 1+ years | TAM, macro scenarios, new products | 20-40% |
Short-term forecasts lean on near-term signals - what's in the pipeline right now, what marketing campaigns are landing, what seasonal patterns look like. These are the forecasts your sales managers live in, and they should be your most accurate.
Medium-term forecasts - the quarterly number your board cares about - blend pipeline data with capacity planning and historical conversion rates. Long-term forecasts shift almost entirely to strategic inputs: market expansion, pricing changes, macroeconomic scenarios. They rely on techniques like moving averages, ARIMA, and regression because there's no pipeline to weight 18 months out.
A 12-month forecast with meaningful error isn't a failure. Accuracy drops with horizon length, and the right response is adjusting your expectations and update cadence, not switching models every quarter. In practice, long-term sales projections are usually scenario-based ranges tied to strategy, not a single "precise" number.
Forecast Approach Types
Top-Down
Top-down forecasting starts at the macro level and works down. Finance or the executive team takes market data - TAM, growth rates, competitive share - and allocates targets. If your TAM is $50B and you expect to capture 3%, that's a $1.5B revenue target distributed across regions, products, and teams.

The strength is strategic coherence. The weakness is that it's assumption-heavy and disconnected from what reps actually see in their pipelines. A top-down forecast can look beautiful in a board deck and be completely divorced from reality on the ground.
Bottom-Up
Bottom-up forecasting builds from the micro level. Individual reps submit deal-level estimates, managers roll those up, regional leaders aggregate, and the CRO presents the total. The inputs are granular and grounded in real pipeline activity.
The weakness? It's resource-intensive, depends entirely on CRM data quality, and can miss broader market context. If your reps are optimistic - and they usually are - the bottom-up number will be inflated. If they're sandbagging, you'll under-forecast.
Reconciliation
Most mature orgs run both and reconcile the gap. When top-down says $12M and bottom-up says $9M, the interesting conversation isn't which number is right - it's why there's a $3M delta. That gap reveals either unrealistic targets or hidden pipeline problems.
In our experience, the reconciliation conversation reveals more about organizational health than either number alone. Companies with a formalized forecasting process saw 11% higher revenue growth than those without, and reconciliation is a big part of what "formalized" looks like in practice.
Forecast Object Types
This is where finance and sales most often talk past each other. The same deal can produce four different numbers depending on what you're measuring.
| Object | Definition | Example ($24K/2-yr deal) |
|---|---|---|
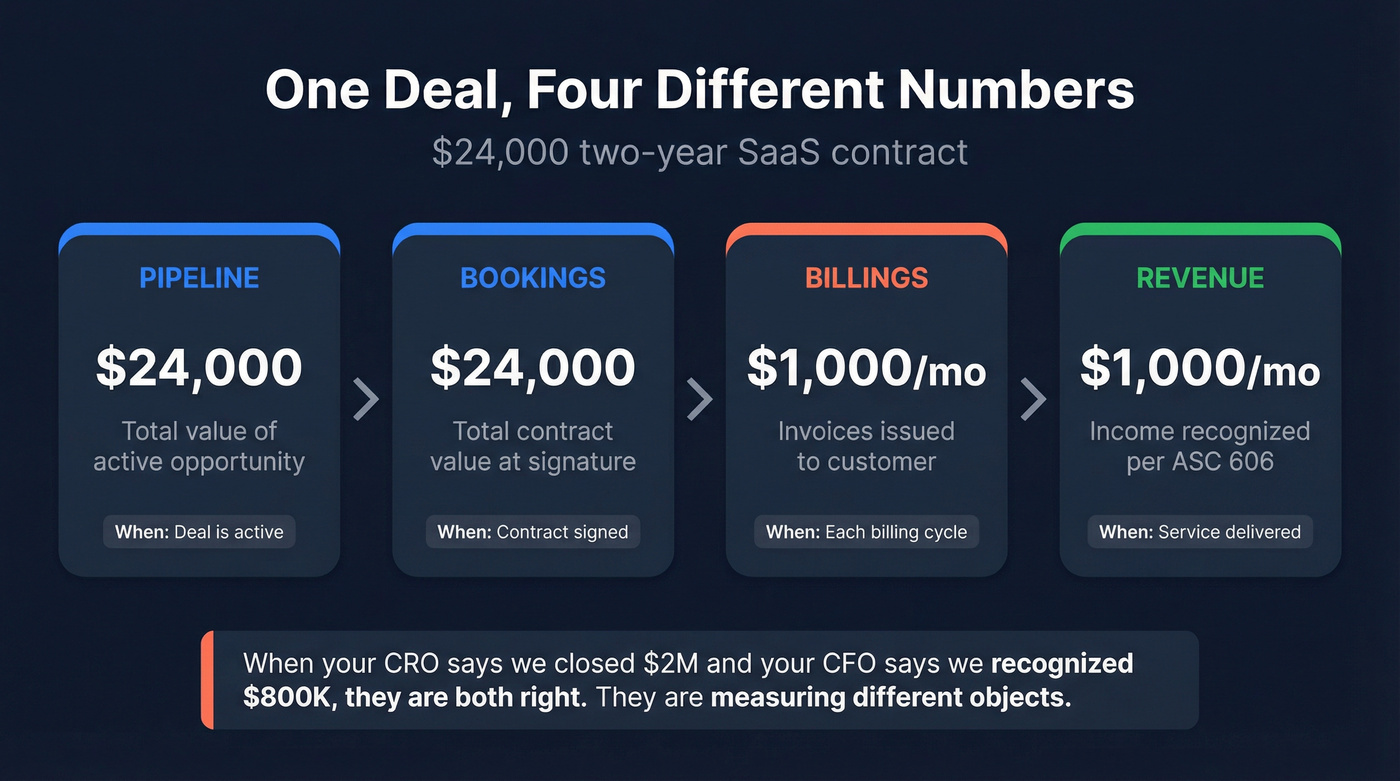
| Pipeline | Total value of active opps | $24,000 |
| Bookings | Total contract value signed | $24,000 at close |
| Billings | Invoices issued | $1,000/month if billed monthly |
| Revenue | Income recognized per ASC 606 | $1,000/month if recognized ratably |
A $24,000 two-year contract is $24,000 in bookings the day it's signed. But it's only recognized as revenue as it's earned under ASC 606. The rest sits as deferred revenue on the balance sheet until service delivery catches up.
Here's the thing: when your CRO says "we closed $2M this quarter" and your CFO says "we recognized $800K," they're both right. They're just measuring different objects. Add ACV and TCV into the mix, and you've got multiple legitimate ways to describe the same deal. Confusing these objects is the fastest way to produce a forecast that finance rejects. Before you pick a method, make sure everyone agrees on what's being forecasted.
Bottom-up forecasts collapse when your CRM is full of stale contacts and bad emails. Prospeo refreshes 300M+ profiles every 7 days - not every 6 weeks - so the pipeline your reps roll up actually reflects reality. 98% email accuracy means fewer dead deals inflating your commit number.
Stop forecasting on top of garbage data. Start with contacts that connect.
Forecast Categories
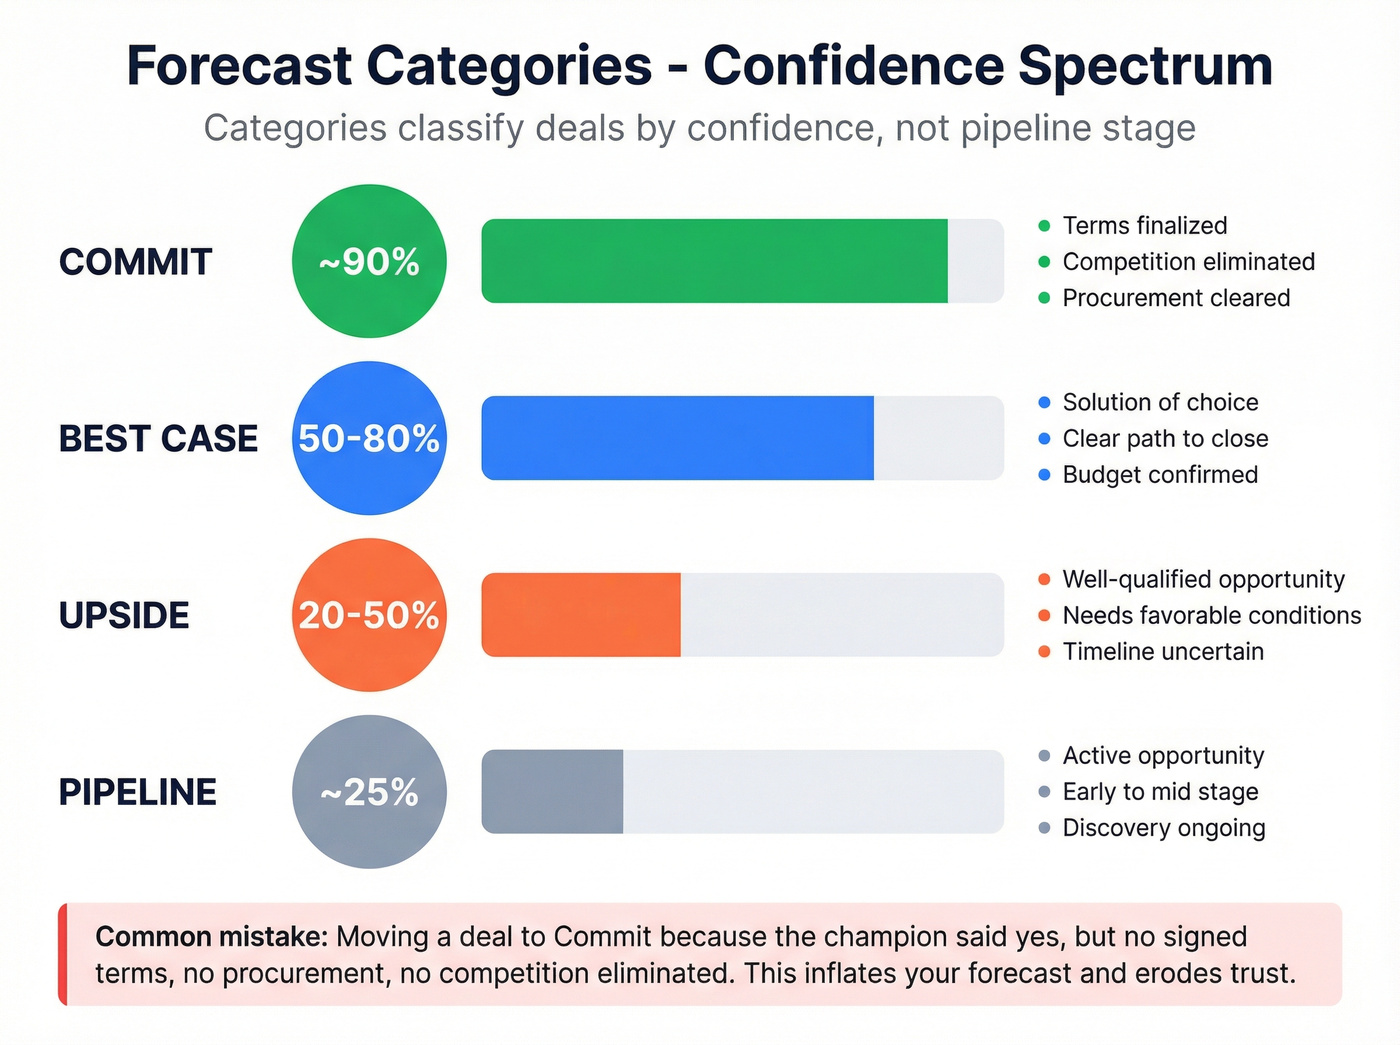
Forecast categories classify opportunities by confidence level, and they're distinct from pipeline stages. A deal can sit in "Negotiation" as a stage while being categorized as "Best Case" because the rep believes it'll close but hasn't locked terms yet.
| Category | Close Probability | Typical Criteria |
|---|---|---|
| Commit | ~90% | Terms finalized, competition gone, procurement cleared |
| Best Case | 50-80% | Solution of choice, clear path to close |
| Upside | 20-50% | Well-qualified, needs favorable conditions |
| Pipeline | ~25% | Active opp, early-to-mid stage |
We've seen this play out badly more times than we can count. The newest AE moves a $180K deal to Commit because the champion said "we're going with you." No signed terms. No procurement engagement. No competition formally eliminated. That deal sits in Commit for six weeks, inflates the forecast, then slips to next quarter when legal surfaces a competing vendor.
This is why stage-based probability breaks in complex enterprise deals. A deal at "Proposal" stage doesn't have a 75% close rate just because your Salesforce instance says so. Multi-stakeholder complexity, shifting budgets, and competitive threats make stage probabilities unreliable for large deals. The commit/best case/upside framework forces reps to make a judgment call rather than hiding behind a stage dropdown.
Use this if you're running enterprise B2B with deal sizes above $50K and complex buying committees. Skip this if you're in transactional sales with hundreds of small deals - weighted pipeline will serve you better.
Sales Forecasting Methods
This is the section every competitor article over-indexes on. Let's keep it tight.

| Method | Best For | Data Needed | Typical MAPE | Complexity |
|---|---|---|---|---|
| Weighted Pipeline | Any org with CRM | Active pipeline | 15-25% | Low |
| Historical/Time-Series | Stable markets | 12+ months | 10-20% | Medium |
| Regression | Data-rich orgs | Multiple variables | 10-18% | High |
| Multivariable | Enterprise | CRM + market data | 8-15% | Very high |
| Delphi | New markets | Expert access | 20-30% | Low |
| Scenario | Finance/board | Assumptions | Varies | Medium |
| AI/ML | Orgs with scale data | CRM + engagement | 8-15% | Medium |
Weighted Pipeline
Multiply each deal's value by its stage probability, sum the results. Three deals: $50K at 80%, $30K at 50%, and $100K at 20%. Your weighted forecast is $75K. Any org with a CRM can run it tomorrow. It breaks when stage probabilities don't reflect reality, which is most of the time in complex sales - but it's still the right starting point for any team without 12+ months of clean historical data.
Historical / Time-Series
Use this when you have a stable, recurring business with at least 12 months of clean data and no major structural shifts on the horizon. Moving averages, ARIMA, and exponential smoothing all extrapolate from past patterns.
Skip this when you've recently launched a new product, entered a new market, or changed your pricing model. These methods will confidently project a future that no longer resembles the past.
Regression Analysis
Correlates revenue with independent variables like headcount, marketing spend, and seasonality. Powerful when you have the data, but most orgs don't have clean enough inputs or enough history to get reliable results early on. If your variables are noisy, weighted pipeline with good category definitions will often outperform a regression model built on messy inputs.
Multivariable Analysis
Regression's bigger sibling - combines multiple input types across CRM, market, and engagement data. Best for enterprise orgs with dedicated analytics teams. Overkill for most mid-market companies, and the marginal accuracy gain over well-tuned regression rarely justifies the complexity.
Delphi Method
Structured expert consensus. You gather opinions from experienced leaders, anonymize them, iterate until convergence. Useful for new markets or product launches where there's no historical data to model. Surprisingly effective when done rigorously - and dramatically better than one executive's gut feeling presented as a plan.
Scenario Forecasting
Base case, best case, worst case. Finance teams use this for stress-testing cash flow and board planning. Push targets 20% higher for the stretch scenario; model a recession or lost key account for worst case. The value isn't in any single scenario - it's in understanding the range of outcomes and preparing for each.
AI/ML-Driven
A lot of revenue teams now use AI-powered tools, and strong implementations can materially reduce forecast error. The catch is always the same: AI models are only as good as the data feeding them. Garbage CRM data produces confidently wrong predictions.
Choosing the Right Forecast Type
The HBR framework on technique selection still holds: managers, not just analysts, need to understand the options.
For small teams with limited CRM history, bottom-up weighted pipeline plus intuitive judgment is the move. Don't overcomplicate it. Your reps know their deals better than any model does right now.
For mid-market teams with 10-50 reps, add commit/best case/upside categories to your weighted pipeline. Run biweekly forecast calls. Have RevOps enforce definitions so "commit" means the same thing to every manager.
For enterprise orgs with 50+ reps, use the full category framework, weekly cadence, and RevOps owning data quality and dashboards. Layer in regression or AI/ML if you have 18+ months of clean data. Finance runs parallel top-down scenarios for board reporting.
Let's be honest: the single highest-ROI improvement for most organizations isn't switching from weighted pipeline to AI. We've watched teams spend months evaluating AI forecasting tools when the real problem was that nobody agreed on what "commit" meant. Fix definitions first. Upgrade models second.
Common Forecasting Mistakes
Undefined categories. "Commit" means "90% locked" to one manager and "I feel good about it" to another. This ambiguity can swing your forecast by millions.
Spreadsheet reversion. Teams invest in Salesforce, Clari, or Gong - then default back to spreadsheets because the CRM data is too messy to trust. The r/SalesOperations community confirms this is endemic: multiple threads describe teams paying six figures for forecasting platforms, then running the actual forecast in Google Sheets because nobody trusts the underlying data.
Dirty pipeline data. Data quality problems compound - stale deal stages, inflated values, and unverified contacts all erode forecast accuracy. Bad data costs companies $12.9M annually. Start with what's measurable: how many of your pipeline contacts have verified emails and working phone numbers? Prospeo verifies emails at 98% accuracy on a 7-day refresh cycle, so at minimum your contact layer reflects reality rather than last quarter's imports.
Treating forecasting as compliance. When reps view the forecast call as a box-checking exercise - or worse, openly admit to "making up a number" - you get garbage inputs regardless of how sophisticated your model is. The fix isn't a better tool; it's making the forecast call useful to the rep, not just to management.
Measuring Forecast Accuracy
No single metric tells the whole story. Use at least two.
| Metric | What It Measures | When to Use |
|---|---|---|
| MAPE | % error per period | Cross-segment comparison |
| MAE | Avg absolute error in dollars | Simple, interpretable |
| RMSE | Penalizes large misses | Flagging big forecast failures |
| WMAPE | Volume-weighted % error | High-value deal focus |
| Bias | Systematic over/under | Detecting sandbagging or optimism |
| FVA | Process vs. naive baseline | Justifying forecast investment |
A practical operating target is 10-20% MAPE for near-term forecasts and 20-40% for annual projections. If your current-quarter error is consistently high, the problem is usually data or definitions, not methodology.
Forecast Value Added is the metric most teams skip and shouldn't. It answers a simple question: does your forecasting process beat a naive baseline like "same as last quarter"? If your elaborate weekly forecast calls produce the same accuracy as copying last quarter's number, something is broken - and it's probably not the spreadsheet.
The $3M gap between your top-down and bottom-up forecast? It often starts with reps who can't reach the right buyers. Prospeo gives your team 143M+ verified emails and 125M+ direct dials so pipeline coverage matches the targets finance sets - at $0.01 per lead, not $1.
Close the forecast gap by closing the data gap first.
FAQ
What's the difference between a sales forecast and a revenue forecast?
A sales forecast estimates deals expected to close in a period, while a revenue forecast includes renewals, expansions, and recognized revenue under ASC 606. In practice, sales forecasts roll up pipeline and bookings, while revenue forecasts translate that into billings and recognition timing. If your CFO and CRO disagree, they're likely forecasting different objects.
Which forecasting method is best for startups?
Weighted pipeline plus rep judgment, because you don't have 12+ months of clean history for time-series or regression. Set 3-4 clear forecast categories and review weekly so the model improves as your CRM hygiene improves. Aim for 20-30% MAPE early, then tighten.
How often should we update our sales forecast?
Most teams should update weekly for long sales cycles and biweekly for faster mid-market motions; monthly rollups are mainly for finance reporting. A good rule: update at least 4 times per average sales cycle. So a 120-day cycle means every 2-3 weeks. Updating more often doesn't help if stages and categories aren't enforced.
Why is my sales forecast always wrong?
It's usually wrong because inputs are wrong: inconsistent category definitions, stale CRM fields, and optimism or sandbagging bias. If your current-quarter MAPE is above 25% for two quarters in a row, audit "commit" criteria, stage aging, and close-date hygiene before changing models. Fixing definitions typically beats switching tools.
How does data quality affect forecast accuracy?
Data quality directly drives forecast error because every model depends on accurate contacts, deal values, stages, and close dates. If 10-20% of your opps have wrong stakeholders or dead contact info, your pipeline coverage and conversion rates get distorted. Cleaning up the contact layer - verifying emails, refreshing stale records, enriching CRM data - is the fastest way to improve forecast inputs without touching your methodology.
How to Use These Types
If you're trying to get alignment and stop the "three forecasts, three numbers" problem, don't start by arguing about models. Start by labeling your forecast across the five dimensions - horizon, approach, object, category, and method - and you'll instantly see why numbers diverge.
That's the practical value of the types of sales forecast: they're not a list of methods, they're a shared language. Once everyone agrees on definitions, you can pick the simplest method that fits your data maturity and then improve accuracy by fixing the inputs, not endlessly swapping techniques.