Weighted Pipeline Management: How to Make It Actually Work
It's the last Thursday of the quarter. Your CRO pulls up the forecast call, and the weighted pipeline says you'll land at $1.2M. You close at $870K. Nobody's surprised, and that's the problem - 4 in 5 sales and finance leaders missed a quarterly forecast in the past year, and over half missed it two or more times. Weighted pipeline management is a B-minus forecasting method that most teams implement at a D-minus level. Let's fix that.
What You Need (Quick Version)
- 100+ deals per quarter? Use weighted pipeline with quarterly calibration. This guide shows you the actual math.
- Fewer than 50 deals? Skip it. Use commit + best case with MEDDIC or BANT qualification gates instead.
- Before doing anything: Audit your CRM data. Your forecast is only as accurate as the contacts behind it.
What Is a Weighted Pipeline?
The formula is simple: deal value x probability of closing = weighted value. Sum those weighted values across your pipeline, and you get a forecast that's supposed to reflect reality better than raw pipeline totals.
The gap between "supposed to" and "does" is where most teams live.
| Deal | Value | Stage | Probability | Unweighted | Weighted |
|---|---|---|---|---|---|
| Acme Corp | $80,000 | Negotiation | 70% | $80,000 | $56,000 |
| Beta Inc | $50,000 | Proposal | 40% | $50,000 | $20,000 |
| Gamma Ltd | $120,000 | Discovery | 15% | $120,000 | $18,000 |
| Delta Co | $30,000 | Verbal Yes | 90% | $30,000 | $27,000 |
| Total | $280,000 | $121,000 |
The unweighted pipeline says $280K. Weighted says $121K. The truth is closer to the weighted number - but only if those probabilities are calibrated to your actual close rates. Most teams never check.
How Accurate Is It, Really?
2026 Benchmark Data
An XANT Labs study analyzed 270,912 closed-won opportunities totaling $18.1B. Only 28.1% closed within 5% of the 90-day forecasted amount. Nearly half - 47% - were off by more than 50%. The average 90-day prediction missed by over 31%.
That's not a rounding error. That's a structural problem.
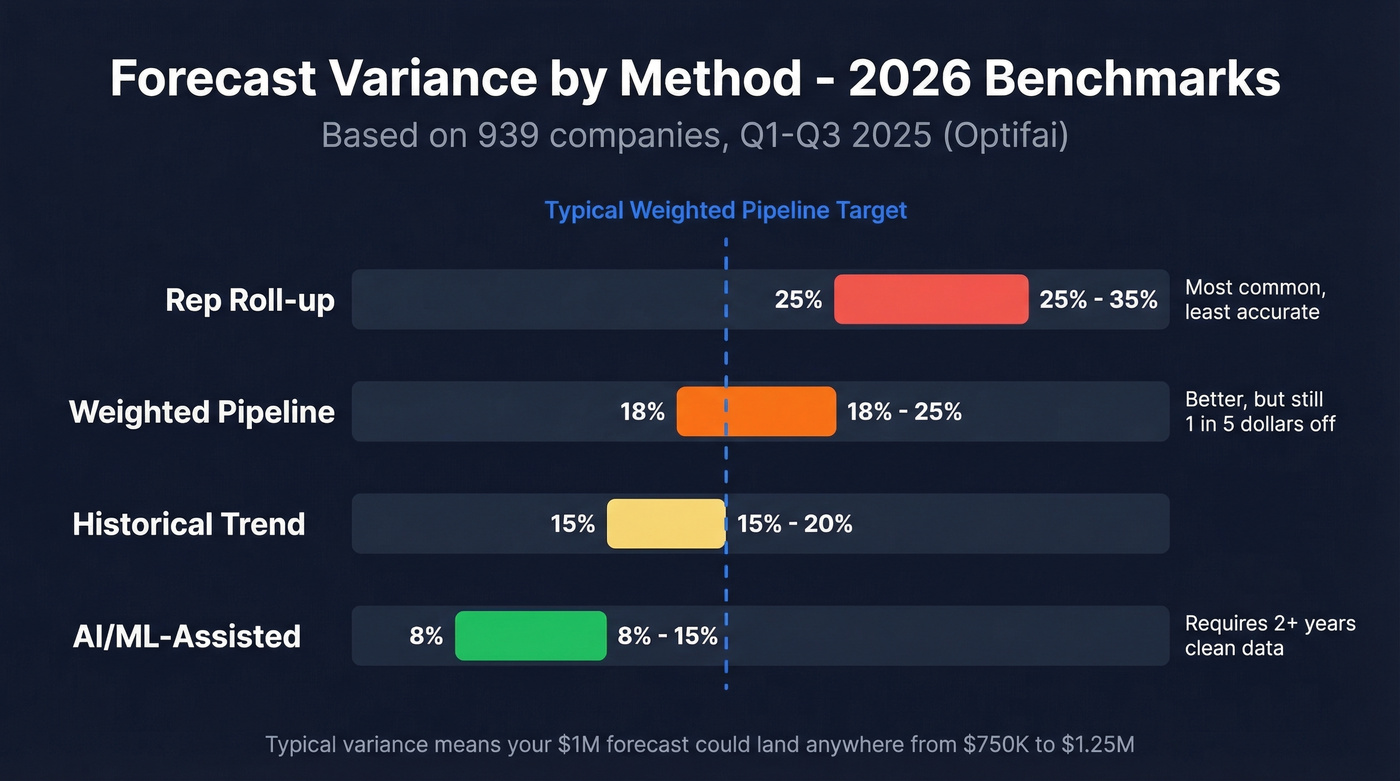
An Optifai benchmark across 939 companies (Q1-Q3 2025) breaks down typical variance by forecasting method:
| Method | Typical Variance |
|---|---|
| Rep roll-up | +/-25-35% |
| Weighted pipeline | +/-18-25% |
| Historical trend | +/-15-20% |
| AI/ML-assisted | +/-8-15% |
Weighted pipeline beats rep roll-up, but it's not close to AI/ML. According to Gartner, the median B2B forecast accuracy sits at 70-79%, and only about 7% of sales orgs ever reach 90%+.
The consistent failure modes are well-known: reps game stages, CRM data goes stale, and default probabilities never get recalibrated. Forrester makes the same point in governance terms - rep-entered probabilities introduce bias and confusion, especially when they conflict with forecast categories.
Measuring Accuracy the Right Way
Most teams track forecast accuracy with MAPE (Mean Absolute Percentage Error), but MAPE is misleading for sales because it treats a $5K deal miss the same as a $500K deal miss. Use WAPE or WMAPE instead - it weights errors by revenue, so big-deal misses get the attention they deserve. Also track forecast bias direction: are you consistently over-forecasting or under-forecasting? A 15% variance that always skews optimistic is a different problem than one that oscillates.
Accuracy Decay by Horizon
Forecast accuracy erodes the further out you look:
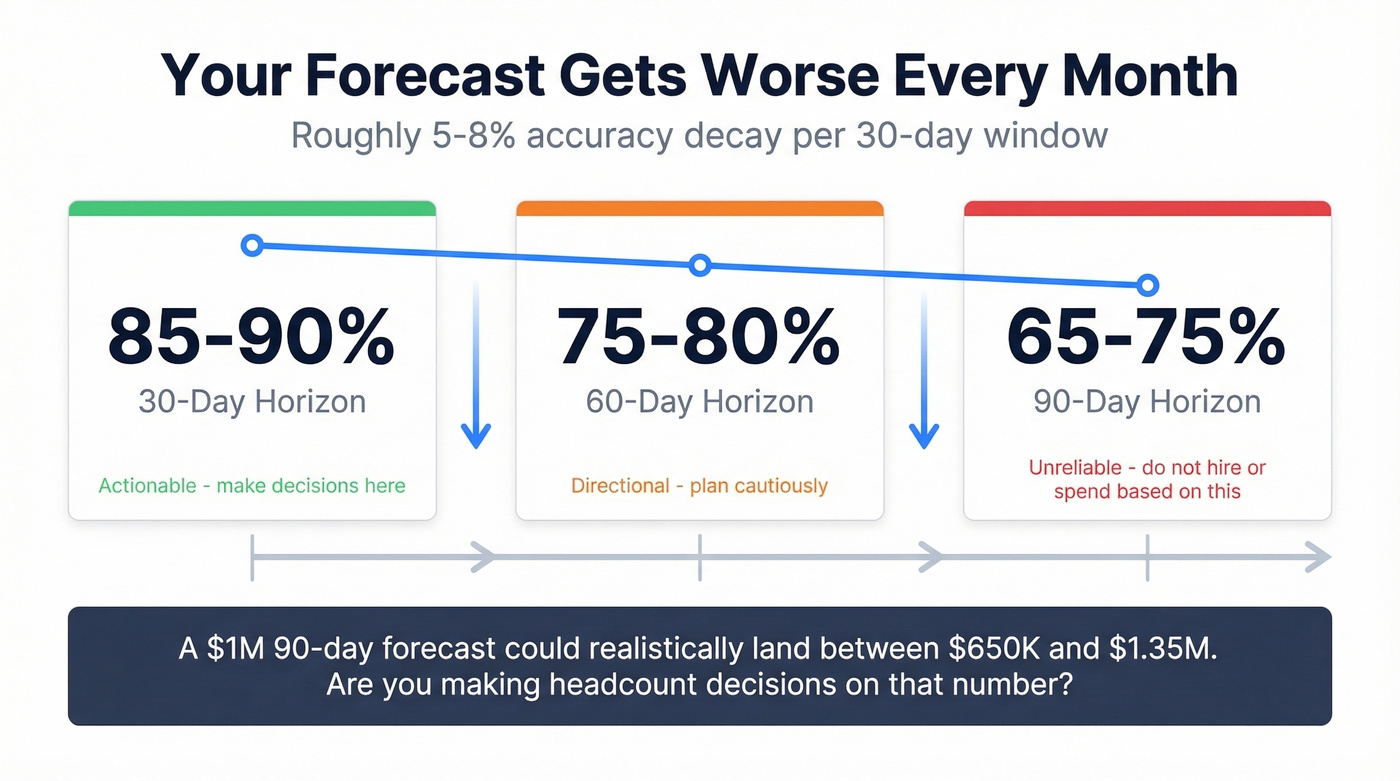
- 30-day horizon: 85-90% accuracy
- 60-day horizon: 75-80%
- 90-day horizon: 65-75%
That's roughly 5-8% decay per month. If your leadership team is making hiring and spending decisions based on a 90-day weighted forecast, they're often working with a number that's 25-35% off.
Calculating Stage Probabilities From CRM Data
Every guide tells you to "use historical data" for your stage probabilities. Almost none tell you how. Here's the actual method.
The Transition Matrix Method
This approach treats your pipeline like a Markov chain - each deal has a probability of moving from one stage to any other stage, including Closed Won and Closed Lost. Here's how to build it:
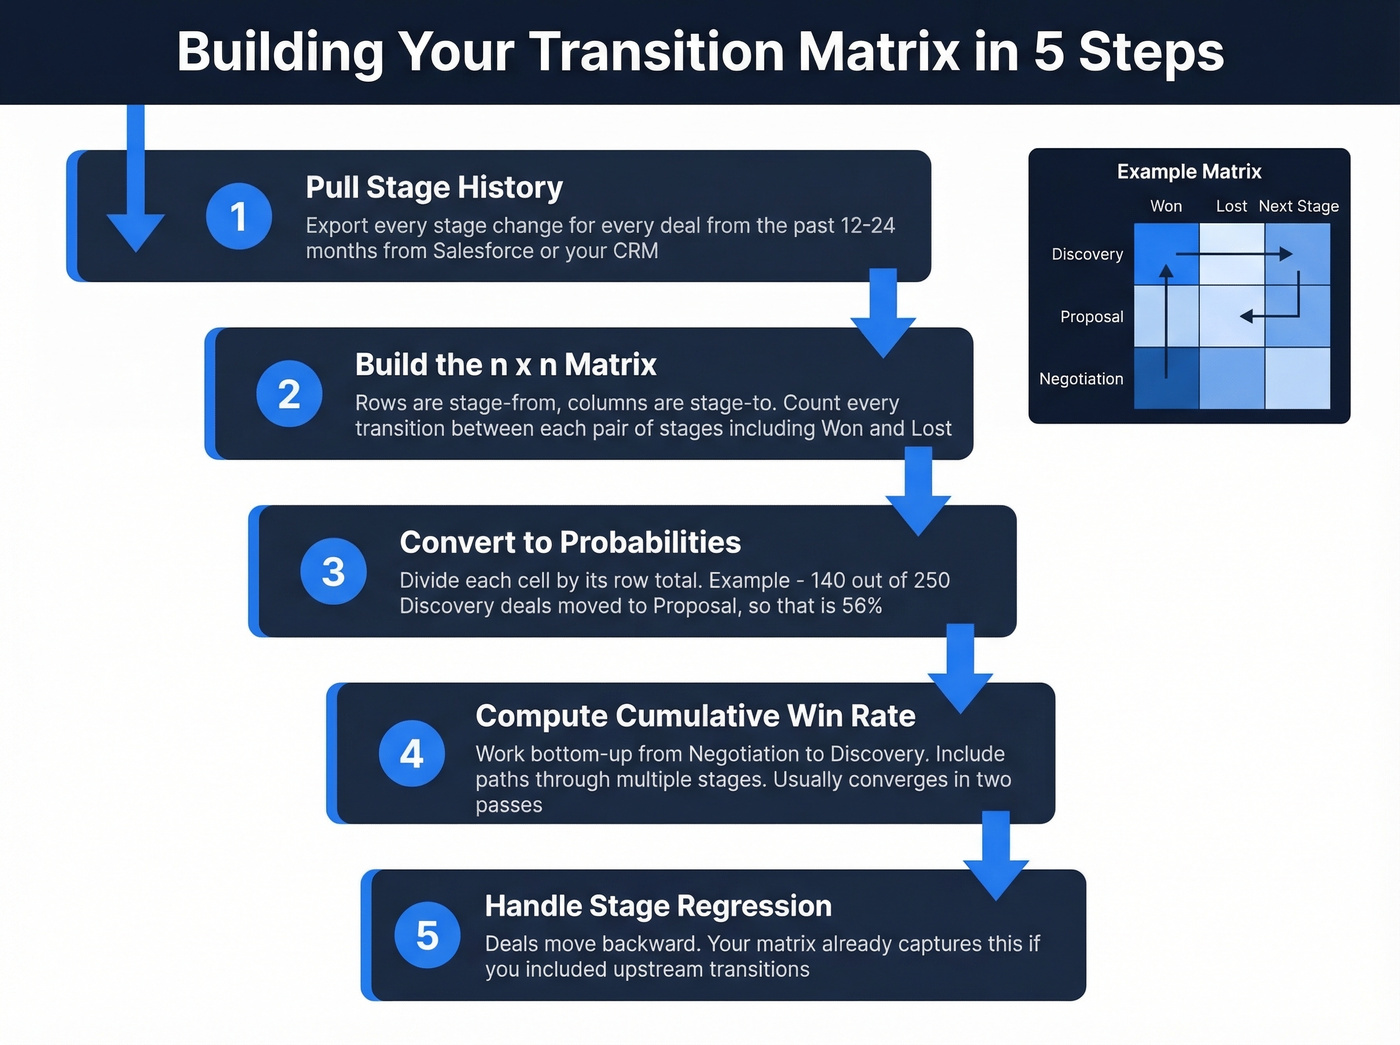
Step 1: Pull your opportunity stage field history from Salesforce or your CRM. You need every stage change for every deal over the past 12-24 months. In Salesforce, enable Opportunity Field History Tracking if it isn't already on.
Step 2: Build an n x n transition matrix. Rows are "stage from," columns are "stage to." Count how many times deals moved between each pair of stages.
Here's a simplified example with raw counts:
| From \ To | Discovery | Proposal | Negotiation | Won | Lost |
|---|---|---|---|---|---|
| Discovery | - | 140 | 10 | 5 | 95 |
| Proposal | 15 | - | 80 | 10 | 45 |
| Negotiation | 5 | 8 | - | 55 | 32 |
Step 3: Convert to probabilities by dividing each cell by its row total. Discovery to Proposal becomes 140/250 = 56%. Discovery to Lost = 95/250 = 38%.
Step 4: Compute cumulative win probability per stage by working bottom-up. Negotiation's win probability is straightforward: 55/100 = 55%. Proposal's win probability = P(Proposal to Won) + P(Proposal to Negotiation) x P(Negotiation to Won) + P(Proposal to Discovery) x P(Discovery to Won). Iterate this calculation until the numbers converge - usually about two passes.
Step 5: Handle stage regression. Deals move backward. Your matrix already captures this if you included upstream transitions. That's why the bottom-up calculation matters - it accounts for deals that bounce between stages before closing.
The "RevOps Team" Scenario
Here's where this gets real. You run the transition matrix and discover your Proposal stage has a 50% probability assigned in the CRM - but historically, only 22% of deals that reach Proposal actually close. You've been over-forecasting by 28 percentage points at that stage for two years. Every deal sitting in Proposal has been inflating your weighted pipeline by more than double its actual expected value.
We've seen this exact scenario play out at three different companies during pipeline audits. The fix took an afternoon. The impact on forecast accuracy was immediate.
Segmentation Matters
Don't calculate one set of probabilities for your entire pipeline. Acquisition deals, upsells, and renewals have wildly different conversion patterns. A renewal at Proposal stage closes at 75%. A net-new enterprise deal at the same stage? Maybe 18%.
Also compare amount-based vs. quantity-based probabilities. Amount-based analysis often reveals that early-stage probabilities are inflated - large deals that never close drag the weighted value up while the count-based close rate looks reasonable.
Stale CRM data is the #1 reason weighted pipelines miss by 25%+. Prospeo refreshes every record on a 7-day cycle - not the 6-week industry average - so your stage probabilities reflect real buyer data, not ghosts.
Stop forecasting on dead contacts. Start with data that's 7 days fresh.
When This Approach Breaks Down
The Small-Team Problem
If you're running fewer than 50 active deals, a weighted sales pipeline adds zero to little value. One enterprise deal represents 30-50% of your total forecast. When that deal slips - and enterprise deals slip - your forecast becomes meaningless overnight.
At the executive level in large orgs with hundreds of deals, single-deal variance washes out. For regional teams or startups, it doesn't. Use commit + best case forecasting with MEDDIC qualification gates instead. You'll get a more honest picture of what's actually closing.
The Data Quality Problem
Here's the thing: 66% of sales and finance professionals say their reporting systems can't access historical CRM performance data. That's the foundation of everything above - gone.
But there's a subtler problem. Stale contacts, bounced emails, and disconnected phone numbers create "phantom pipeline." Deals sit in stages looking active, but the prospect hasn't been reachable in months. We ran an audit on one client's pipeline and found 23% of "active" opportunities had at least one dead email or disconnected number on the primary contact. Those deals were inflating the weighted forecast by nearly $400K.
Decision Framework
Use weighted pipeline when:
- You have 100+ active deals per quarter
- You have 12+ months of CRM stage history
- You can segment by deal type
- You commit to quarterly recalibration
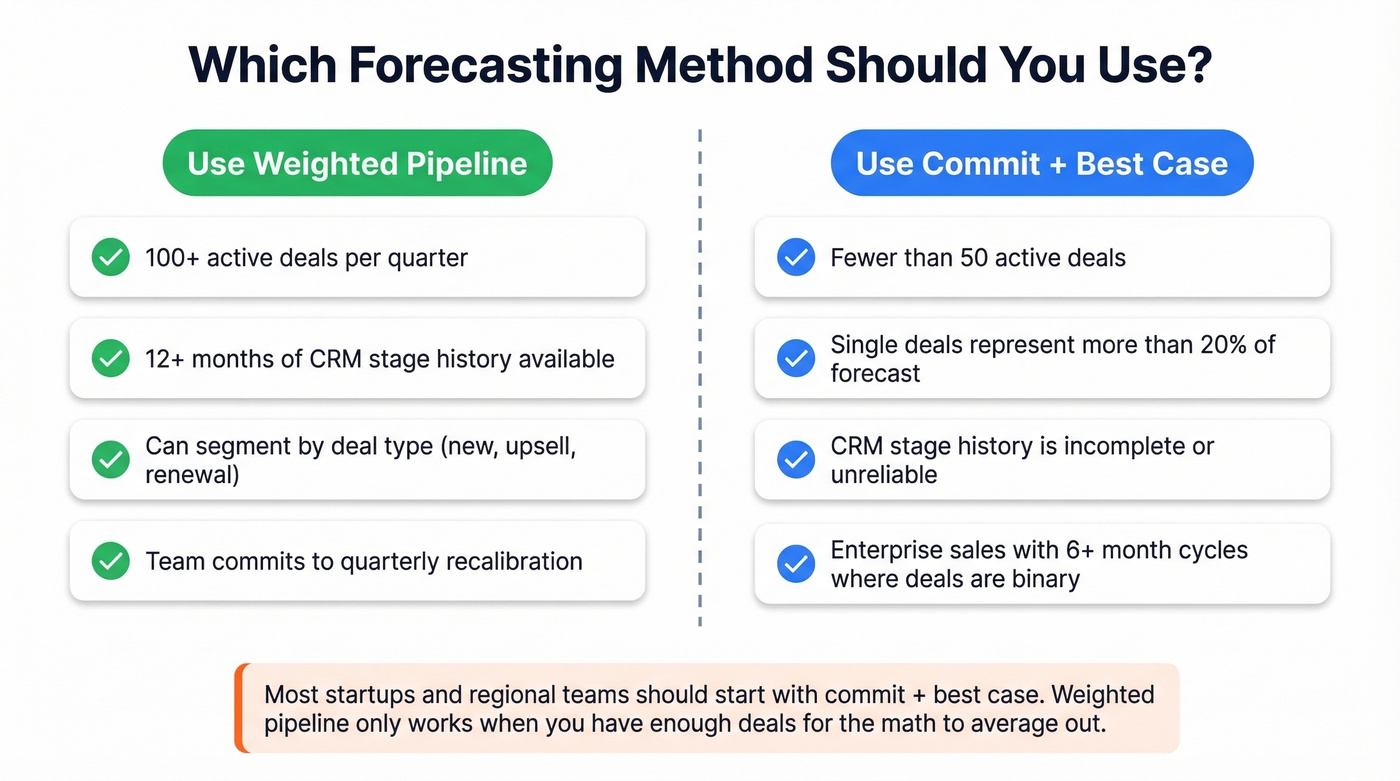
Switch to commit + best case when:
- Fewer than 50 active deals
- Single deals represent >20% of forecast
- CRM stage history is incomplete or unreliable
- You're selling enterprise with 6+ month cycles where deals are binary, not probabilistic
Stop Asking Reps for Probabilities
Forrester's Framework
Forrester's guidance is blunt: a forecast needs four data points - opportunity amount, sales stage, close date, and forecast category. Probability is explicitly excluded. The recommended categories are pipeline, best-case, commit, and closed.
Why? Because probabilities conflict with forecast categories and create nonsensical combinations. A rep marks a deal at "30% probability" and also puts it in "commit." Which one do you believe? The commit says it's closing. The probability says there's a 70% chance it won't. That contradiction poisons your forecast in both directions.
Four Probability Models
| Model | Best For | Primary Risk |
|---|---|---|
| Stage-based automatic | Consistency at scale | Ignores deal context |
| Rep judgment override | Capturing nuance | Bias and sandbagging |
| AI/ML predictions | Large, mature orgs | Needs 2+ yrs of data |
| Hybrid | Most teams | Complexity to manage |
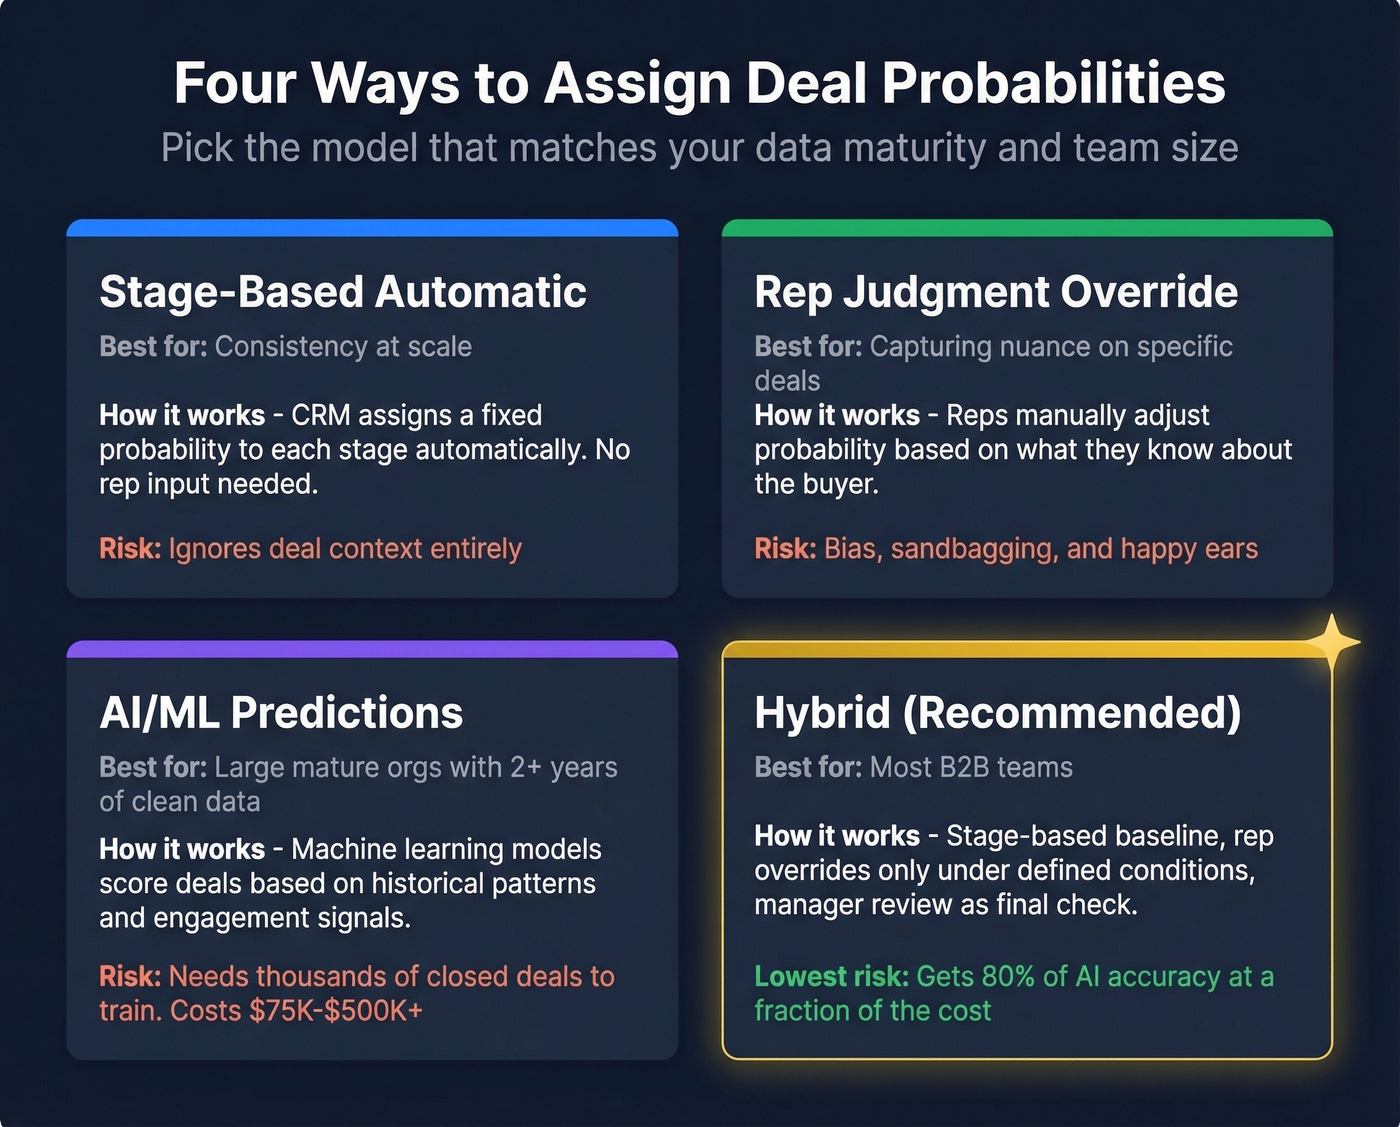
The hybrid approach works best for most teams: stage-based probabilities as the baseline, rep overrides only under defined conditions, AI flags when overrides diverge significantly, and manager review as the final check.
AI/ML sounds appealing, but it requires two-plus years of clean data and thousands of closed opportunities to train on. Implementation runs $75,000-$500,000+ depending on whether you build in-house or buy a platform. If you're a Series B company, you probably don't have the data or the budget. The hybrid model gets you most of the way there at a fraction of the cost.
Hot take: Most teams would get more forecast accuracy from spending a weekend cleaning their CRM data than from buying a six-figure AI forecasting tool. The bottleneck is almost never the model - it's the data feeding it.
Aggregate Bias Correction
Beyond stage-level probability calibration, consider applying a correction coefficient to your aggregate forecast. If your weighted pipeline has over-forecasted by 12% for three consecutive quarters, multiply the total by 0.88 before presenting it. This portfolio-level adjustment catches systematic biases that stage-level recalibration misses - things like seasonal patterns, market shifts, or a team-wide tendency toward optimism.
From Weighted Pipeline to Coverage Ratios
The "3x pipeline coverage" rule is everywhere, and it's lazy.
It assumes a 33% close rate across all stages, which is almost never true. Early-stage pipeline needs far more coverage because most of it won't close. Late-stage pipeline needs much less.
Here's how to calculate weighted coverage properly: take each stage's pipeline value, multiply by the calibrated conversion rate for that stage, sum the weighted values, and divide by quota. That's your real coverage number. High-ICP accounts represent only about 23% of total pipeline for many organizations, which means unweighted coverage counts a mountain of low-probability, low-fit deals as if they're real pipeline. Weighted coverage removes that illusion - and often reveals you're undercovered even when the raw number looks healthy.
Making It Work: The Calibration Checklist
Quarterly recalibration: Rebuild your transition matrix every quarter. Compare new probabilities against the ones you've been using. If any stage is off by more than 5 percentage points, update immediately.
CRM configuration: Enable stage history tracking in Salesforce. In HubSpot, you'll hit a frustrating limitation - there's no native report for historical close probability by stage. You'll need to export deal stage history and analyze it externally. The HubSpot community has been asking for this for years.
Minimum data requirements: You want dozens of closed outcomes per stage per segment before trusting stage probabilities. Anything less and you're building on noise.
Template resources: If you're not ready for a full CRM implementation, Close.com curates 12 pipeline templates for Excel and Google Sheets that include probability and weighted forecast fields. Enerpize also offers a free template designed for weighted forecasting.
Contact data verification: If a meaningful chunk of the emails in your pipeline bounce, your stage probabilities are built on phantom deals. Verify contact data on a rolling basis and flag stale records before they distort your forecast.

Your transition matrix is useless if half the contacts in Proposal stage have outdated emails and wrong titles. Prospeo's CRM enrichment returns 50+ data points per contact at a 92% match rate - so every deal in your weighted forecast maps to a real, reachable buyer.
Calibrate your forecast with contacts that actually pick up the phone.
FAQ
What's the difference between weighted and unweighted pipeline?
An unweighted pipeline sums every deal at face value - $200K across four deals regardless of close likelihood. A weighted pipeline multiplies each deal by its stage probability, so a $50K deal at 20% contributes just $10K. The gap between the two reveals how much early-stage inflation you're carrying.
How often should I recalibrate stage probabilities?
Quarterly at minimum. Rebuild the transition matrix, compare against current values, and update any stage that's drifted more than 5 percentage points. Last year's probabilities quietly become this year's forecast errors.
Can small teams use weighted pipeline effectively?
Generally no. Below 50 active deals, one slipped enterprise opportunity destroys the forecast. Use commit + best case with MEDDIC qualification gates instead - it gives a more honest picture without requiring statistical volume.