Addressable Market Explained: Definitions, Formulas, Data Sources, and Real Examples for 2026
A founder we know pitched a $12 trillion TAM to a room of seed investors. His product was a niche compliance tool for dental practices. The lead partner's response: "So you're going after the entire global healthcare market with a product for dentists?" That pitch didn't get a second meeting.
Getting your addressable market right isn't just an academic exercise. It's the difference between investor confidence and investor eye-rolls.
The Quick Version
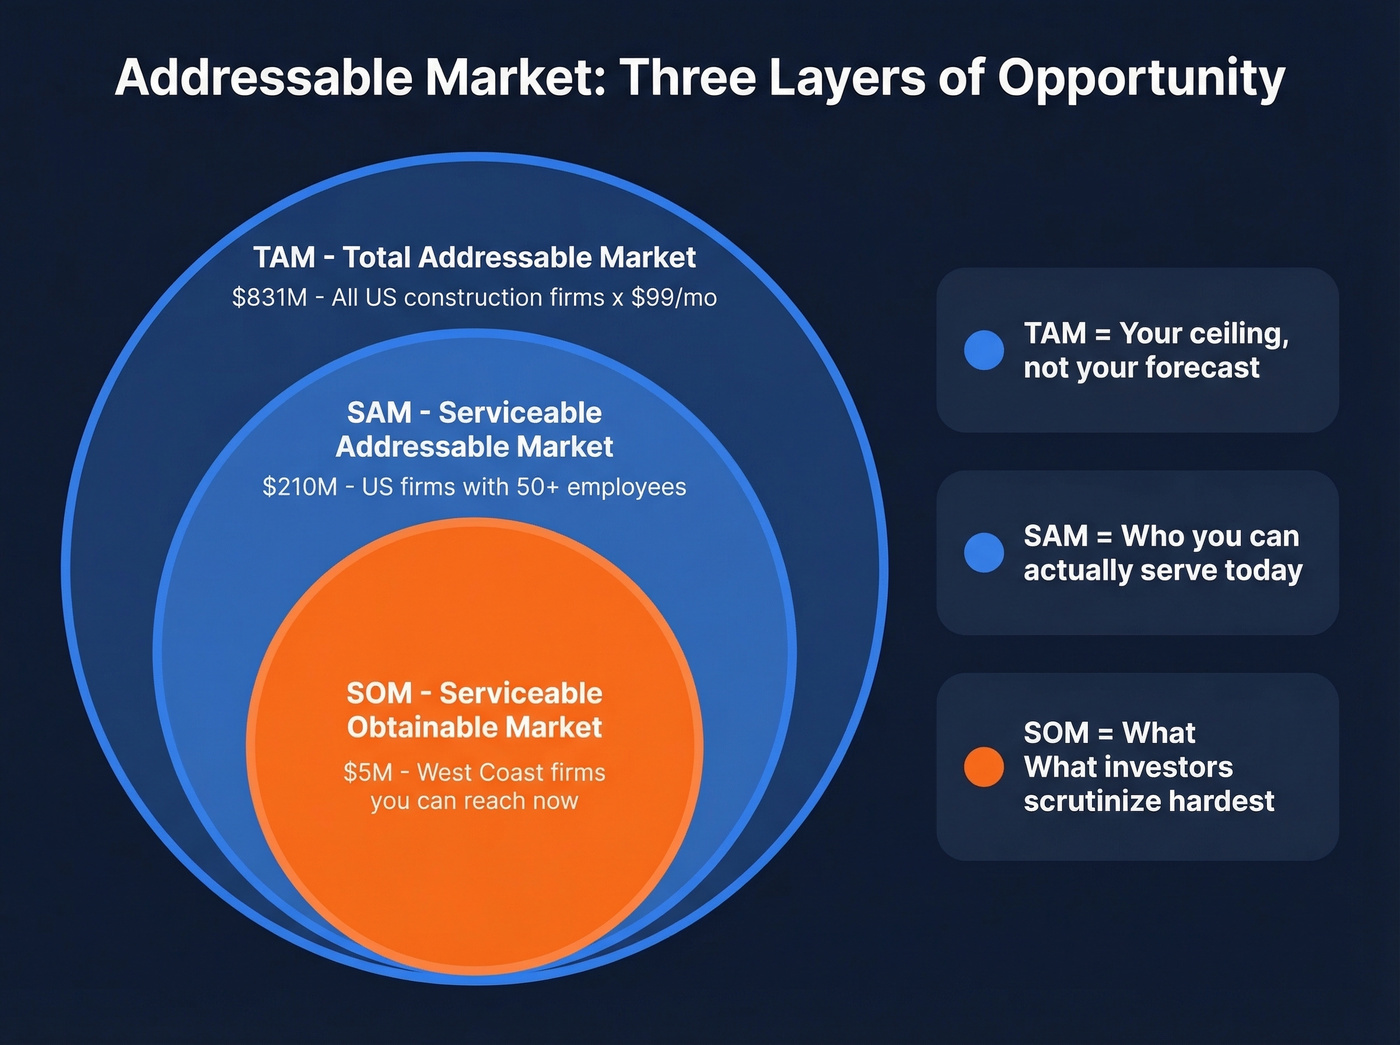
- TAM is the total revenue opportunity if you captured 100% of the market. It's a ceiling, not a forecast.
- SAM is the slice of TAM you can actually serve given your product, geography, and go-to-market constraints.
- SOM is what you'll capture in the near term - typically modeled over 1-3 years - and it's the number investors scrutinize hardest.
- Use bottom-up as your primary calculation method. Top-down numbers from analyst reports are a sanity check, not a strategy.
What Is an Addressable Market?
Your addressable market - usually called total addressable market, or TAM - is the total revenue opportunity available if your product achieved 100% market share. Not customers, not users. Revenue. That distinction matters because a market with 10 million potential customers at $10/month is a very different business than one with 100,000 customers at $10,000/year, even if the TAM numbers look similar on a slide.
No company ever captures 100% of its TAM, and claiming you will is a fast way to lose credibility. The value of TAM is directional: it tells you whether the opportunity is large enough to build a venture-scale business, or whether you're looking at a lifestyle business ceiling. Both are fine. Investors just care about which one they're funding.
TAM vs SAM vs SOM
These three acronyms nest inside each other like concentric circles. TAM is the outer ring - the entire opportunity. SAM (Serviceable Addressable Market) narrows that to the segment you can actually serve today. SOM (Serviceable Obtainable Market) is the innermost circle, what you'll realistically capture in the near term.
Here's the thing most guides skip: SOM isn't just a smaller number. It implies a GTM plan. If your SOM is $5M at $5K/year per customer, you're saying you'll acquire 1,000 customers in 24 months. That's a specific, testable claim - and investors love specific, testable claims.
| Term | Definition | Example |
|---|---|---|
| TAM | Total revenue at 100% share | All construction firms x $99/mo |
| SAM | Segment you can serve | US firms with 50+ employees |
| SOM | What you'll capture near-term | West Coast firms you can reach |
The status quo deserves its own row in your competitive analysis. For most B2B products, the real competitor isn't another vendor - it's Excel, manual processes, or simply doing nothing. Your SOM calculation needs to account for that switching friction. A Reddit thread on r/startups captures this well: a SaaS founder struggled to define SAM for a global product because "anyone with internet access" felt too broad. It is. SAM should reflect your ICP constraints - company size, industry, tech stack, budget authority - not just who could theoretically sign up.
Three Ways to Calculate Market Size
Top-Down (Analyst Reports)
Start with a published market size from Gartner, IDC, or IBISWorld, then narrow it to your segment. If the global project management software market is $7B and you only serve construction firms with 50+ employees in North America, you're slicing that number down hard.
Top-down is fast and easy to cite. It's also the method investors trust least. As Matrix Partners has noted, TAM slides built from analyst reports are "among the most frequently mis-executed" in pitch decks - often included as a formality rather than genuine insight.
Bottom-Up (Units x Revenue)
This is the method that earns credibility. You're counting actual potential customers and multiplying by what they'd pay.
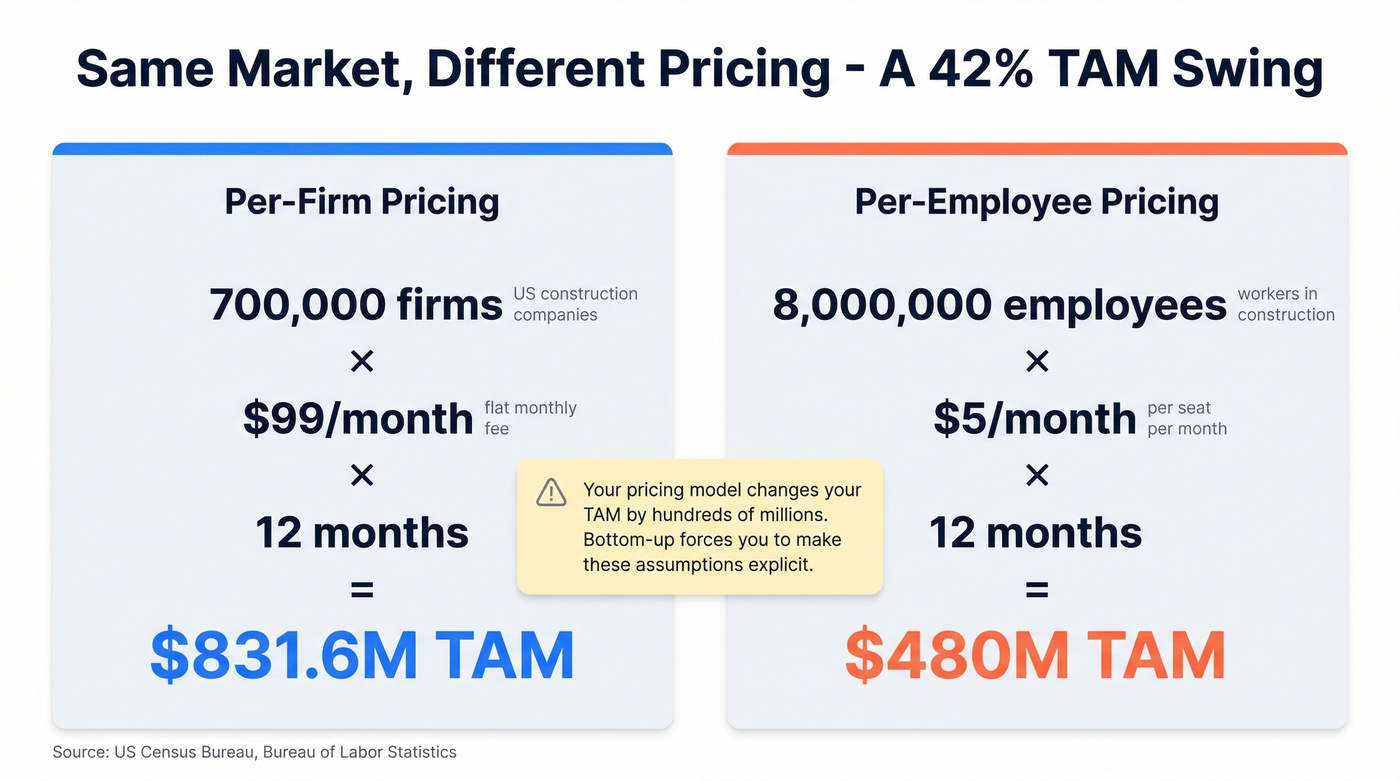
Say you're building project management software for construction firms. The US has roughly 700,000 construction firms and 8 million employees. Two pricing models produce dramatically different TAMs:
- Per-firm pricing: 700,000 firms x $99/month x 12 = $831.6M TAM
- Per-employee pricing: 8,000,000 employees x $5/month x 12 = $480M TAM
That's a 42% difference based solely on how you price. This is why bottom-up matters - it forces you to make explicit assumptions that investors can interrogate and validate. Your SAM then applies constraints (only firms with 50+ employees), and your SOM narrows further (West Coast states you can reach with your current sales team).
Value Theory (Willingness to Pay)
Value-theory TAM prices your product based on the value it creates, not on comparable products. If your software saves a construction firm $50,000/year in project delays, charging $5,000/year captures 10% of the value created. Multiply that by 100,000 firms in your segment, and your value-theory TAM is $500M - grounded in economic impact rather than competitor benchmarking.
This method works best for genuinely novel products where no direct comparable exists. It's harder to defend in a pitch because it requires proving the value claim, but when done well, it signals deep understanding of your customer's economics.
Bottom-up market sizing only works when you can count real companies that match your ICP. Prospeo's database of 300M+ profiles with 30+ filters - industry, headcount, revenue, technographics, funding - lets you validate TAM assumptions against actual companies, not Census estimates from two years ago.
Turn your addressable market from a guess into a verified list.
Where to Find Market Sizing Data
Every guide says "use industry reports." Let's be honest - none of them tell you which ones, what they cost, or what they're actually good for.
| Source | Type | Best For | Cost |
|---|---|---|---|
| US Census Bureau | Free | Firm counts by industry & size | Free |
| Bureau of Labor Statistics | Free | Roles by industry (seat-based TAM) | Free |
| OECD / UN Data | Free | International economic data | Free |
| SEC Filings | Free | Competitor financials | Free |
| ITC Trade Map | Free | Import/export company lists | Free |
| Crunchbase | Freemium | Startup/company insights | Free tier; paid from ~$50+/mo |
| PitchBook | Paid | VC-backed company data | ~$20K+/yr |
| Gartner / Forrester / IDC | Paid | Industry market sizing | $2K-$10K+ per report |
| IBISWorld | Paid | NAICS-mapped industry reports | ~$1K-$3K+ per report |
Start with free sources. The Census Bureau counts every business by industry, size, and state. It's updated annually, though it runs a couple years behind. For seat-based TAM models, BLS data on roles by industry is invaluable. Start there before spending thousands on an analyst report.
Once you've sized your market with these sources, you need to validate those numbers against real companies. We've found that filtering Prospeo's database by industry, headcount, revenue, and technographics lets you pressure-test bottom-up assumptions against actual company data rather than relying solely on Census aggregates.
Five TAM Mistakes That Kill Confidence
1. The 1% Fallacy
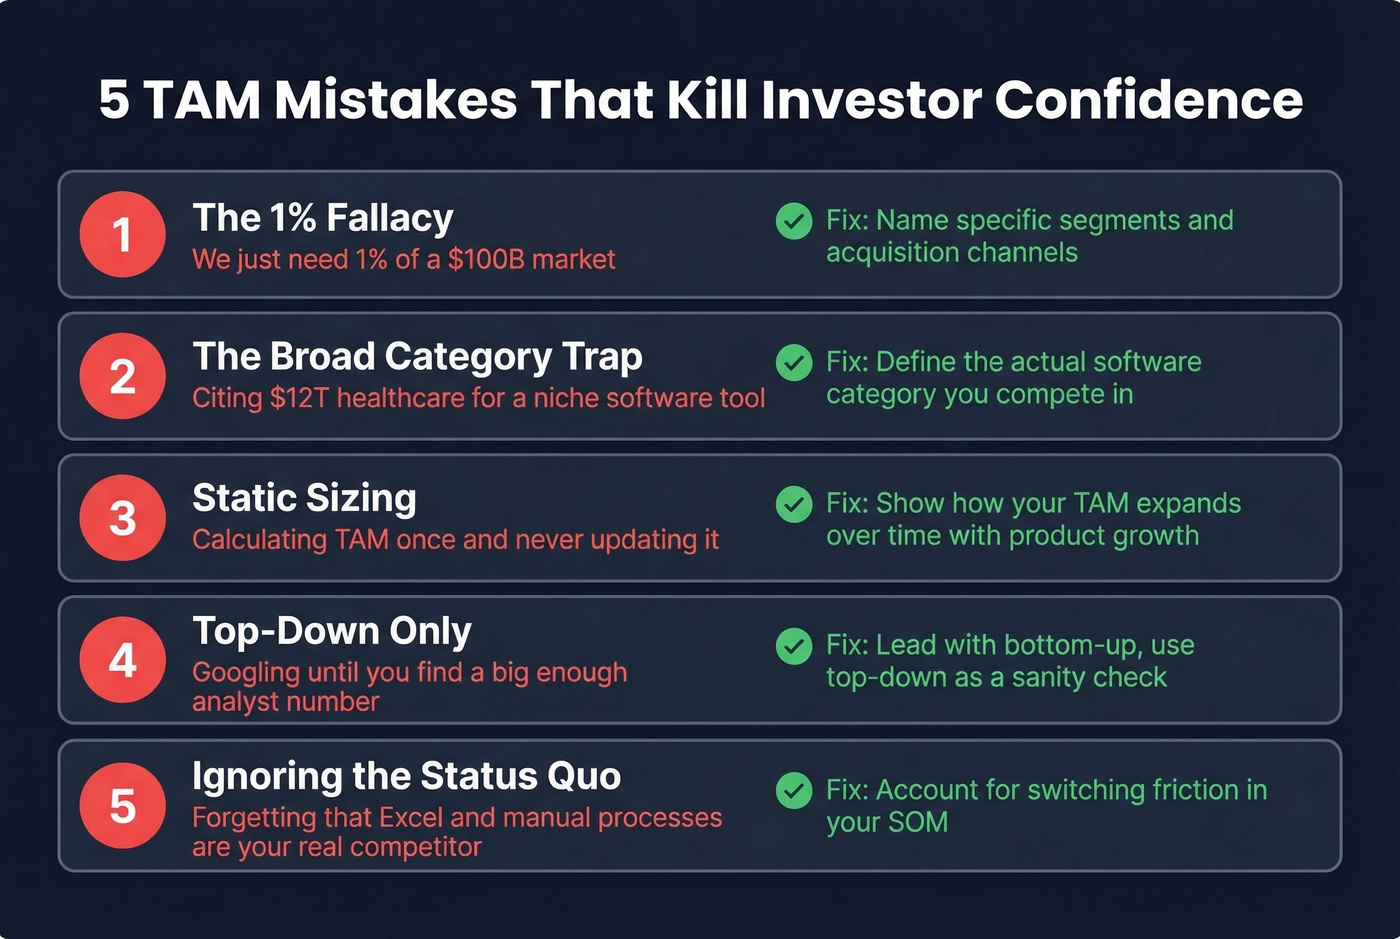
"The market is $100 billion. We just need 1%." Investors read this as a confession of laziness. It says nothing about how you'll capture that 1%, who those customers are, or why they'd choose you. Replace it with a bottom-up SOM that names specific customer segments and acquisition channels.
2. The Broad Category Trap
Citing "global healthcare: $12 trillion" as your TAM when you sell cardiovascular diagnostics software is a credibility killer. Your TAM is the cardiovascular diagnostics software market, not all of healthcare. The meaning of your market opportunity shifts entirely when you narrow from a macro category to the segment your product actually serves.
3. Static Sizing
Markets move. Competitors enter. Pricing changes. A TAM calculated once and never revisited becomes stale within quarters. Strong founders explain how their TAM expands over time - Uber didn't just capture the taxi market, it expanded the transportation market by reducing friction.
4. Top-Down Only
Here's a pattern we see constantly in B2B SaaS: a founder Googles until they find an analyst number big enough, drops it on a slide, and moves on. Investors discount top-down TAM heavily. One AI-CRM startup used top-down sizing exclusively, ignored competitive dynamics and niche realities, then targeted too broadly. The result was high CAC, scattered sales efforts, and a down round. A bottom-up analysis with competitive context would've shown a smaller but more defensible initial market.
5. Ignoring the Status Quo
Your competitor isn't always another software company. It's often Excel, manual processes, or organizational inertia. If a big chunk of your target market is "solving" the problem with spreadsheets and doesn't feel enough pain to switch, your SOM needs to reflect that reality. Skip this mistake and you'll end up with a SOM that looks great on paper but produces brutal CAC numbers in practice.
Real-World TAM Case Studies
Uber: The $100B Miscalculation
In 2014, NYU professor Aswath Damodaran valued Uber by anchoring to the global taxi and car-service market at $100 billion. He assumed a maximum 10% market share, arriving at a $5.9 billion valuation - well below Uber's $17 billion valuation at the time.
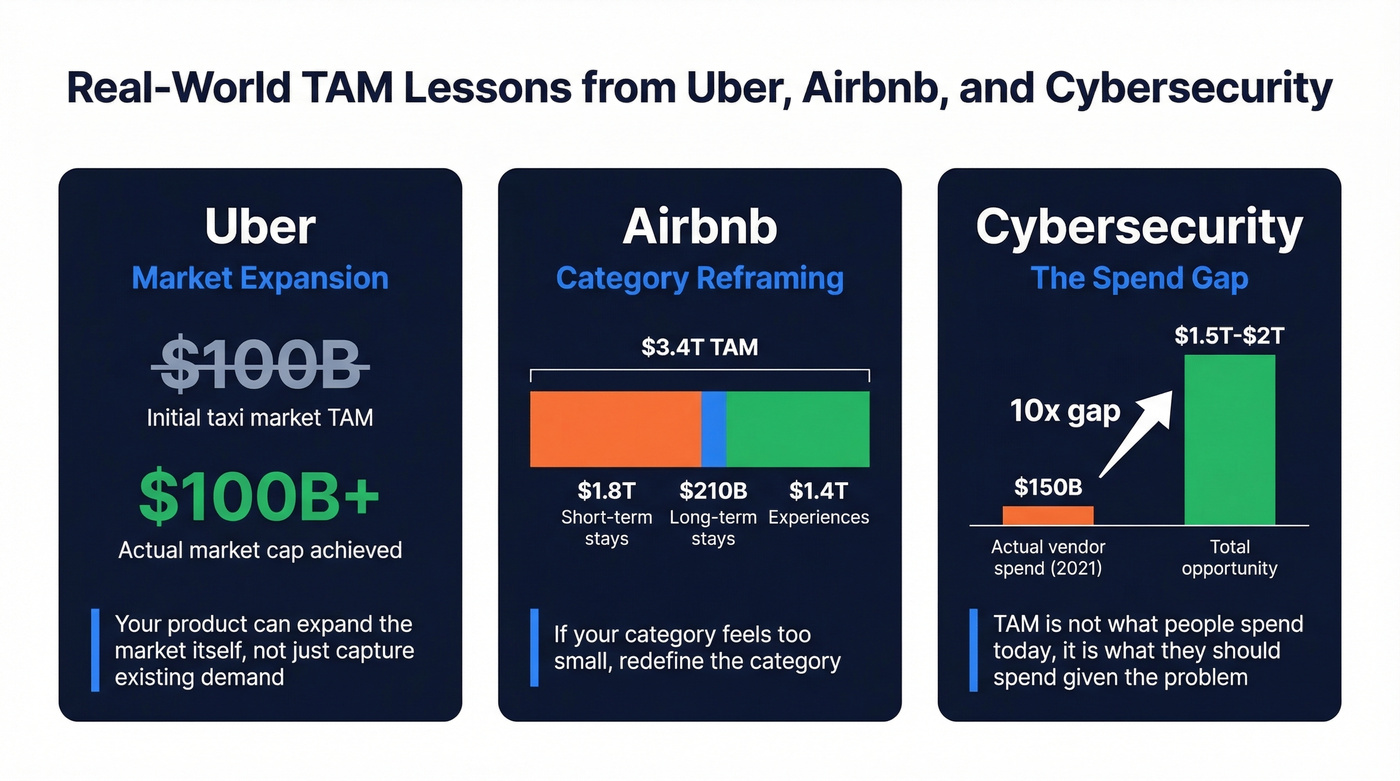
Bill Gurley's rebuttal argued Damodaran could be off by 25x, because Uber wasn't just capturing existing taxi demand - it was creating new demand through shorter pickup times, one-tap payments, and improved trust. Uber later reached around a $100 billion market cap. The lesson: anchoring TAM to an existing market ignores the possibility that your product expands the market itself.
Airbnb: Reframing the Category
Airbnb shows how far TAM can stretch when you define the category differently. One widely cited breakdown pegs Airbnb's SAM at around $1.5T and its TAM at $3.4T, comprising $1.8T short-term stays, $210B longer-term stays, and $1.4T experiences. If you're defining your opportunity and the category feels too small, the problem might not be your business. It might be your category definition.
Cybersecurity: The 10x Spend Gap
McKinsey estimated the global cybersecurity TAM at $1.5T-$2.0T as of 2022. Actual vendor spend sat at roughly $150B in 2021. That's a 10x gap between current spend and the total opportunity - and while the gap has narrowed since, it remains massive.
This is a powerful framing for any market where adoption is still early: your TAM isn't what people spend today, it's what they should spend given the problem's severity. The gap between the addressed market and the total opportunity represents the whitespace where new entrants can win.
What Investors Actually Want
Stop obsessing over TAM. Investors care about SOM.
TAM shows upside potential, but SOM and SAM de-risk the investment. A massive TAM with no credible path to capturing it is just a fantasy. The core reason founders get this wrong is that they treat market sizing as a formality rather than a demonstration of market understanding.
Here's the investor math. Say your TAM is $2 billion, SAM is $100 million, and your SOM is $5 million by year two. At a 25% EBITDA margin, that's $1.25 million in EBITDA. Apply an 8x exit multiple, and the company's worth $10 million. An investor who put in $250K for 20% equity sees an 8x return. Push SOM to $12 million by year four, and that same investor's return jumps to 19.2x. That's the chain investors are building in their heads: SOM to margin to valuation to return multiple. Your TAM slide sets the ceiling. Your SOM slide is the investment thesis.
One nuance worth flagging: disruption can shrink or expand TAM. An online encyclopedia destroyed the physical encyclopedia market's TAM. Uber expanded the transportation TAM. Investors want to see that you've thought about which direction your disruption cuts.
If your average deal size is under five figures, you probably don't need a Gartner-sourced TAM at all. A well-built bottom-up model using Census data and your own customer interviews will be more credible - and more useful for actually running the business.
From Market Sizing to Prospect List
TAM is a number on a slide. Your prospect list is how you capture it.
Founders calculate a SOM of $15 million from 3,000 mid-market accounts, then stop at the spreadsheet. The gap between "I know my market" and "I'm reaching those accounts" is where deals die. We've watched teams spend weeks on market sizing only to stall because they couldn't find verified contact data for the companies they'd identified.
Prospeo bridges that gap - 30+ filters including industry, headcount, revenue, and technographics let you build a list that maps directly to your SAM. With 98% email accuracy and a 7-day data refresh cycle, you're reaching real people at real companies, not bouncing off stale records.

You've sized your SAM. Now you need to reach it. Prospeo gives you verified emails (98% accuracy) and direct dials for every company in your serviceable market - filtered by the exact ICP constraints you used to calculate SOM. Data refreshed every 7 days, starting at $0.01 per email.
Go from market sizing spreadsheet to pipeline in minutes.
FAQ
How often should I update my TAM?
Quarterly at minimum. Markets shift, competitors enter, and pricing evolves. A static TAM signals you're not tracking the market you claim to understand. Revisit your bottom-up assumptions each quarter and adjust for churn data, new segments, and pricing changes.
What's the difference between TAM and market size?
Market size measures current spend - the addressed market as it exists today. TAM measures total potential revenue if every possible customer bought your product. The gap between them represents untapped opportunity where new entrants can win share.
How do I calculate SAM for a global SaaS?
Define SAM by ICP characteristics rather than geography alone: company size, industry vertical, tech stack, and buying maturity. "Anyone with internet access" isn't a SAM. You need to quantify exactly how many companies match your ICP criteria using filters like headcount, revenue, and technographics.
How big should your addressable market be?
For venture-scale businesses, most investors want to see a TAM above $1B with a credible SOM of $5M-$20M within two years. Below that threshold, you're likely building a profitable niche business - which is fine, but it changes who funds you and at what terms.
Should I use paid reports or DIY my TAM?
Both - triangulation beats either method alone. Use free sources like the Census Bureau and BLS for your bottom-up model, then cross-check against one paid analyst report. The bottom-up number earns credibility; the top-down number provides a sanity check.