Addressable Markets: TAM, SAM, and SOM (Plus How to Calculate Them)
Investors spend 3 minutes and 44 seconds on your entire pitch deck. Your TAM slide gets a fraction of that - and if it opens with a trillion-dollar number pulled from a Gartner report, those seconds end with an eye roll. Inaccurate addressable market estimates cost businesses up to $15M annually. The difference between a credible market slide and a lazy one isn't the size of the number. It's whether you can defend how you got there.
The Quick Version
- TAM = total revenue if you sold to every possible customer. SAM = the slice you can actually reach. SOM = what you'll realistically capture.
- Investors trust bottom-up sizing over top-down. Always lead with bottom-up.
- SOM benchmarks that won't get you laughed out of the room: 1% of SAM in Year 1, 3% in Year 2, 5% in Year 3.
- Cross-check rule of thumb: if your top-down and bottom-up estimates land within 2x of each other, your assumptions are healthy. If they're 10x apart, something's broken.
- "We only need 1% of the market" is the fastest way to lose investor credibility. It dodges the only question that matters: why you win.
What "Addressable Markets" Actually Means
Let's get the definitions clean, because sloppy usage here creates sloppy strategy everywhere else.
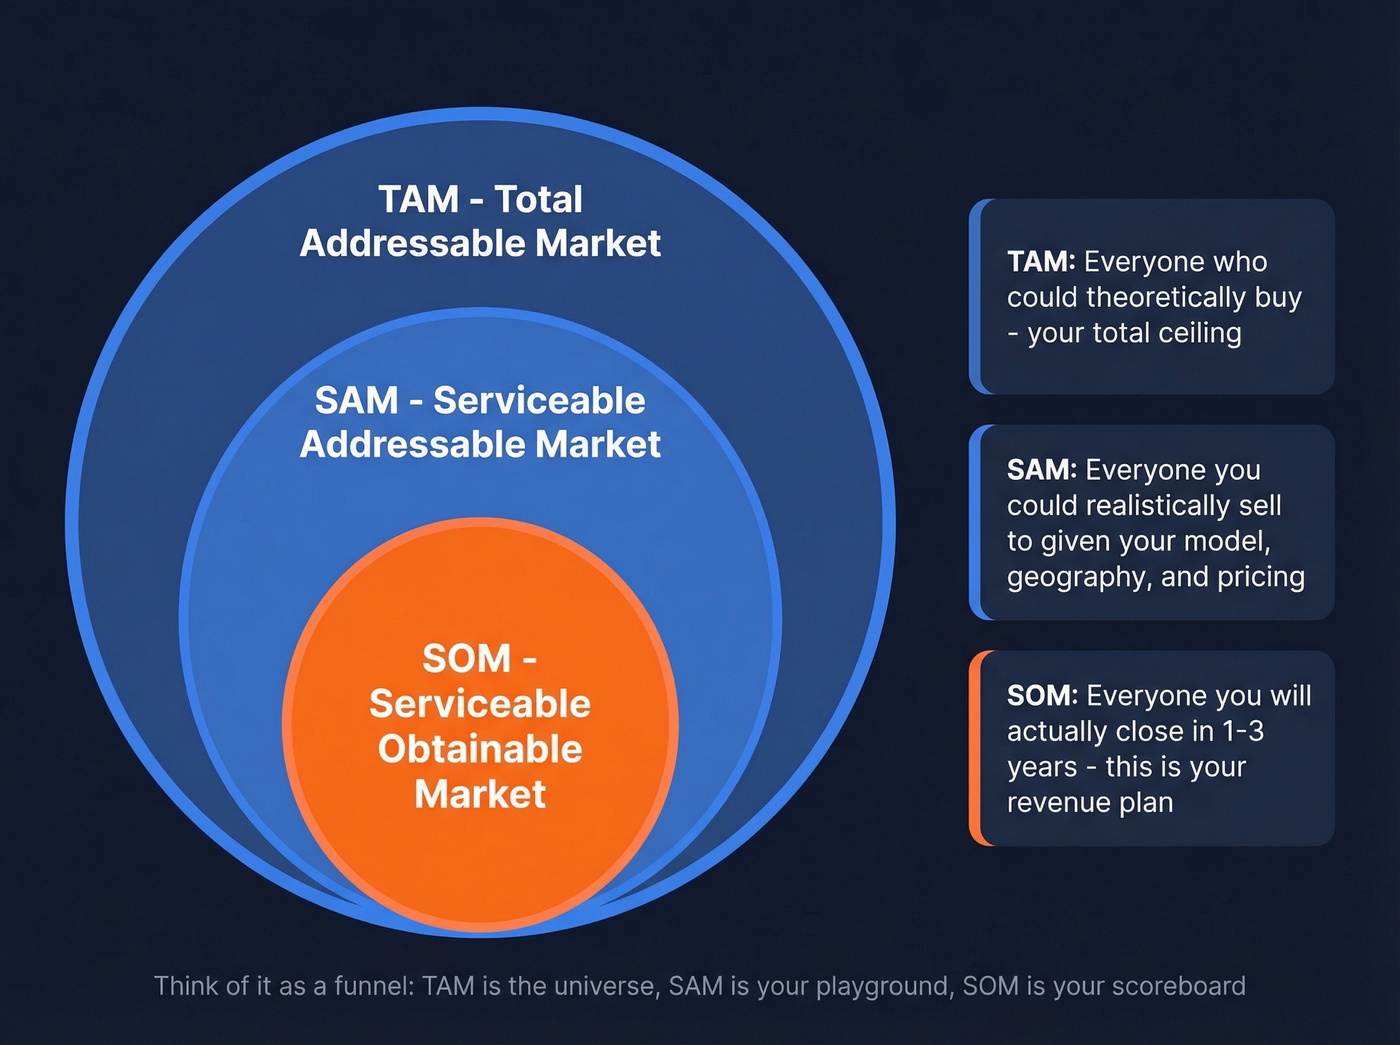
Total Addressable Market (TAM) is the entire revenue opportunity available if you captured 100% of the market for your product or service. It's the theoretical ceiling. Nobody hits it - not even monopolies - but it tells investors and leadership how big the opportunity could be. The universal formula: number of potential customers x average revenue per customer (ARPU or ACV).
Serviceable Addressable Market (SAM) is the portion of TAM you can actually reach with your current business model, geography, pricing, and distribution. If your TAM is the global market for CRM software, your SAM might be mid-market SaaS companies in North America that can afford your $15K/year price point. SAM is where strategy starts to matter - it's the segment where your go-to-market motion can gain traction.
Serviceable Obtainable Market (SOM) is the realistic share of SAM you can capture in a defined timeframe, usually one to three years. This is the number investors care about most, because it's tied to your actual revenue plan, sales capacity, and competitive position.
Think of it as a funnel. TAM is everyone who could theoretically buy. SAM is everyone you could theoretically sell to. SOM is everyone you'll actually close. As ProductPlan's TAM guide notes, TAM represents the maximum size of the opportunity - but the real work happens in narrowing it down.
Related terms you'll hit in every market sizing conversation: ARPU (average revenue per user), ACV (annual contract value), ICP (ideal customer profile), and beachhead market (the initial segment you dominate before expanding).
Why Market Sizing Matters
Market sizing isn't just a fundraising exercise. It drives decisions across the entire business.
Strategy and product roadmap. Your TAM tells you whether you're building in a $500M niche or a $50B category. That changes everything - from feature prioritization to partnership strategy to whether you should even be venture-backed. A rigorous market analysis early on prevents you from chasing a category that can't support your ambitions.
Go-to-market planning. SAM determines where your reps focus. If you haven't defined it rigorously, your SDRs are spraying emails at accounts that'll never convert. We've seen teams waste entire quarters targeting segments that looked big on paper but had zero buying intent - burning budget and morale in the process.
Hiring and resource allocation. SOM drives headcount models. If your realistic Year 1 capture is $5M in revenue and your average deal is $50K, you need roughly 100 closed deals. Work backward from there to figure out how many reps, how much pipeline, and how much marketing spend you need.
Fundraising. Investors use TAM to gauge upside and SOM to gauge realism. In one review of 82 pitch decks, 55% had inadequate market analysis. That's the majority of founders failing the most basic credibility test.
The operational cost of getting it wrong goes beyond your pitch deck. Bad market data misallocates capital, sends sales teams chasing unqualified leads, sets unrealistic targets that crush morale, and erodes investor confidence when you miss forecasts.
Calculate It Three Ways
There are three core approaches to market sizing. Each has a purpose, and the best models use at least two.
Top-Down (Sanity Check Only)
Top-down starts with a big number from an analyst report and narrows it with assumptions. Example: "The global CRM market is $80B. We target mid-market companies, which represent 15% of spend. Our addressable segment is $12B."
It's fast, and it's useful as a gut check. But here's the rule: cite your source and show every filter. If you can't explain each step from the macro number down to your segment, it's not analysis - it's decoration.
The trap is taking a massive industry figure, slapping a percentage on it, and calling it a TAM. An AI-driven CRM startup that cites "$80B global CRM market" without filtering for company size, geography, willingness to switch, and pricing tier will get torn apart by any investor who's seen this pattern a hundred times before. Top-down is a sanity check. It's never the main event.
Bottom-Up (Investor-Ready)
Bottom-up is what investors actually trust. You start from tangible inputs and build upward.
The formula: target customers x ACV x time period.
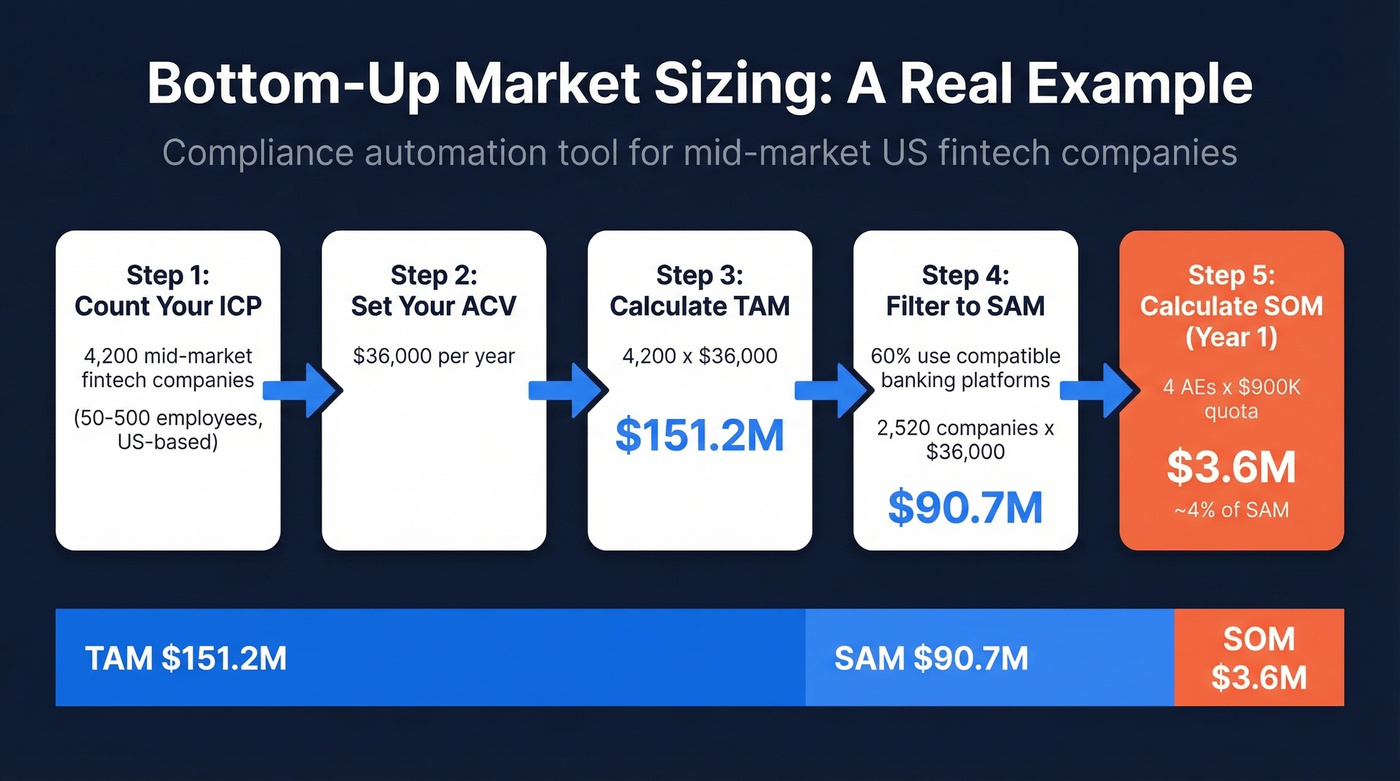
Say you're selling a compliance automation tool to mid-market fintech companies with 50-500 employees in the US. You identify 4,200 companies that match your ICP. Your ACV is $36,000/year. Your TAM is 4,200 x $36,000 = $151.2M.
Now narrow to SAM. You only sell direct, your team handles English-speaking markets, and your product integrates with three core banking platforms covering about 60% of those companies. SAM: 4,200 x 0.60 x $36,000 = $90.72M.
SOM for Year 1? You have 4 AEs, each carrying a $900K quota. Realistic SOM: $3.6M, or about 4% of SAM. That's defensible.
The r/startups community puts it simply: "Target users x realistic price x time." Start small, show real data, prove penetration.
Not everything has to be SaaS. If you're opening a pizza shop, your TAM might be every household within a 10-mile radius multiplied by average annual pizza spend. The math is the same - count your buyers, estimate their spend, multiply. Bottom-up works for any business.
Value Theory (New Categories)
Value theory works when there's no existing market to measure - when you're creating a category rather than entering one. Instead of counting existing buyers, you estimate willingness to pay based on the value your product delivers.
If your tool saves a compliance officer 20 hours per week at $85/hour fully loaded, you're creating $1,700/week in value, roughly $88K/year. Price at ~$30K/year, and your ACV is ~$30K. Multiply by the number of companies with this pain point, and you've got a TAM.
Tesla used a version of this early on. Instead of sizing the "car market," they started with luxury EV buyers willing to pay $80K+ and built upward as battery costs fell and the reachable segment expanded. Value theory is the hardest method to defend, but it's the right one when you're genuinely building something new.
Cross-Check With the Hybrid Method
Any single method can mislead you. The real confidence comes from running at least two and comparing the results.
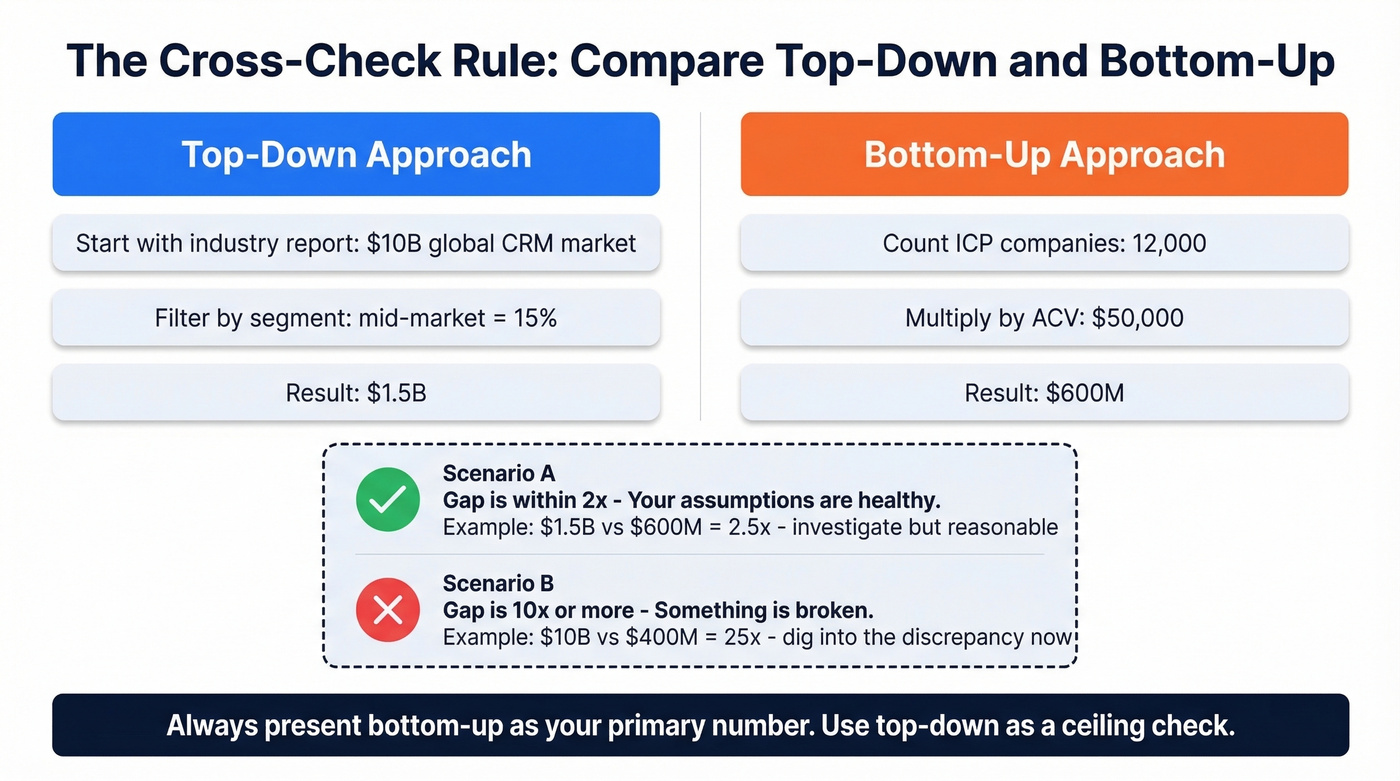
A practical example from Olympus Intel: a top-down estimate of CRM spend yields a $10B TAM, while the bottom-up count of target companies x ACV produces $400M. That's a 25x gap. Something is fundamentally wrong - either the top-down number includes segments you can't serve, or the bottom-up is missing entire customer categories.
The heuristic we use: within 2x is healthy. Your top-down and bottom-up won't match perfectly, and they shouldn't. A 2x gap means your assumptions are in the right ballpark. A 10x gap means an assumption is wrong. Maybe your ICP is too narrow. Maybe the industry report includes adjacent markets. Don't average the two numbers and call it done - dig into the gap. That's where the insight lives.
Run both methods. Compare. Investigate discrepancies. Present the bottom-up as your primary number and the top-down as your ceiling check.
Bottom-up market sizing requires real buyer counts, not analyst estimates. Prospeo's database of 300M+ profiles with 30+ filters - including industry, headcount, revenue, technographics, and buyer intent - lets you count exactly how many companies match your ICP. That's your TAM built on actual data, not assumptions.
Build your bottom-up TAM with real company counts, not guesswork.
SAM & SOM: The Credibility Test
TAM is theory. SOM is what gets you funded.
Investors know your TAM is aspirational. What they're really evaluating is whether your SAM is honest and your SOM is achievable. A founder who presents a $2B TAM with a $5M Year 1 SOM and can explain exactly how they'll get there - that's someone who understands their business. A founder who presents a $50B TAM and waves their hands about "capturing just a fraction" - that's someone who hasn't done the work.
Antler calls this the Goldilocks problem: a TAM that's too big signals you haven't filtered; too small signals the opportunity isn't venture-scale. You need a number large enough to justify investment but specific enough to be credible.
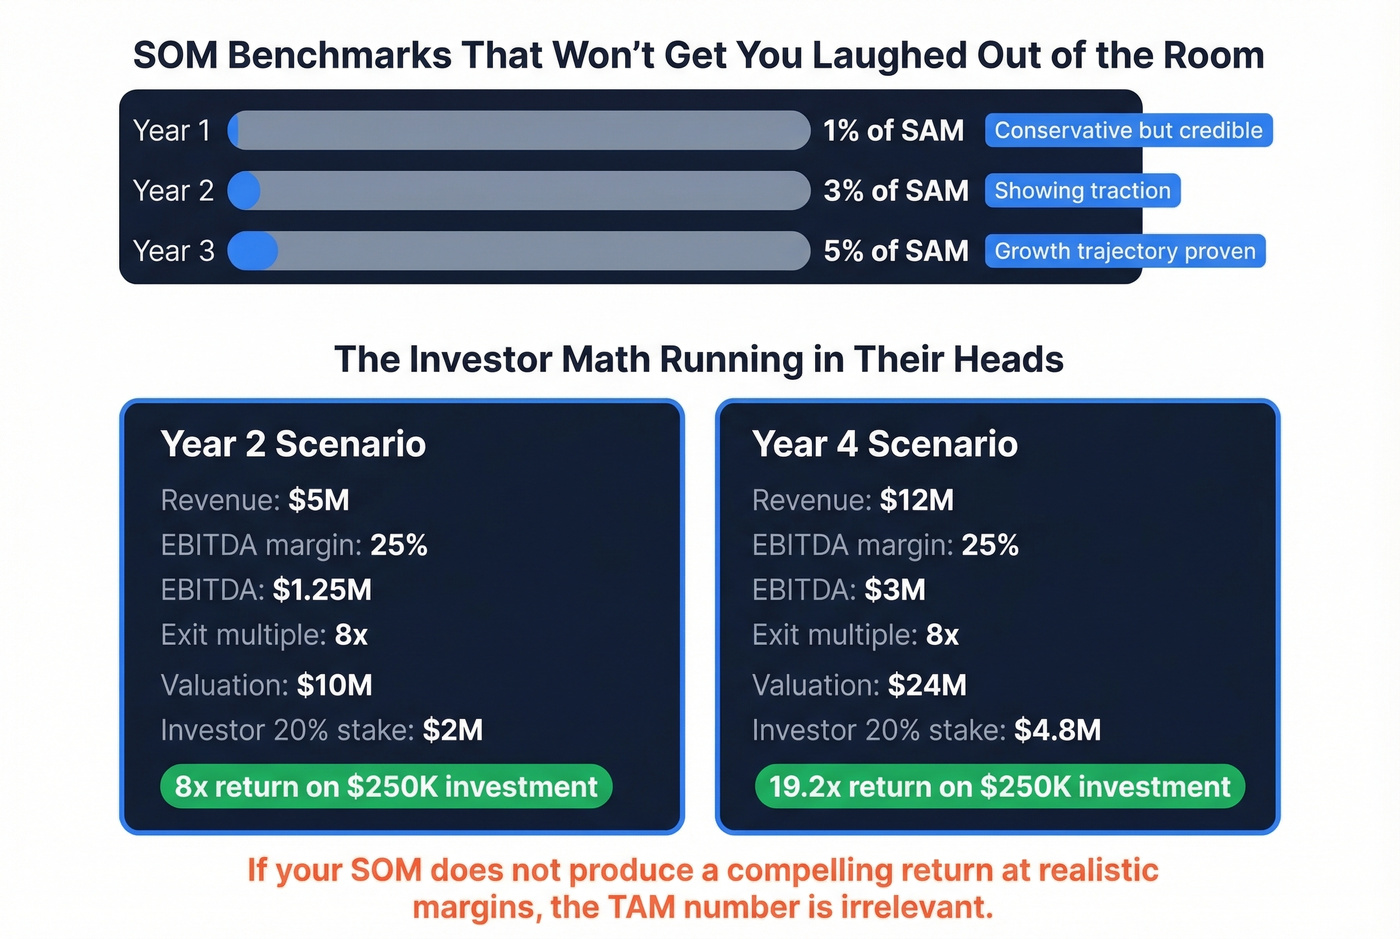
SOM benchmarks that hold up: 1% of SAM in Year 1, 3% in Year 2, 5% in Year 3. These are common investor benchmarks - conservative enough to be credible, ambitious enough to show growth trajectory.
Here's the investor math running in their heads while you present. Take a real scenario from The Business Plan Shop:
- An investor puts in £250K for 20% equity
- Your SAM is £100M, SOM is £5M in Year 2 and £12M in Year 4
- EBITDA margin: 25%, exit valuation: 8x EBITDA
At £5M revenue: EBITDA is £1.25M, valuation is £10M, investor's 20% is worth £2M - an 8x return. At £12M revenue: EBITDA is £3M, valuation is £24M, investor's 20% is worth £4.8M - a 19.2x return.
If your SOM doesn't produce a compelling return at realistic margins, the TAM number is irrelevant. Build SOM from sales capacity: number of reps x average quota x realistic close rate.
Famous Examples (and Lessons)
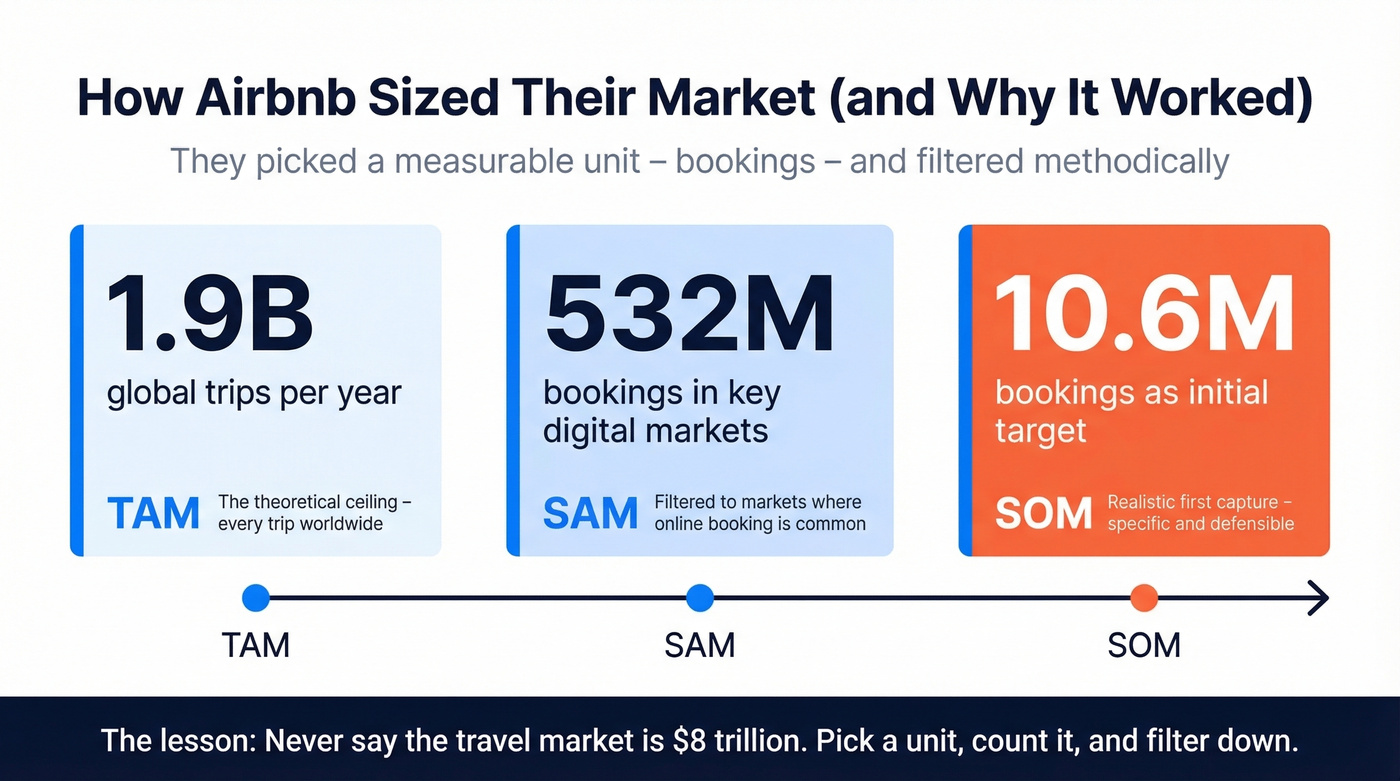
Airbnb broke their market slide down by bookings: TAM of 1.9B global trips/year, SAM of 532M bookings in key digital markets, SOM of 10.6M bookings as their initial target. They didn't say "the travel market is $8 trillion." They picked a measurable unit and filtered methodically.
Uber is the cautionary tale. NYU professor Aswath Damodaran estimated Uber's TAM at $100B based on global taxi and limo revenue. Bill Gurley's famous rebuttal: Damodaran's mistake was assuming Uber only competed for the existing taxi market rather than expanding the overall market for paid rides. By 2022, Uber's gross bookings exceeded $26.4B per quarter. The "taxi market" framing was too narrow by an order of magnitude - a reminder that a product can redefine buyer behavior and blow past any static market estimate.
The beachhead principle. Amazon started with books. PayPal started with 20,000 eBay power sellers. A tiny initial market can still be the right starting point if it's real, provable, and dominatable. Sam Altman's line gets quoted for a reason: "The most interesting companies start with a TAM of nearly zero." Start small, prove it works, then expand.
Here's the thing: if your average deal size is under $15K, you probably don't need a $50B TAM to build a great business. Some of the best outcomes come from founders who picked a small, winnable market and expanded from there. Obsessing over a massive TAM is often a distraction from the harder question - can you dominate your beachhead?
Mistakes That Kill Credibility
"We only need 1% of the market." This is the #1 red flag for investors. It sounds humble but reveals you haven't thought about how you'll win. Capturing 1% of a massive market requires beating entrenched competitors across every segment simultaneously. The fix: define your beachhead, explain your wedge, show the path from SOM to SAM expansion.
Using top-down as your only method. Pulling a number from McKinsey and applying a percentage isn't market sizing. The consequence: investors question every other number in your deck.
Ignoring competition and substitutes. Your TAM isn't the total spend in a category - it's the spend that could realistically shift to your product. If 70% of your target market is locked into 3-year contracts with incumbents, your near-term opportunity is much smaller than the category total.
Treating TAM as static. Markets expand (Uber), contract (print media), and shift (cloud migration). A TAM calculated once and never updated becomes a liability. Revisit quarterly, especially after product launches, pricing changes, or market events.
B2B Market Sizing Playbook
For B2B companies, bottom-up sizing is the gold standard - and it's more accessible than most founders think. The hard part isn't the math. It's getting accurate company counts for your specific ICP.
Define ICP Constraints
List every attribute that defines your ideal customer: geography, industry vertical, employee headcount, revenue range, tech stack requirements, and department structure. "Mid-market SaaS companies in North America" is better than "technology companies." But "Series B+ SaaS companies with 100-1,000 employees running HubSpot in the US and Canada" is better still. The more specific your ICP, the more defensible your bottom-up number.
Count Accounts Bottom-Up
This is where most founders get stuck. The r/startups thread on TAM estimation captures the pain perfectly: a founder building camping hardware can find broad outdoor equipment numbers but can't get customer counts for their specific segment.
The fix is using a B2B database with granular filters. We've used Prospeo's 30+ search filters - industry, headcount, revenue, technographics, funding stage, department headcount - to pull actual company counts matching a given ICP. Run your criteria, get an account count, multiply by your ACV. That's your bottom-up TAM in one workflow.

For example: filter for SaaS companies, 100-500 employees, US-based, running HubSpot. If the database returns 3,800 matching companies and your ACV is $24,000, your TAM is $91.2M. Every input is traceable, which means every number is defensible.
Layer Intent Data for SAM
Raw company counts give you TAM. To get a tighter SAM, layer intent signals on top of your firmographic filters - you're now looking at companies actively researching solutions like yours, not just companies that could buy.
If 3,800 companies match your ICP but only 620 show strong in-market intent for topics tied to your category, your SAM narrows to 620 x $24,000 = $14.9M. That's a much tighter, more actionable number than a percentage carved off a Gartner report, and it answers the question every investor is really asking: how much of this market can you realistically reach right now?
Skip this approach if you're pre-product and don't yet have a clear ICP - intent data is only useful when you know exactly who you're filtering for.
Your SOM is only as real as your ability to reach buyers. Once you've sized your addressable market, Prospeo gives you 98%-accurate emails and 125M+ verified mobiles to actually convert that SOM into pipeline - at $0.01 per email, refreshed every 7 days.
Turn your serviceable obtainable market into booked meetings this quarter.
Your Research Toolkit
You don't need a $50K analyst subscription to build a credible market model. Here's what's actually useful.
| Use case | Best for | Typical cost | Gotcha |
|---|---|---|---|
| US business counts by size | Bottom-up TAM (US) | Free (Census) | Lags 1-2 years |
| Employment by role/industry | Headcount-based sizing | Free (BLS) | No company-level data |
| International business data | Non-US markets | Free (UN Data, ITC) | Inconsistent coverage |
| UK company data | UK-focused sizing | Free (Companies House) | Limited financials |
| Industry deep-dives | Top-down validation | $500-$1,500/report (IBISWorld) | Broad segments only |
| B2B firmographics + intent | Bottom-up + SAM filtering | Free tier available (Prospeo) | B2B focus only |
| Startup/VC data | Funding-stage filtering | $49-$99/mo (Crunchbase) | Skews toward funded cos |
| Digital traffic/behavior | Market share estimates | ~$125/mo (SimilarWeb) | Web-only signal |
| Broad market stats | Quick benchmarks | ~$79/mo (Statista) | Surface-level data |
| Market modeling platform | Structured TAM models | From $79/mo (Olympus Intel) | Newer platform |
| Enterprise analyst reports | Board-level validation | $10K-$50K+/yr (Gartner/IDC) | Expensive, broad |
| VC/PE deal data | Comp analysis, M&A sizing | $20K-$50K/yr (PitchBook) | Enterprise pricing |
| Startup intelligence | Trend analysis, funding | $30K-$80K/yr (CB Insights) | Pricey for startups |
| Trade associations (NRF, etc.) | Segment-specific data | Varies; often free reports | Narrow scope |
One warning: watch out for "research farms" that push low-value reports via press releases. If a market report shows up from a company you've never heard of, with suspiciously round numbers and no methodology section, skip it.
Pitch Deck: The 60-Second Market Slide
Your market slide gets a few seconds of attention. Make those seconds count.
The structure that works:
- One line for TAM - the ceiling, with a named source and year
- One line for SAM - your reachable segment, with the filters you applied
- One line for SOM - your Year 1-3 target, tied to sales capacity
- Assumptions footnote - two to three bullets explaining your key inputs
No paragraphs. No "the global market for X is projected to reach Y by Z." Just numbers, sources, and logic.
Decks with 30%+ data slides get 3x longer investor engagement, so show your filtering logic visually as a funnel or nested circles. Don't lead with a trillion-dollar number. Don't use "1% of the market" language. And don't cite a single analyst report as your entire methodology.
Investors aren't grading your TAM on size. They're grading it on logic. A $200M TAM with airtight bottom-up math beats a $50B TAM pulled from a press release every single time.
FAQ
What's the Difference Between TAM, SAM, and SOM?
TAM is the total revenue opportunity if you captured every possible customer. SAM narrows that to the segment you can reach with your current product, pricing, and distribution. SOM is the realistic share you'll capture in one to three years based on sales capacity. Investors evaluate all three, but SOM drives their return math.
What's a Good SOM Target for Year 1?
Around 1% of your SAM, scaling to 3% by Year 2 and 5% by Year 3. If your SOM exceeds 5-10% of SAM in Year 1, investors will question whether your SAM is too narrow or your projections are unrealistic.
How Often Should You Update Your Market Analysis?
Quarterly is the right cadence for most B2B companies. Markets shift - new competitors enter, regulations change, adjacent segments open up, and your own product evolves. A TAM calculated during your seed round shouldn't still be on your Series B deck without revision.
What Tools Help With Bottom-Up B2B Sizing?
For firmographic counts, tools like Prospeo let you filter by industry, headcount, revenue, tech stack, and intent signals to get actual company counts matching your ICP - starting on a free tier. For macro data, the US Census Bureau and BLS provide free business and employment counts. Enterprise teams often layer in PitchBook or Gartner for board-level validation.