ARR Waterfall: How to Build, Read & Present One (2026)
It's board week. Your CFO pulls up the quarterly deck and asks why net new ARR dropped 15% from last quarter. You scramble through three spreadsheets, a Salesforce report, and a billing export - and none of them agree. The ARR waterfall should've caught this weeks ago. If you'd built one properly, it would have.
The Short Version
An ARR waterfall bridges Beginning ARR to Ending ARR through six lines: the opening balance, five movement types (new, expansion, contraction, churn, reactivation), and the closing balance. Express each movement as a percentage of opening ARR - that's how you spot trends across quarters, not just absolute dollar swings. Healthy benchmarks: NRR at or above 104% (median), GRR at or above 90%. And document your definitions before you build the model. If Sales and Finance define "new ARR" differently, the waterfall is fiction.
What Is an ARR Waterfall?
An ARR waterfall is a bridge from one period's recurring revenue to the next, showing the operational movements in between. It's not a GAAP revenue schedule. It's not a bookings report. It's a management metric that tells you why your recurring revenue changed - and where to dig when something looks off.
The underlying formula is straightforward: ARR = MRR x 12, or contract value divided by contract length in years. A $200 contract over two years produces $100 ARR. That same $200 over six months produces $400 ARR. The annualization matters because it normalizes everything to a comparable time horizon, which is the whole point of the bridge.
ARR Waterfall vs. ARR Bridge vs. Revenue Waterfall
| Name | What It Shows | Governed By | Typical Audience |
|---|---|---|---|
| ARR Waterfall | Operational movements | Internal policy | FP&A, RevOps |
| ARR Bridge Chart | Visual of same data | Same as waterfall | Board, investors |
| Revenue Waterfall | Bookings to recognized rev | ASC 606 / GAAP | Accounting, audit |
These three terms get used interchangeably. They shouldn't be. The waterfall is the analytical model. The bridge is the bar chart you put in the board deck. The revenue waterfall is an entirely different animal - it tracks how booked contract value becomes recognized revenue over time under accounting rules. We've seen RevOps teams waste entire quarters arguing about numbers simply because one group was looking at the management waterfall while accounting was referencing the GAAP revenue waterfall. Conflating them is one of the most common mistakes in SaaS finance.
The 5 Movement Types
Most SaaS teams start with four movement types: new, expansion, contraction/downgrade, and churn. More complete waterfalls track reactivation separately.
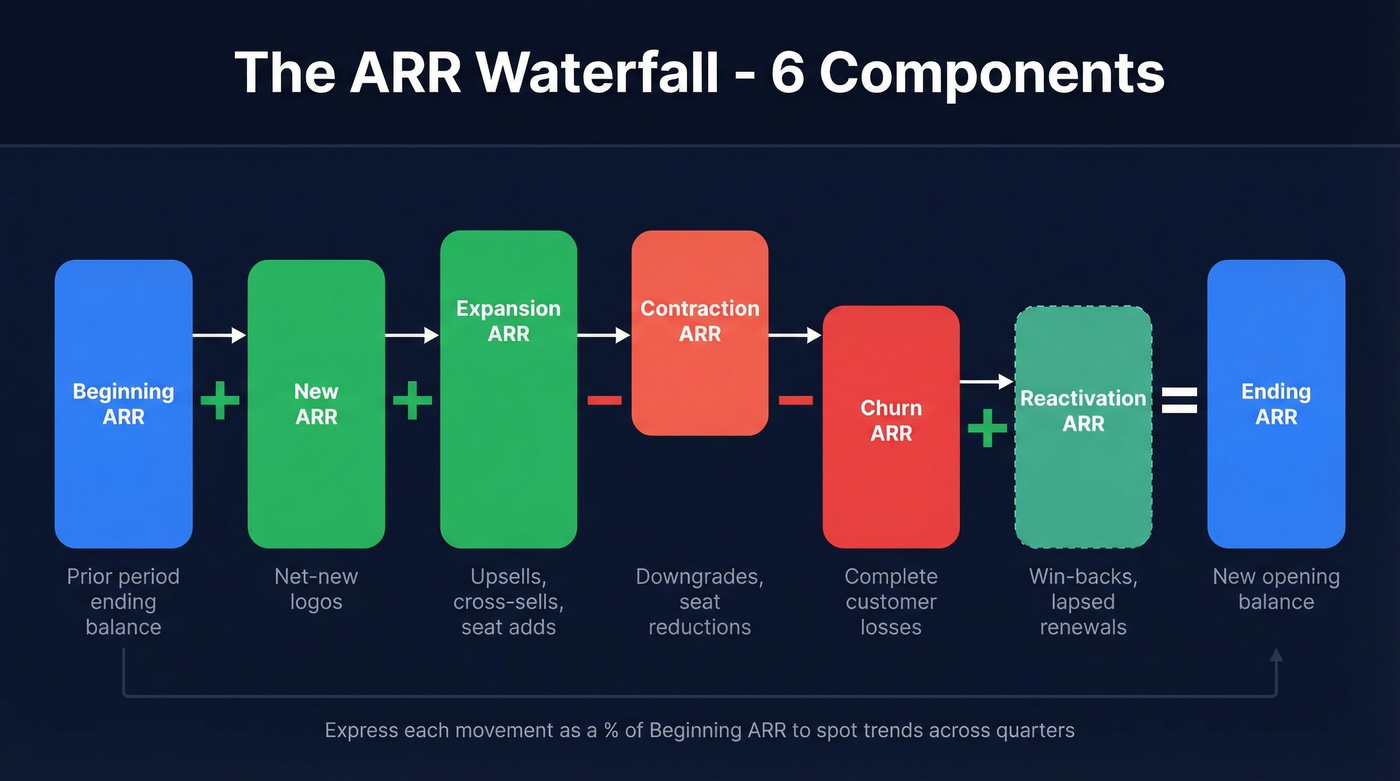
Beginning ARR
Your opening balance. This equals the prior period's Ending ARR. If it doesn't, you've got a reconciliation problem - stop everything and fix it before you build anything else.
New ARR
Revenue from net-new logos. This is the line everyone celebrates, but it's also the one most vulnerable to upstream data quality problems. If your SDRs are working bounced emails and dead numbers, new bookings suffer before the waterfall ever sees the impact. Tools like Prospeo - 98% email accuracy, 7-day data refresh - fix the input problem so pipeline actually converts.
Expansion ARR
Upsells, cross-sells, seat additions, and price increases from existing customers. Some teams split price increases into their own line. Do this if you're running annual price escalators, because organic expansion and contractual escalators tell very different stories about customer health.
Contraction ARR
Downgrades and seat reductions from customers who stay but spend less. This is the quiet killer. It hides inside a "healthy" NRR number and erodes your base while everyone's focused on new logos.
Churn ARR
Complete customer losses. The most visible and most painful movement type.
Reactivation ARR
Win-backs and lapsed renewals - the movement type many guides skip entirely. Once your install base is large enough, reactivations become a meaningful and trackable revenue source. Treating them as "new" distorts your acquisition metrics. For the clearest picture, track movements at the customer-product level rather than just the account level. A customer who churns one product but keeps another shouldn't show up as full churn.
Your New ARR line is only as strong as the pipeline feeding it. Bad contact data means bounced emails, dead dials, and bookings that never materialize in your waterfall. Prospeo delivers 98% verified emails and 125M+ direct dials - refreshed every 7 days - so your pipeline actually converts into the new-logo ARR your board expects.
Stop debugging your waterfall. Start fixing the data upstream.
Worked Example
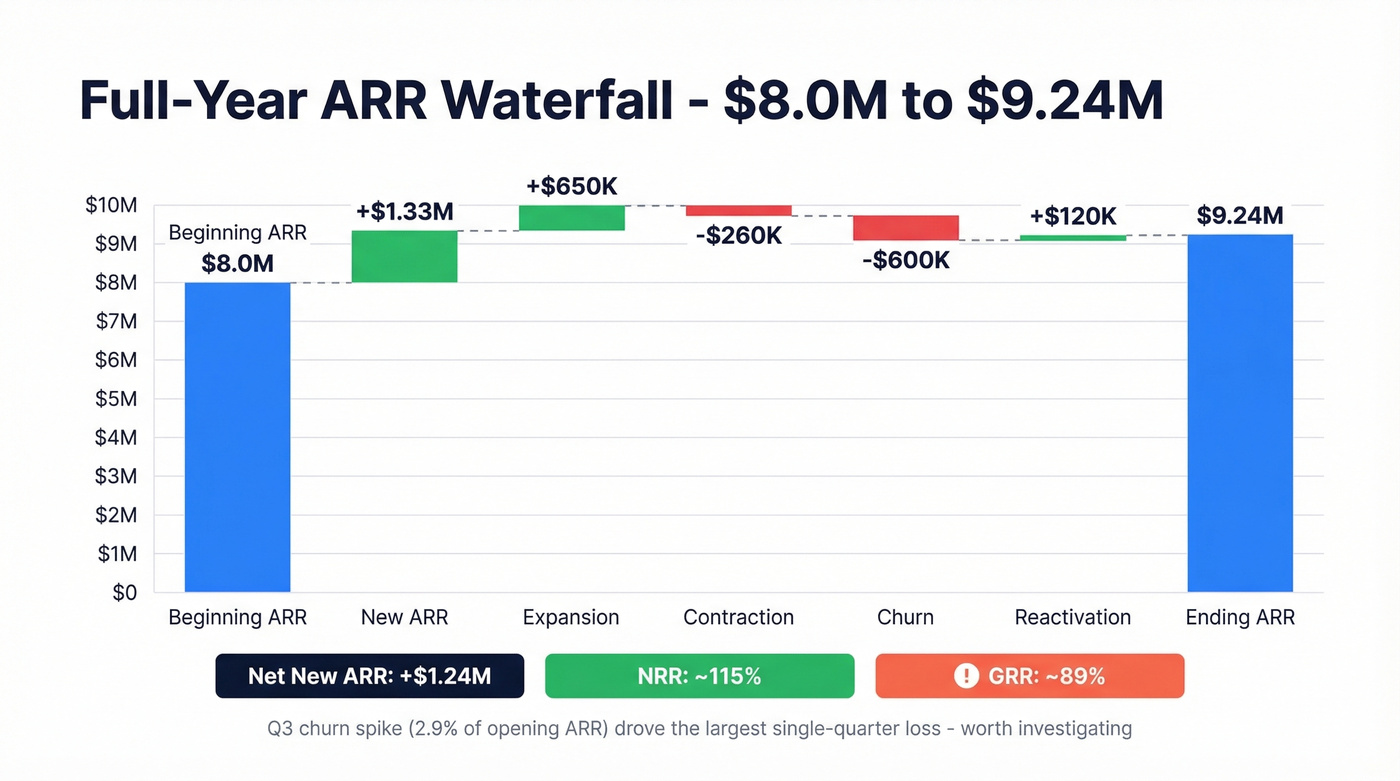
Here's a full-year waterfall for a company starting at $8M ARR.
| Movement | Q1 | Q2 | Q3 | Q4 |
|---|---|---|---|---|
| Beginning ARR | $8.0M | $8.3M | $8.7M | $8.8M |
| + New ARR | $300K | $350K | $280K | $400K |
| + Expansion | $150K | $180K | $120K | $200K |
| - Contraction | -$50K | -$60K | -$80K | -$70K |
| - Churn | -$120K | -$100K | -$250K | -$130K |
| + Reactivation | $20K | $30K | $30K | $40K |
| Ending ARR | $8.3M | $8.7M | $8.8M | $9.24M |
Now express each movement as a percentage of Beginning ARR. New ARR ran 3.2-4.6% of opening balance across quarters - consistent. But churn spiked to 2.9% in Q3 versus roughly 1.2-1.5% in other quarters. That's an immediate investigation: was it a pricing change, a product issue, or a single large logo churning?
The waterfall makes the question obvious. Without it, Q3's ending ARR of $8.8M looks fine - you'd miss the underlying deterioration entirely.
NRR and GRR Benchmarks
Use these as your calibration points.
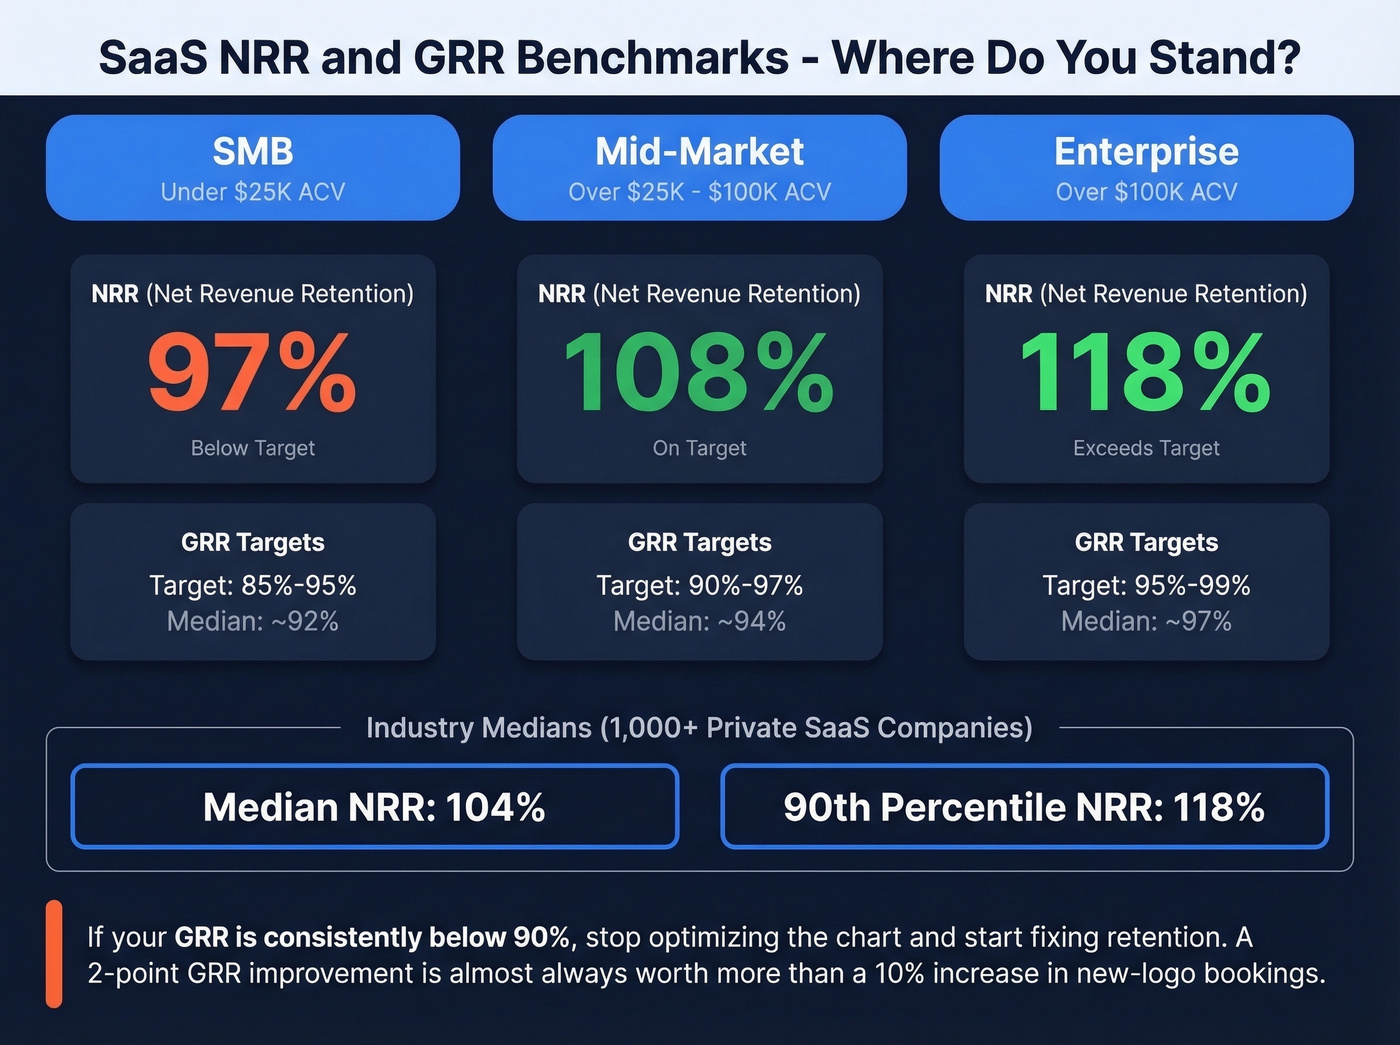
| Metric | SMB (<$25K ACV) | Mid-Market | Enterprise (>$100K) |
|---|---|---|---|
| Median NRR | 97% | 108% | 118% |
Across 1,000+ private SaaS companies, median NRR sits at 104%. The 90th percentile hits 118%. For GRR, the high 80s to roughly 90% range correlates with stronger valuations. If your waterfall shows GRR consistently below 90%, stop optimizing the chart and start fixing retention.
Let's be honest: most SaaS teams obsess over New ARR because it's the exciting number. But a 2-point improvement in GRR is almost always worth more than a 10% increase in new-logo bookings - and it's cheaper to achieve. The waterfall makes this math painfully clear.
When Things Get Messy
Usage-Based Pricing
There's no clean "booking amount" to annualize when revenue fluctuates with consumption. The cleanest approach: take GAAP-recognized usage revenue from the most recent quarter and multiply by four. For seasonal businesses, use TTM instead. Ordway Labs recommends segmenting customers by predictability - enterprise accounts with committed minimums go into ARR, while pure pay-as-you-go accounts get tracked separately until they stabilize.
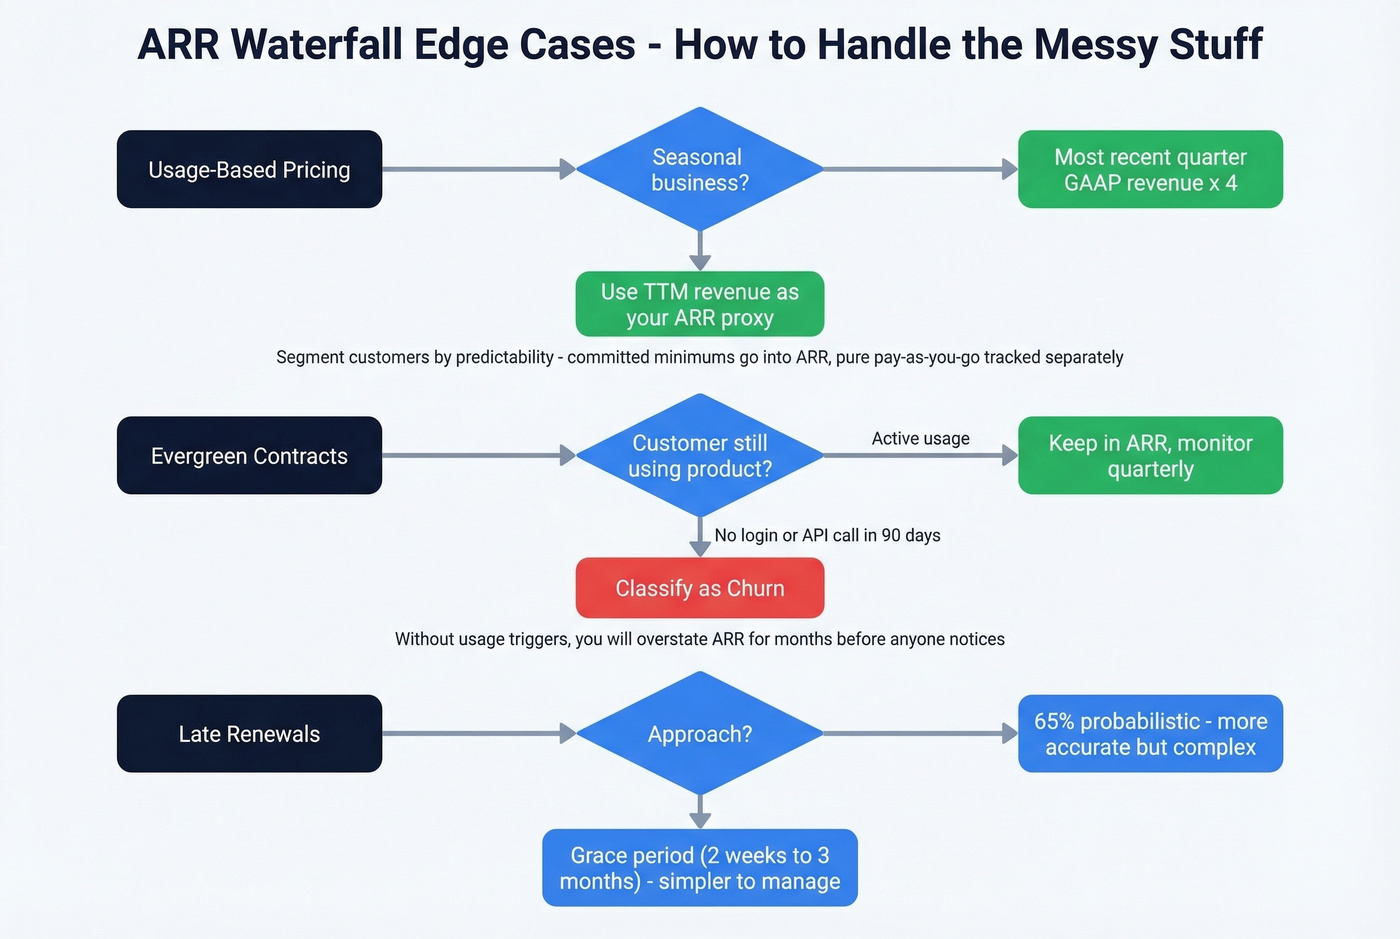
Evergreen Contracts
Terminate-anytime contracts camouflage churn and blur the line between contraction and full loss. There's no renewal event to trigger a classification decision. We've seen teams carry "active" ARR for accounts that stopped using the product months ago simply because nobody cancelled. If you run evergreen terms, build a usage-based trigger into your churn definition - something like "no login or API call in 90 days equals churn" - or you'll overstate ARR for quarters before anyone notices.
Policy Decisions That'll Make or Break Your Model
These are judgment calls. Document them, get leadership alignment, and apply them consistently.
| Scenario | Options |
|---|---|
| Late Renewals | Grace period (2wk-3mo) or 65% probabilistic |
| Win-Backs | New logo vs. reactivation; 3-12mo window |
| Free Periods | Count from contract start vs. exclude during free period |
| FX Conversion | Constant currency, current-rate, or dual reporting |
| Committed vs. Live ARR | Separate tracks for signed-but-not-live customers |
The governance sequence: define terms, align with leadership, baseline measurement, maintain a trend line. Skip any step and you'll spend board meetings debating definitions instead of discussing strategy. On r/FPandA, a COO at a roughly $10M ARR startup described their Excel model as "too cumbersome to update and easily breakable" - that's the breaking point where most teams realize they need a proper system. Create a formal written ARR policy, get board sign-off, and disclose your methodology in a footnote or appendix.
Presenting to Your Board
Your board deck should be 15-20 slides, not 40. For the ARR section, show 5-7 health metrics: ARR/MRR, NRR, net new ARR by month, CAC/payback, and burn/runway.
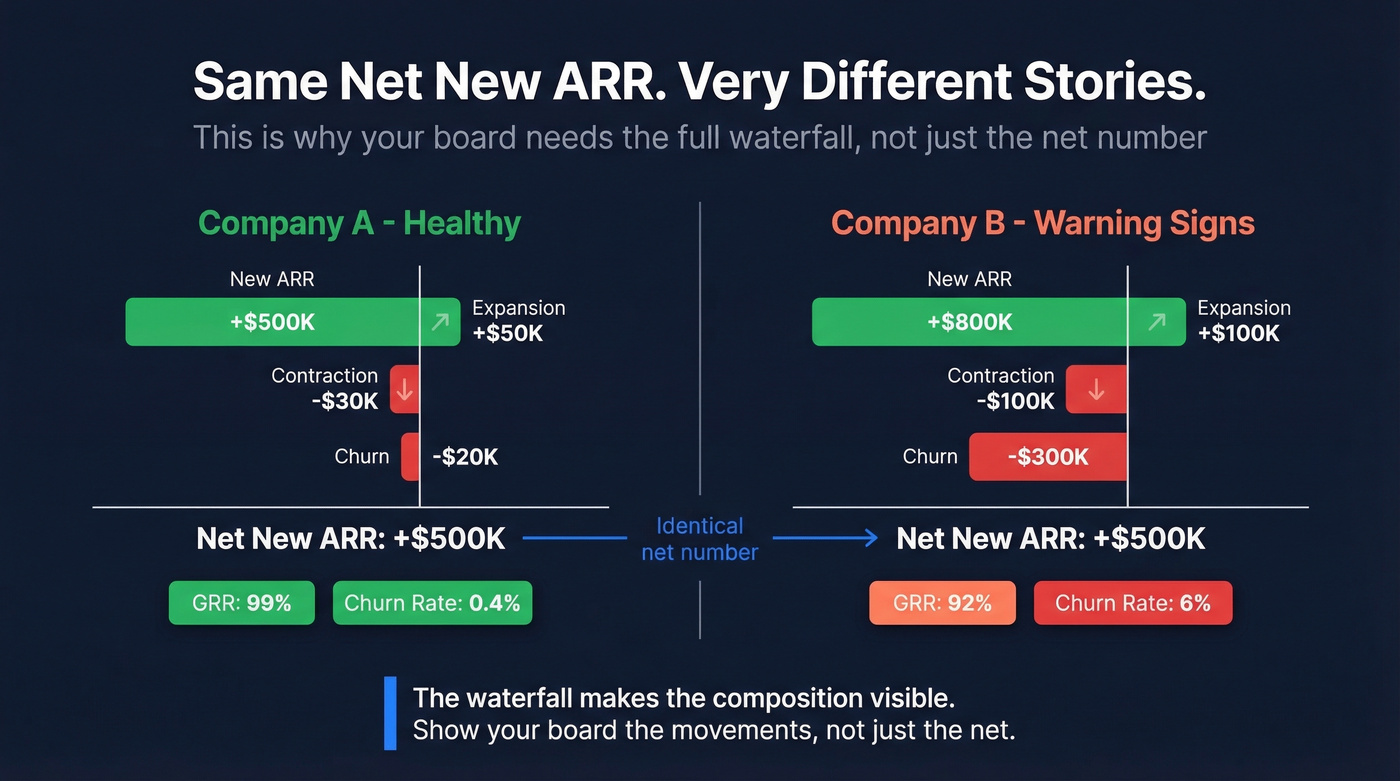
Here's the thing most decks get wrong: two companies can show identical net new ARR and have completely different health profiles. Company A added $500K from new logos with zero churn. Company B added $800K from new logos but lost $300K to churn. Same net number, very different stories. The waterfall makes the composition visible - and that's exactly why investors ask for it.
For forecasting, model each movement as a percentage of opening ARR, use a rolling six-month average for projections, and divide projected ARR additions by 12 to translate into monthly revenue impact. This gives your board a forward-looking model, not just a rearview mirror.
Common Mistakes
Blending data sources without reconciliation. CRM, billing, and spreadsheets will never match on their own. Pick a system of record and reconcile everything else against it.
Conflating bookings with ARR. A $120K three-year deal isn't $120K ARR. It's $40K. We've seen this mistake survive multiple board decks before someone catches it.
Using only four movement categories. Lumping reactivations into "new" inflates your new-logo metrics and makes acquisition look healthier than it is. Once you're past $5M ARR, reactivations deserve their own line.
Ignoring GAAP divergence. A discounted implementation fee allocated 50/50 between services and subscription can reduce your GAAP subscription revenue while management ARR stays flat. Know the gap and be ready to explain it.
No documented definitions across teams. If Sales counts a deal as "new ARR" on signature and Finance counts it on go-live, your waterfall is fiction from day one. Skip this one if you enjoy spending board meetings arguing about whose spreadsheet is right.
Reactivation ARR only works if you can actually reach churned accounts again. Prospeo's 7-day data refresh means you're never emailing outdated contacts - even for buyers who changed roles since they left. With 300M+ profiles and 30+ filters, you can rebuild win-back lists in minutes, not hours.
Turn your reactivation line from a rounding error into real revenue.
FAQ
What's the difference between ARR and MRR?
ARR is MRR x 12 - it normalizes monthly recurring revenue to an annual figure. Use MRR for monthly operational tracking and ARR for board reporting and annual planning. They measure the same underlying metric at different time scales.
How often should you update your ARR waterfall?
Monthly is standard for operational teams; quarterly is the minimum for board reporting. In our experience, teams that move from quarterly to monthly cadence catch retention problems a full quarter earlier - before they compound into a board-level crisis.
How do you handle multi-currency ARR?
Report in constant currency for trend analysis and add a current-rate reconciliation line for the finance team. Constant currency removes FX noise from operational metrics, while current-rate reflects economic reality. Pick one primary method and stick with it across every period.
Can better contact data improve the New ARR line?
Absolutely. Bad contact data kills pipeline before it reaches your waterfall - bounced emails and wrong numbers mean fewer meetings and fewer closed deals. Prospeo's 98% email accuracy and 7-day refresh cycle keep outbound lists clean, which directly impacts new-logo conversion rates and the New ARR movement in your model.