Average CTR for Email Marketing: Why Every Source Gives You a Different Number
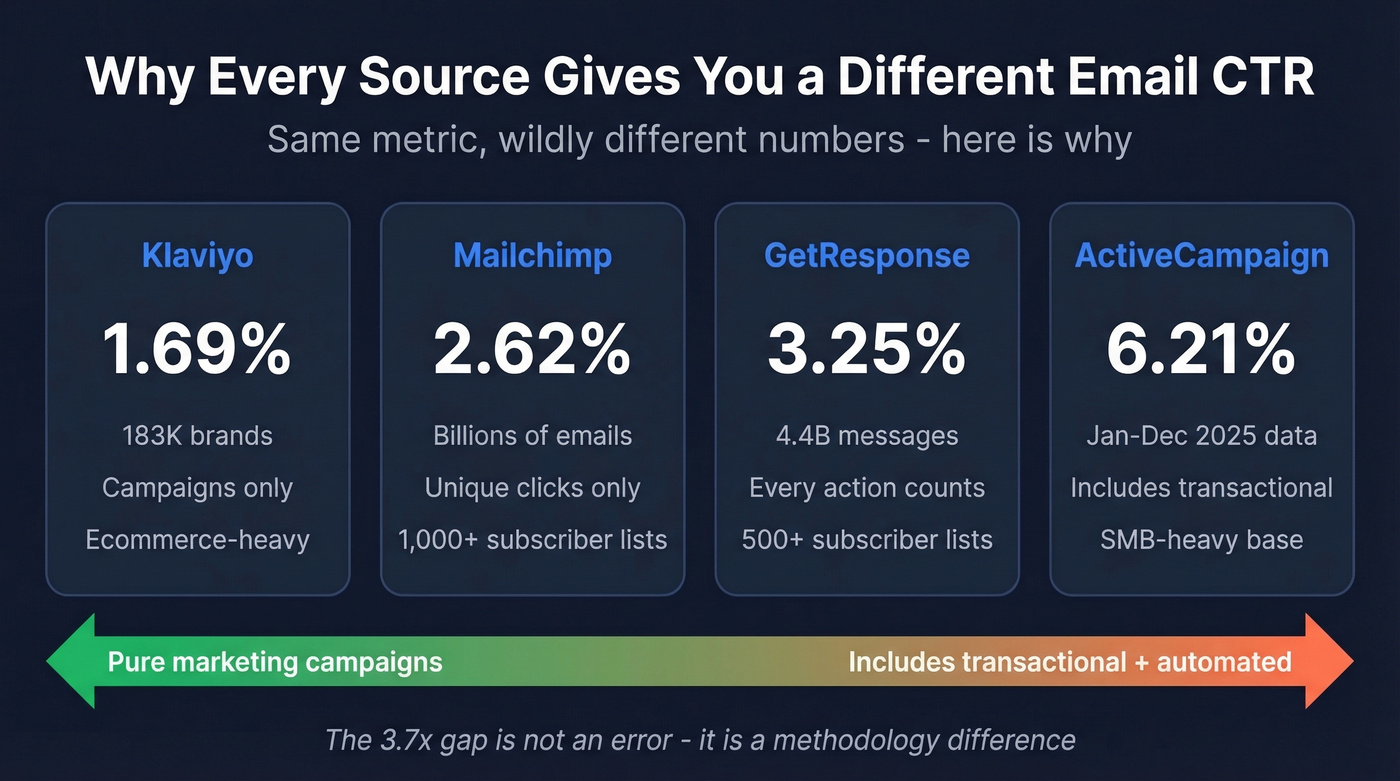
Your CMO just asked for the average CTR for email marketing. You looked it up. Klaviyo says 1.69%. ActiveCampaign says 6.21%. That's not a rounding error - it's a 3.7x gap between two reputable platforms reporting on the same metric. The numbers aren't wrong. They're just measuring different things, and until you understand why, every benchmark you read will steer you in the wrong direction.
2026 Email CTR Benchmarks
Three numbers actually matter. Marketing campaign CTR averages 1.69%-3.25% depending on which ESP you trust. Automated flows and triggered emails hit 5%-5.58%. Welcome emails crush everything at 16.6%.
The reason every source disagrees comes down to methodology - what email types they include, how they count clicks, and which customers make up their dataset.
| Source | Avg CTR | Dataset | Key Note |
|---|---|---|---|
| Klaviyo | 1.69% | 183K brands | Campaigns only |
| Mailchimp | 2.62% | Billions of emails | Unique clicks, campaigns sent to 1,000+ subscribers |
| GetResponse | 3.25% | 4.4B messages | Every subscriber action counts |
| ActiveCampaign | 6.21% | Jan-Dec 2025 data | Includes transactional |
None of these are wrong. Klaviyo's 1.69% reflects pure marketing campaigns sent by ecommerce brands. ActiveCampaign's 6.21% includes transactional emails, marketing emails, and everything in between - sent across their entire SMB-heavy customer base. The benchmark you choose as your reference point depends entirely on what you're sending.
CTR vs. CTOR - Get the Definitions Right
Two formulas, and most marketers mix them up:
CTR = (unique clicks / emails delivered) x 100
CTOR = (unique clicks / opened emails) x 100
CTR tells you how your entire campaign performed, including subject line effectiveness and deliverability. CTOR isolates content quality by only measuring people who actually opened. Mailchimp makes this worse by using "click rate" and "click-through rate" interchangeably on different pages - exactly the kind of inconsistency that makes benchmarking a headache.
Knowing which formula your ESP actually uses is step one.
Why Every Source Disagrees
Five factors explain the gap between 1.69% and 6.21%.
Email type mix. ActiveCampaign's 6.21% includes transactional emails - order confirmations, password resets - alongside marketing campaigns. Transactional emails get clicked at much higher rates because people are expecting them. Klaviyo's 1.69% is campaigns only.
Campaigns vs. flows. Klaviyo reports campaigns at 1.69% and automated flows at 5.58%. That's a 3.3x difference. Any benchmark that blends these together will skew high.
Unique vs. total clicks. GetResponse's methodology notes that "every subscriber action counts - whether they reopened your emails or clicked on all your links." That approach pushes click rates higher than benchmarks based strictly on unique clicks.
Minimum list size thresholds. Mailchimp only includes campaigns sent to 1,000+ subscribers. GetResponse's threshold is 500+. Smaller lists tend to have higher engagement, so a lower threshold pulls averages up.
Dataset composition. Klaviyo skews ecommerce. ActiveCampaign skews SMB. Mailchimp spans everything from newsletters to nonprofits. In our experience, the single biggest reason teams misread their own performance is comparing against a benchmark built from a completely different sender profile.
CTR by Email Type
Comparing your newsletter CTR against a welcome email benchmark is like comparing a cold call connect rate to an inbound demo show rate - fundamentally different motions.
| Email Type | Avg CTR | Source |
|---|---|---|
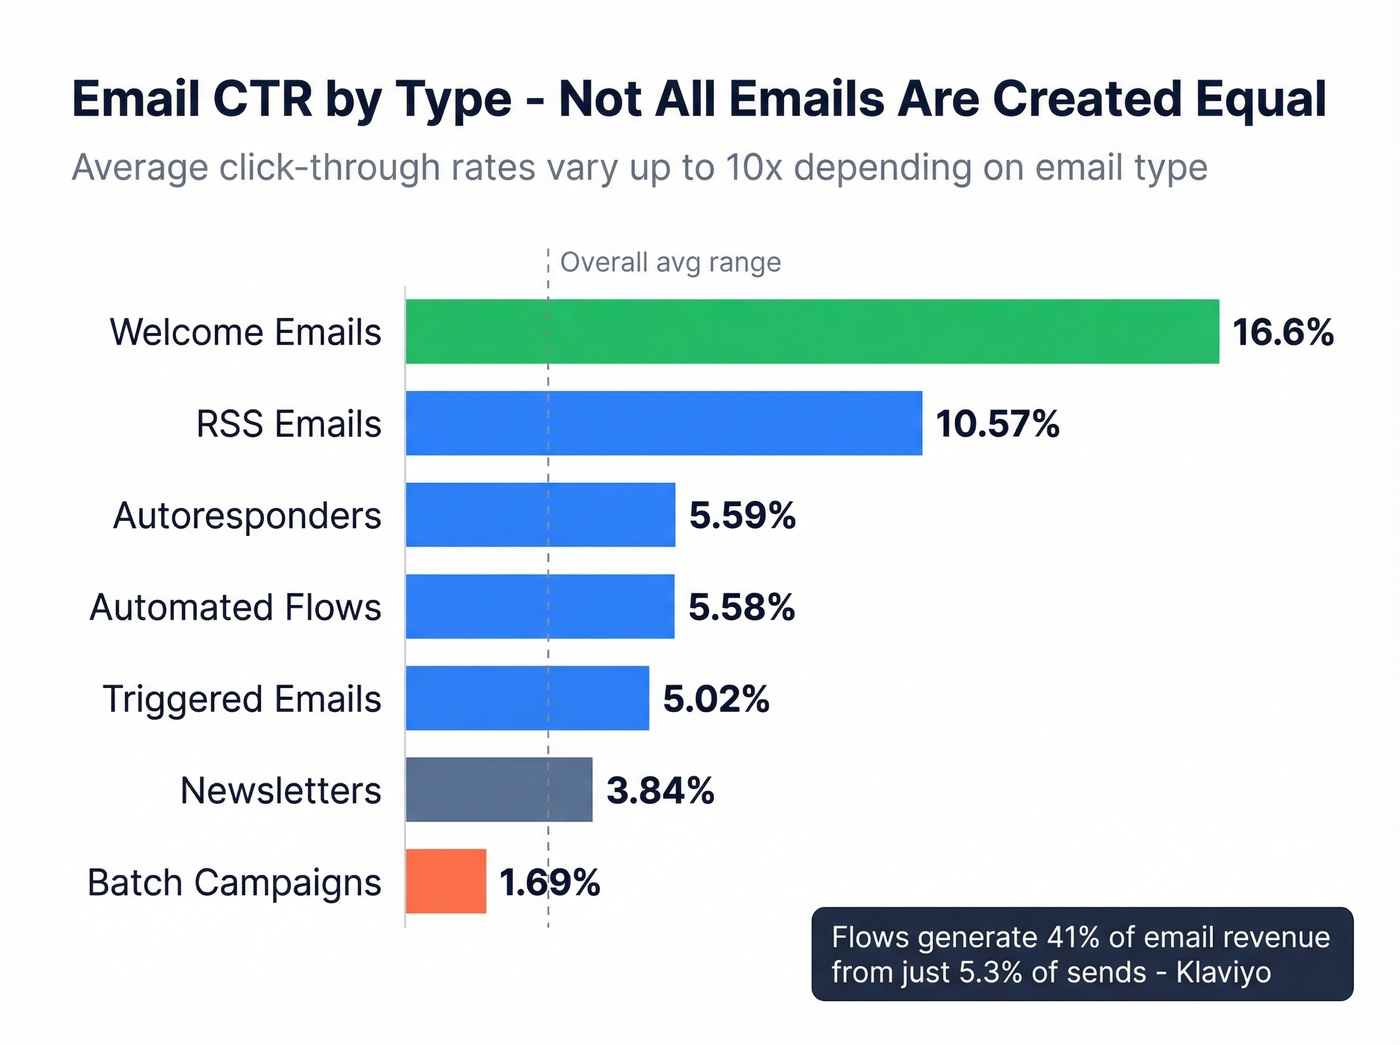
| Welcome | 16.6% | GetResponse |
| RSS | 10.57% | GetResponse |
| Autoresponder | 5.59% | GetResponse |
| Automated Flows | 5.58% | Klaviyo |
| Triggered | 5.02% | GetResponse |
| Newsletter | 3.84% | GetResponse |
| Campaigns | 1.69% | Klaviyo |
The takeaway is stark. Klaviyo's own data shows that flows generate roughly 41% of total email revenue from just 5.3% of sends. If you're only sending batch campaigns and wondering why your click-through rate is low, the answer isn't better subject lines - it's building automated sequences that fire based on behavior.
Your CTR benchmark is meaningless if half your emails bounce. Prospeo delivers 98% verified email accuracy with a 7-day refresh cycle - so every send reaches a real inbox. Teams using Prospeo cut bounce rates from 35%+ to under 4%.
Stop optimizing CTR on emails that never land. Start with better data.
Email CTR by Industry and Geography
Industry benchmarks are the most misleading numbers in email marketing, because the methodology gap between sources is enormous.
| Industry | Mailchimp CTR | ActiveCampaign CTR |
|---|---|---|
| Nonprofits | 3.27% | - |
| Education | 3.02% | - |
| Business/Finance | 2.78% | 4.40% |
| Blogger/Author | - | 7.73% |
| Software | - | 6.67% |
| Media/Publishing | - | 7.32% |
| Ecommerce | 1.74% | 5.07% |
Ecommerce shows the gap most clearly: 1.74% on Mailchimp vs. 5.07% on ActiveCampaign. That's not because ActiveCampaign users are better marketers. It's because ActiveCampaign includes transactional emails and Mailchimp's data was last updated in December 2023.
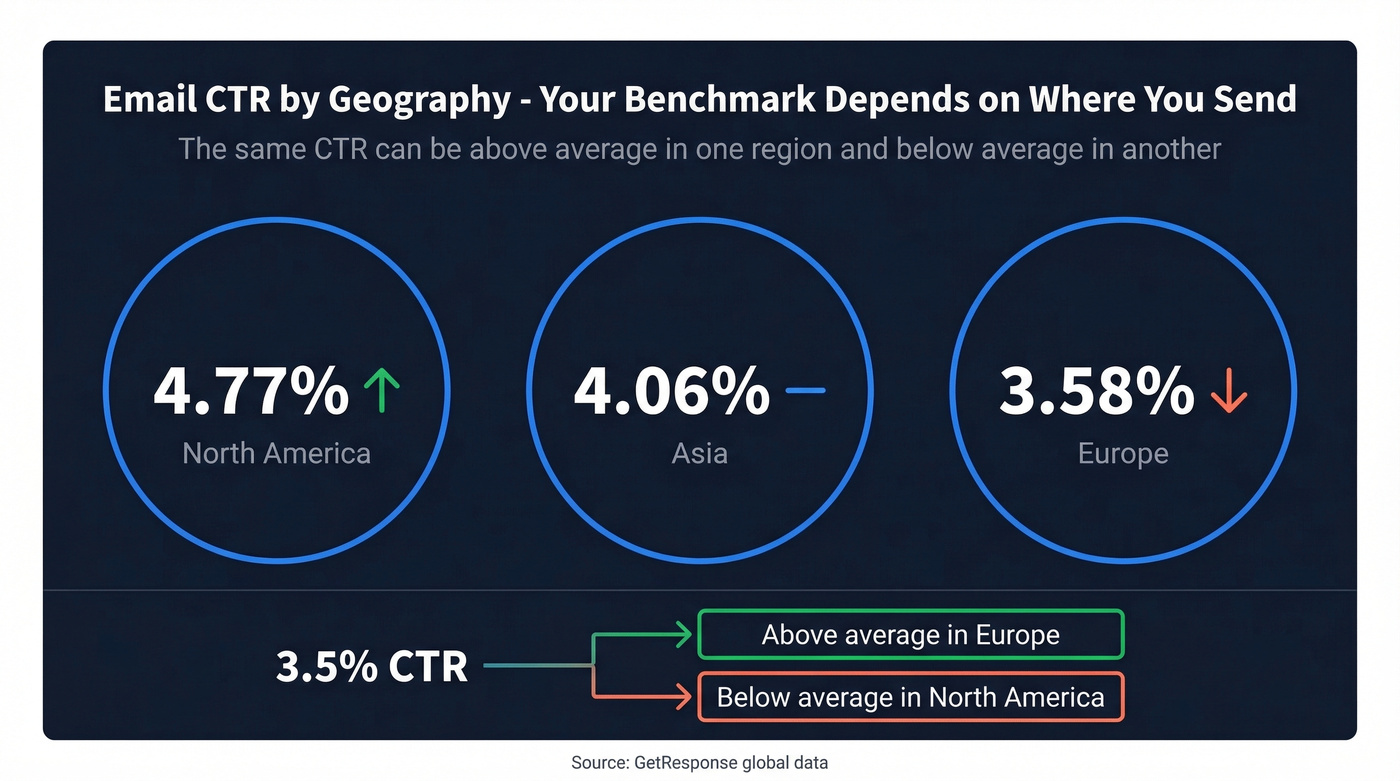
Geography matters too. GetResponse's data reveals significant continental variation that nobody talks about: North America averages 4.77% CTR, Europe 3.58%, and Asia 4.06%. If you're running global campaigns and benchmarking against a single number, you're missing the picture entirely. A 3.5% CTR in Europe is above average; the same number in North America is below.
For B2B specifically, opted-in newsletter CTR typically runs 2-4%. Top-quartile B2B senders hit 10%+ CTR through triggered sequences and intent-based segmentation. If you're below 2% on B2B marketing campaigns, the problem is almost certainly list quality, relevance, or CTA clarity.
Why CTR Matters More Than Open Rate
Here's the thing: open rates are increasingly fictional. Apple Mail Privacy Protection accounts for roughly 49.29% of email opens (Jan 2025), inflating open rates by 15-20+ points. Only 15% of email marketers still treat opens as a primary metric. One common misconception: 77% of marketers believe MPP activates automatically, but users must opt in - meaning the actual inflation is concentrated among Apple Mail's most engaged users.
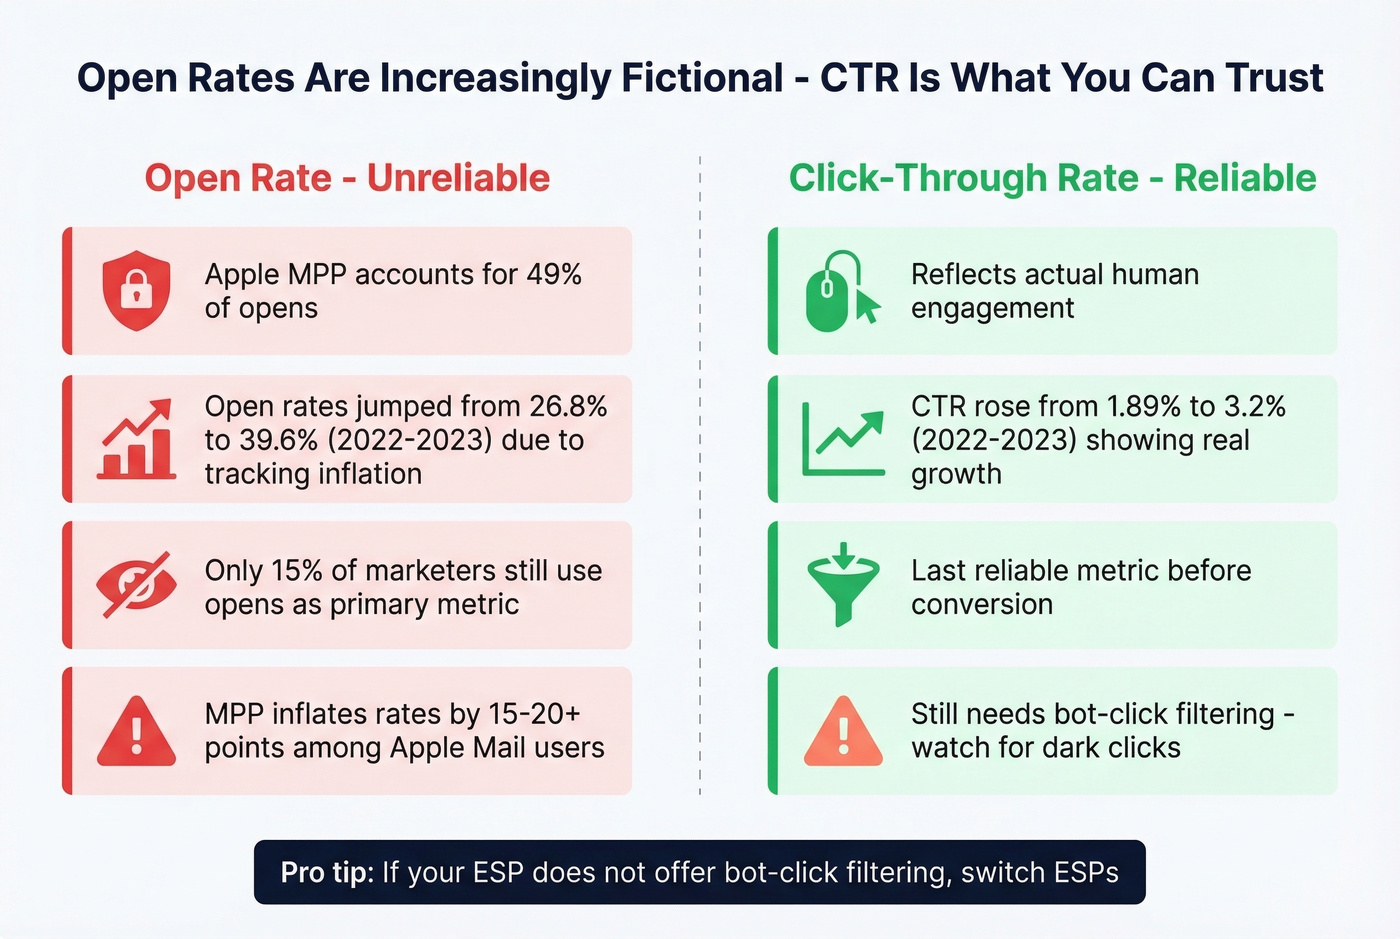
The GetResponse year-over-year data makes this visible. From 2022 to 2023, open rates jumped from 26.8% to 39.64% - a jump heavily influenced by MPP-driven tracking inflation. CTR rose from 1.89% to 3.2% over the same window, reflecting actual engagement growth. That's the metric worth watching.
It gets worse. Apple's Link Tracking Protection now strips UTM parameters from links in Mail and Safari, complicating attribution. Security scanners from major inbox providers pre-click links before humans ever see the email - "dark clicks" that peaked at 3+ million per day in early 2025. If your CTR suddenly spikes without a corresponding conversion increase, bot clicks are the likely culprit.
Let's be honest: most teams are still optimizing for open rates in 2026. Stop. CTR is the last reliable engagement metric before conversion, and even it requires bot-click filtering to trust. If your ESP doesn't offer bot-click filtering, switch ESPs.
How to Improve Your Email Click-Through Rate
Knowing the benchmarks is table stakes. Moving your number is what matters.
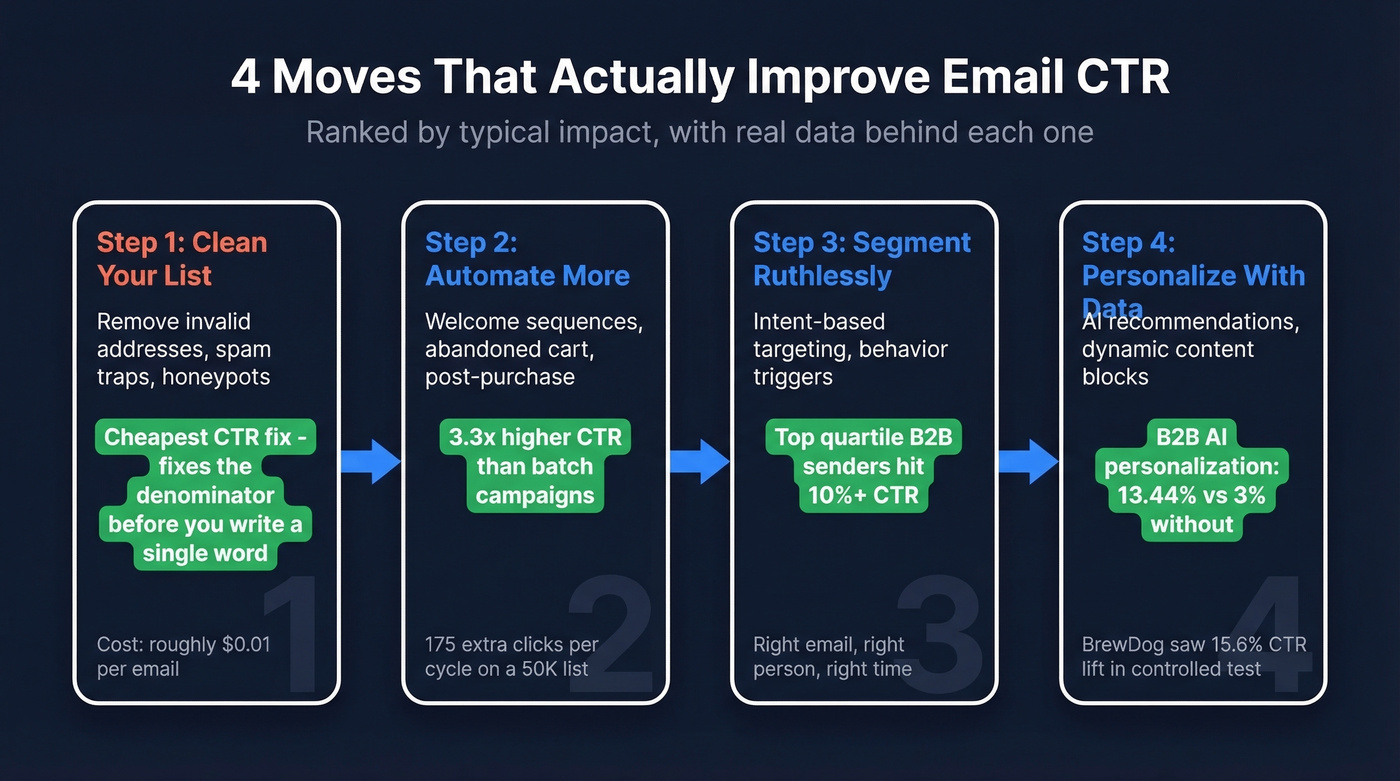
Automate more, batch less. Flows deliver 3.3x the CTR of campaigns. Welcome sequences, abandoned cart emails, post-purchase follow-ups - these aren't optional anymore. They're where the clicks live. To put a number on it: if you have a 50K list averaging 2% campaign CTR and you shift 10% of volume to automated flows at 5.5% CTR, that's roughly 175 additional clicks per send cycle, compounding every week.
Personalize with data, not just first names. BrewDog saw a 15.6% CTR lift from personalization in a controlled test, with an 11.5% conversion rate increase. Klaviyo users running AI product recommendations average 3.75% CTR, with top performers hitting 8.79%. B2B campaigns using AI personalization average 13.44% CTR vs. 3% without it - a gap too large to ignore.
Segment ruthlessly. B2B top-quartile senders hit 10%+ CTR not because they write better copy, but because they send the right email to the right person at the right time. Intent-based segmentation and triggered sequences do the heavy lifting.
Clean your list. Bad data inflates bounces, reduces your delivered count, distorts CTR, and tanks sender reputation. Every bounced email is a denominator problem and a deliverability problem rolled into one. Running your list through a verification service before every major send is the cheapest CTR improvement you can make - it fixes the math before you even write a subject line. Prospeo's 5-step verification catches invalid addresses, spam traps, and honeypots at ~$0.01/email with 98% accuracy, but whatever tool you use, just do it.
One practitioner on r/Emailmarketing reported 3.9% CTR on a 60K list with ~28% open rate - solid numbers achieved through systematic testing of bonus editions, alternative signup paths, and drip sequence tweaks. B2B marketers on Reddit are also reporting softer engagement in 2026, with one event marketer noting fewer clicks despite stable send volumes. That makes list quality and segmentation even more critical than they were a year ago.
Top-quartile B2B senders hit 10%+ CTR through intent-based segmentation. Prospeo tracks 15,000 buyer intent topics so you can target prospects actively researching your solution - not blast campaigns to cold lists wondering why you're stuck at 1.69%.
Send fewer emails to the right people. Watch your CTR climb.
Set Your Own Benchmark
Industry averages are context, not targets. The three benchmarks that actually matter are your own 90-day CTR trend, your CTR split by email type (campaigns vs. flows), and your CTOR.
Track those monthly. If your campaign CTR is trending up over 90 days, you're winning - regardless of whether you're at 2.1% or 4.3%. If it's flat or declining, the fix is almost always one of three things: list quality, content relevance, or CTA clarity. We've seen teams obsess over industry benchmarks when their real problem was sending to a list that was 30% invalid. Fix the foundation first, then optimize the creative.
The average CTR for email marketing will always vary by source. What won't vary is whether your own numbers are moving in the right direction.
FAQ
What's a good CTR for email campaigns?
For batch marketing campaigns, 2-5% is solid depending on your ESP and industry. Automated flows and welcome emails should hit 5-16%+. The most useful comparison is your own historical trend - if you're improving quarter over quarter, your program is healthy regardless of where you sit within that range.
What's the difference between CTR and CTOR?
CTR measures clicks against all delivered emails, reflecting overall campaign performance including subject line pull. CTOR measures clicks against opened emails only, isolating content and CTA quality. Use CTR for campaign-level reporting and CTOR to diagnose whether your email body is compelling once someone opens.
Does CTR include bot clicks?
It can. Security scanners from major inbox providers pre-click links to check for malware, inflating CTR artificially. Dark clicks peaked at 3+ million per day in early 2025. If your CTR spikes without a corresponding increase in conversions, check your ESP's bot-filtering settings before trusting the number.
How can I clean my list to improve CTR?
Run your list through a verification service before every major send. Removing dead addresses lifts CTR by shrinking the denominator and improving deliverability simultaneously. Most verification tools cost a fraction of a cent per email, and the ROI is immediate - fewer bounces, better inbox placement, and a CTR number you can actually trust.