Average Selling Price: The Most Misunderstood Metric in Business
Every team calculates average selling price. Finance puts it in the board deck, product uses it to justify roadmap bets, and sales leadership watches it like a vital sign. The problem isn't the math - it's the interpretation. ASP absorbs dozens of competing forces into a single number, and most teams read it at face value without asking what's hiding underneath.
What Is ASP in Sales?
Average selling price (ASP) is the mean price at which a product or service sells over a given period:
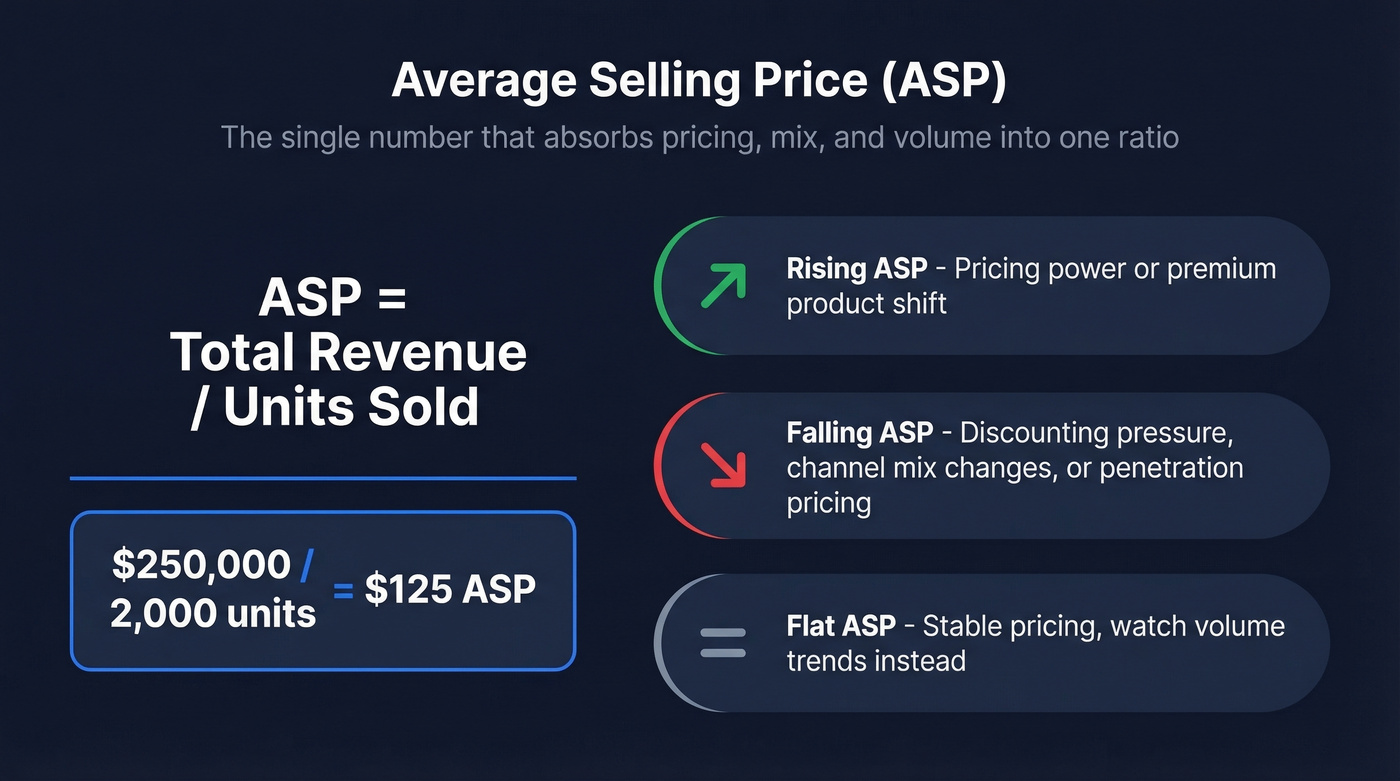
ASP = Total Revenue / Units Sold
Generate $250,000 from 2,000 units last quarter and your ASP is $125. No weighting, no adjustments - just a clean division.
If you've seen the ASP business term in a board deck or analyst report, this is what it refers to: a straightforward ratio that carries outsized strategic weight. The metric directly affects pricing strategy, competitive positioning, and financial reporting. A rising ASP signals pricing power or a shift toward premium products. A falling one points to discounting pressure, channel mix changes, or deliberate penetration pricing. The number alone doesn't tell you which.
Don't confuse ASP with margin. ASP tells you what customers pay, not what it costs you to deliver. Selling price from cost and margin uses a different formula - Price = Cost / (1 - Margin%) - and conflating the two leads to bad decisions fast.
When ASP Lies
ASP is a mean. Means lie. Here are the three most common ways.
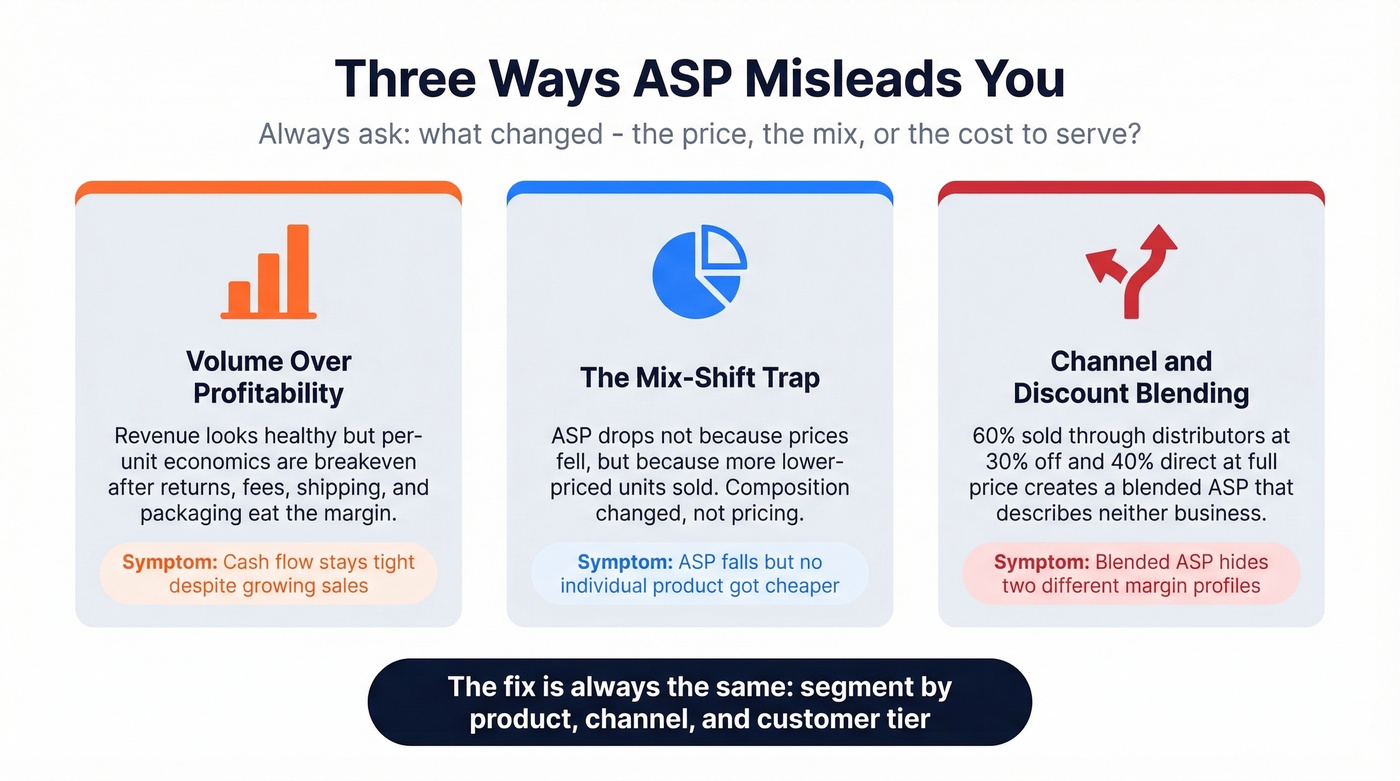
Chasing volume instead of profitability. An eBay seller shared a painful lesson on Reddit: for years, they chased sales volume while cash flow stayed tight. Returns, platform fees, shipping, and packaging ate the margin on every transaction. Dropping an entire product line that looked fine on revenue actually improved their financial position because per-unit economics were breakeven once all costs landed. ASP looked healthy. Profit was nonexistent.
The mix-shift trap. Real estate illustrates this perfectly. If a market's average selling price drops, the instinct is to say "prices fell." But often what happened is that more lower-priced homes sold - a composition shift - not that any individual home lost value. The median can be misleading here too, because it shifts when the mix of what's selling changes. Neither average nor median self-corrects for mix. Only segmentation does.
Discounts, bundles, and channel mix. Sell 60% of your units through a distributor at 30% off list and 40% direct at full price, and your blended ASP tells you almost nothing useful. Segment by channel and you'll find two completely different businesses inside one number.
The diagnostic question is always the same: what changed - the price, the mix, or the cost to serve?
ASP vs AOV vs ARPU vs ACV
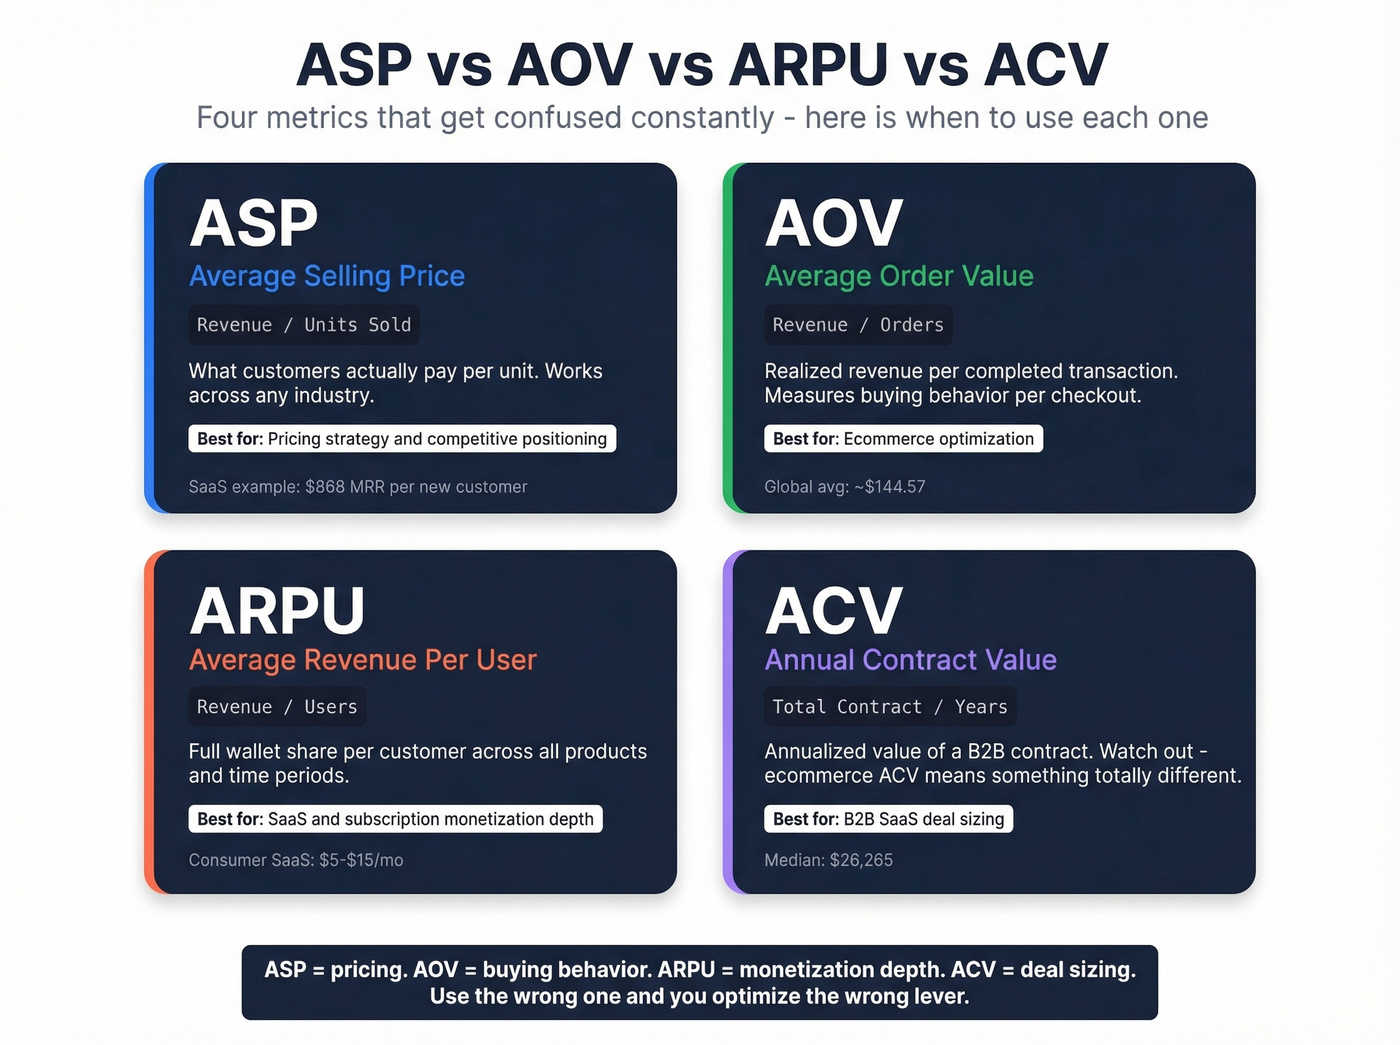
These four metrics get tangled constantly, especially because "ACV" means different things in different industries.
| Metric | What It Measures | Best For | Benchmark |
|---|---|---|---|
| ASP | Revenue / units | Any industry | SaaS example: $868 MRR new-customer avg |
| AOV | Revenue / orders | Ecommerce | Global: ~$144.57; U.S. online retail: ~$153.21 |
| ARPU | Revenue / users | SaaS, subscriptions | Consumer SaaS: $5-$15/mo; vertical SaaS: $200+ |
| ACV | Annual contract value | B2B SaaS | $26,265 median |
AOV counts completed transactions - realized revenue per order. In ecommerce, "Average Cart Value" includes abandoned carts, so the gap between cart value and AOV is a clean signal of cart abandonment. Don't confuse ecommerce ACV with SaaS ACV (Annual Contract Value). They share an acronym and nothing else.
ARPU aggregates across products and time. In vertical SaaS, where companies layer payments, scheduling, and marketing into one platform, ARPU captures full wallet share per customer in a way that ASP per individual product can't. Hospitality has its own variant - ADR (Average Daily Rate) - which is functionally the same "price per unit" idea for hotel rooms and follows the same mix-shift traps.
Here's the thing: none of these metrics replace each other. ASP tells you about pricing. AOV tells you about buying behavior. ARPU tells you about monetization depth. Use the wrong one and you'll optimize the wrong lever.
Your ASP is only as strong as the buyers your reps reach. Prospeo gives you 30+ filters - buyer intent, funding, headcount growth, technographics - so every conversation targets accounts that close at higher price points. 98% email accuracy means zero wasted outreach on dead leads.
Stop selling cheap because you're reaching the wrong people.
How SaaS Teams Use ASP
In SaaS, ASP usually means the average MRR added per new customer - and understanding what it signals is critical for choosing the right go-to-market motion:

SaaS ASP = Total New MRR Added / Number of New Sales
This number directly determines your sales motion. The thresholds from Directive are a useful framework:
- Self-serve (under $500 MRR): Marketing automation and product-led growth. Hiring reps to close these deals rarely pencils out.
- Inside sales ($3K-$5K MRR): Demos, trials, transactional closing.
- Enterprise ($30K-$50K MRR): Multi-threaded deals, procurement cycles, custom SOWs.
We've seen teams double their ASP just by repackaging existing features into a higher tier - no new engineering required. The math is powerful: increasing ASP by 20% has the same revenue impact as closing 20% more deals. For most teams, raising ASP through better packaging, upsells, or reaching higher-value buyers is far easier than scaling pipeline by a fifth.
Let's be honest - if your deal size sits below $10K annually, you probably don't need a complex sales motion. You need a product that sells itself and a data source like Prospeo that lets reps reach the right buyers at roughly $0.01 per verified email, so every dollar of sales cost goes toward deals that actually move the needle on ASP.
How ASP Shows Up in Earnings
Wall Street decomposes revenue into two drivers: Revenue = Volume x ASP. When one grows faster than the other, analysts want to know why.
Natera's FY 2025 results are a clean example. Tests processed grew 15.0% to 3,525,500. Revenue grew 35.9% to $2,306.1 million. That gap between volume growth and revenue growth? ASP improvement. Natera explicitly called out "average selling price improvements" as a revenue driver alongside volume.
This decomposition reveals pricing power. A company growing revenue purely on volume is in a fundamentally different position than one growing on ASP. Volume-driven growth requires scaling operations. ASP-driven growth drops more to the bottom line.
In our experience, when you see a stock move on earnings, checking whether the surprise came from units or price changes rewrites the entire narrative. Apple's iPhone ASP, for instance, has been a recurring analyst obsession for years - and it tells you more about product strategy than any keynote does.
Why ASP Changes Over Time
ASP follows a predictable arc tied to product lifecycle.
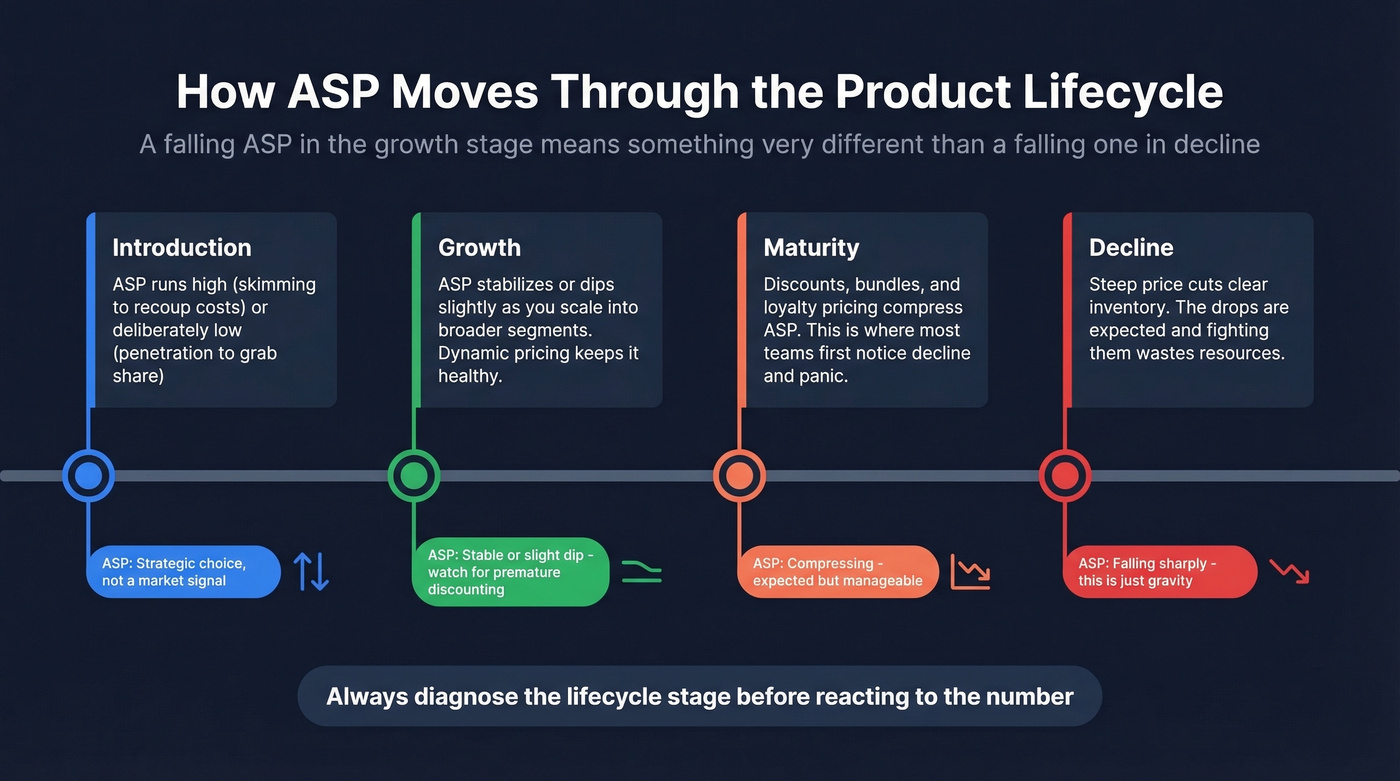
During introduction, it runs either high (skimming to recoup development costs) or deliberately low (penetration pricing to grab share) - either way, it's a strategic choice, not a market signal. In the growth phase, ASP stabilizes or dips slightly as you scale into broader segments, and dynamic pricing keeps it healthy. Maturity brings discounts, bundles, and loyalty pricing that compress ASP - this is where most teams first notice the decline and panic. In decline, steep price cuts clear inventory and the drops are expected.
A falling ASP in the growth stage means something very different than a falling one in decline. The first signals premature discounting. The second is just gravity. Always diagnose the stage before reacting to the number.
If your deal size sits below $10K, every dollar of sales cost matters. Prospeo delivers verified decision-maker emails at ~$0.01 each - 90% cheaper than ZoomInfo - so your unit economics stay healthy while you push ASP upward through better targeting and packaging.
Cut prospecting costs by 90% and protect your margins.
FAQ
Is a declining ASP always bad?
No. A company deliberately lowering prices to capture market share can see total revenue and profit grow when volume more than compensates for the per-unit decline. Amazon ran this playbook for over a decade.
How often should I recalculate ASP?
Monthly at minimum, weekly during promotions. Segment by product line and channel - blended ASP hides more than it reveals. Most finance teams automate this inside their BI tool on a rolling 30-day window.
What's the difference between ASP and list price?
ASP reflects the actual realized price after discounts, negotiations, and channel markups - not the sticker price on your rate card. The gap between list price and ASP is one of the clearest measures of discounting discipline on a sales team. If that gap exceeds 25%, reps are almost certainly giving away margin to close.
How does prospect data quality affect ASP?
Better data means reps reach actual decision-makers, which improves close rates on higher-value deals and lifts realized ASP. When your outbound team isn't burning hours chasing bounced contacts, they spend more time on the conversations that lead to bigger contracts - and that shows up directly in your average selling price.