How to Build a B2B Sales Process Flowchart That Actually Works
Every guide on this topic shows you six boxes connected by arrows and calls it a flowchart. That's a PowerPoint slide from 2014, not a diagnostic tool. A real B2B sales process flowchart has decision diamonds at every transition, conversion benchmarks at every stage, and exit criteria for leads that don't qualify - so you can actually find where deals die.
Here's the quick version: build a flowchart with 6-7 stages, decision gates between each one, and real conversion numbers baked in. Match your qualification framework to deal complexity - BANT for SMB, MEDDIC for enterprise - and feed Stage 1 with verified prospect data so reps start with contacts that convert, not contacts that bounce.
HBR is widely cited for showing that companies with a formal sales process grow roughly 15% faster. That shouldn't surprise anyone when up to 70% of reps miss quota and average attainment sits around 43%. The process isn't optional. It's the difference between a team that forecasts accurately and one that's guessing every quarter.
Flowchart Stages and Benchmarks
Prospecting and Lead Generation
This is where the flowchart starts - and where most processes quietly fail. We've seen teams running 35%+ email bounce rates and then wondering why nothing downstream converts. Garbage in, garbage out.
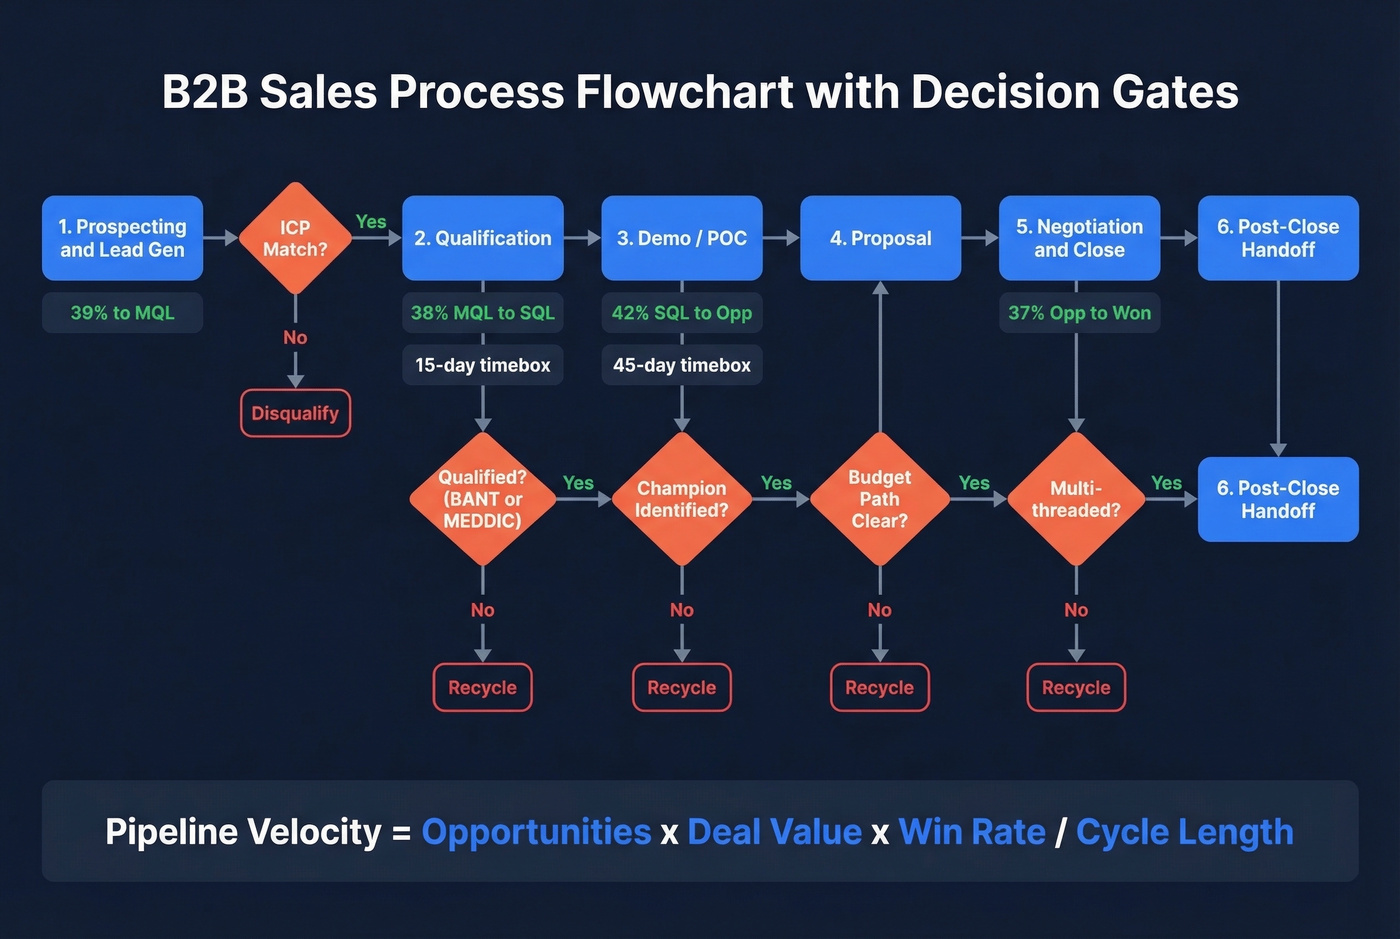
Prospeo's database gives you 300M+ professional profiles with 98% email accuracy and 125M+ verified mobile numbers, refreshed every 7 days. Reps spend time in stages that close deals instead of chasing dead addresses. The flowchart's first decision diamond is simple: does this lead match your ICP? Yes moves forward. No gets disqualified immediately.

Qualification (Decision Diamond)
This is the most important gate in your entire flowchart. Four gating questions: does the prospect have a real need, can you deliver measurable value, is there budget or a path to creating it, and do you have access to the decision-maker? HEFLO's B2B process model recommends a roughly 15-day timebox. If you can't qualify or disqualify within two weeks, something's broken.
Here's the thing: BANT works fine for simpler SMB and transactional deals. Using it for enterprise is a mistake - budget is often created after the business case, not before. For complex deals, MEDDIC forces you to map the economic buyer, decision criteria, and champion before investing in a demo. The framework you pick should be a literal branch in your flowchart, not an afterthought scribbled in a Notion doc.
Demo / Proposal / POC
Target a 45-day timebox. If there's no decision by the end of that window, the AE makes a call: proceed to negotiation with a clear path, or document learnings and move on. Too many teams let deals linger here for months, destroying pipeline velocity.
Negotiation and Close
For higher-ACV deals with 6+ stakeholders, a Mutual Action Plan is non-negotiable. Gartner data shows 77% of buyers think the buying process is "too complex" - a MAP cuts through that. An analysis of 1.8M opportunities found closed-won deals have roughly 2x as many buyer contacts as lost deals. Your flowchart should include a checkpoint here: are you multi-threaded, or single-threaded and vulnerable?
Post-Close and Handoff
The flowchart doesn't end at "Closed Won." Add a delivery monitoring stage and a structured handoff to CS. Document outcomes on lost deals too - that data feeds your next iteration.
Conversion Benchmarks by Stage
B2B SaaS conversion benchmarks to pin to each transition in your sales pipeline diagram:
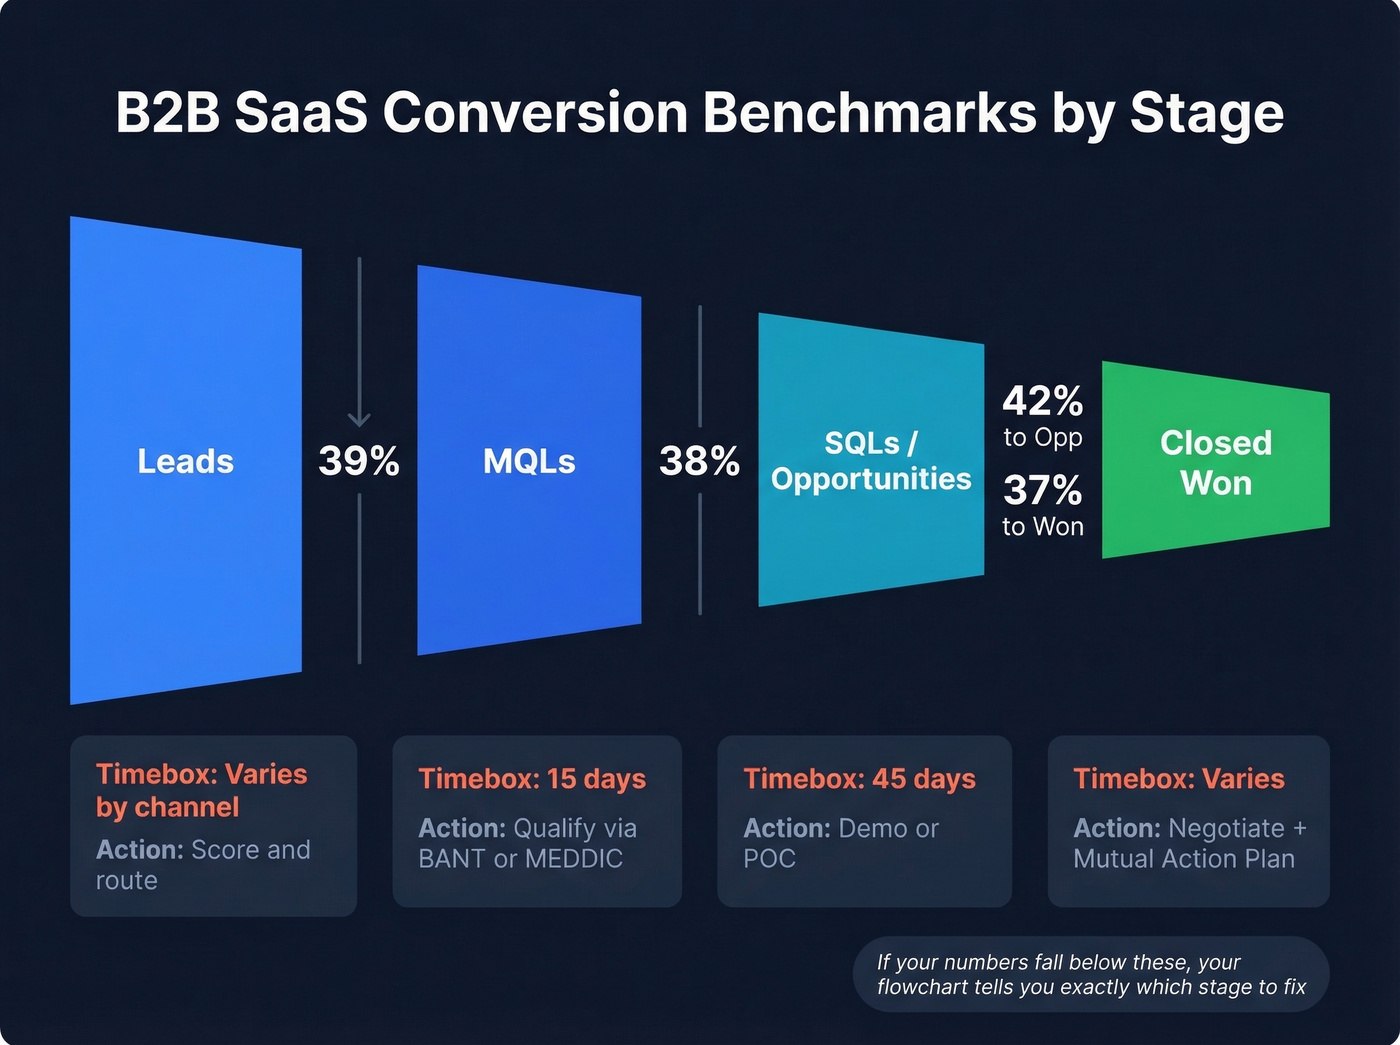
| Stage Transition | B2B SaaS Benchmark | Timebox | Key Action |
|---|---|---|---|
| Lead to MQL | 39% | Varies by channel | Score and route |
| MQL to SQL | 38% | ~15 days | Qualify via BANT/MEDDIC |
| SQL to Opportunity | 42% | ~45 days | Demo/POC |
| Opp to Closed Won | 37% | Varies | Negotiate + MAP |
If your numbers fall significantly below these, the flowchart tells you exactly which stage to fix. No guessing required.
Pipeline Velocity Formula: (# Opportunities x Avg Deal Value x Win Rate) / Sales Cycle Length. Pin this to your flowchart - it's the single number that tells you if the process is getting faster or slower.
Enterprise vs. SMB Flowcharts
Stop trying to use one flowchart for both motions. In our experience, this is where most teams get it wrong - and where the "universal sales process" advice falls apart.
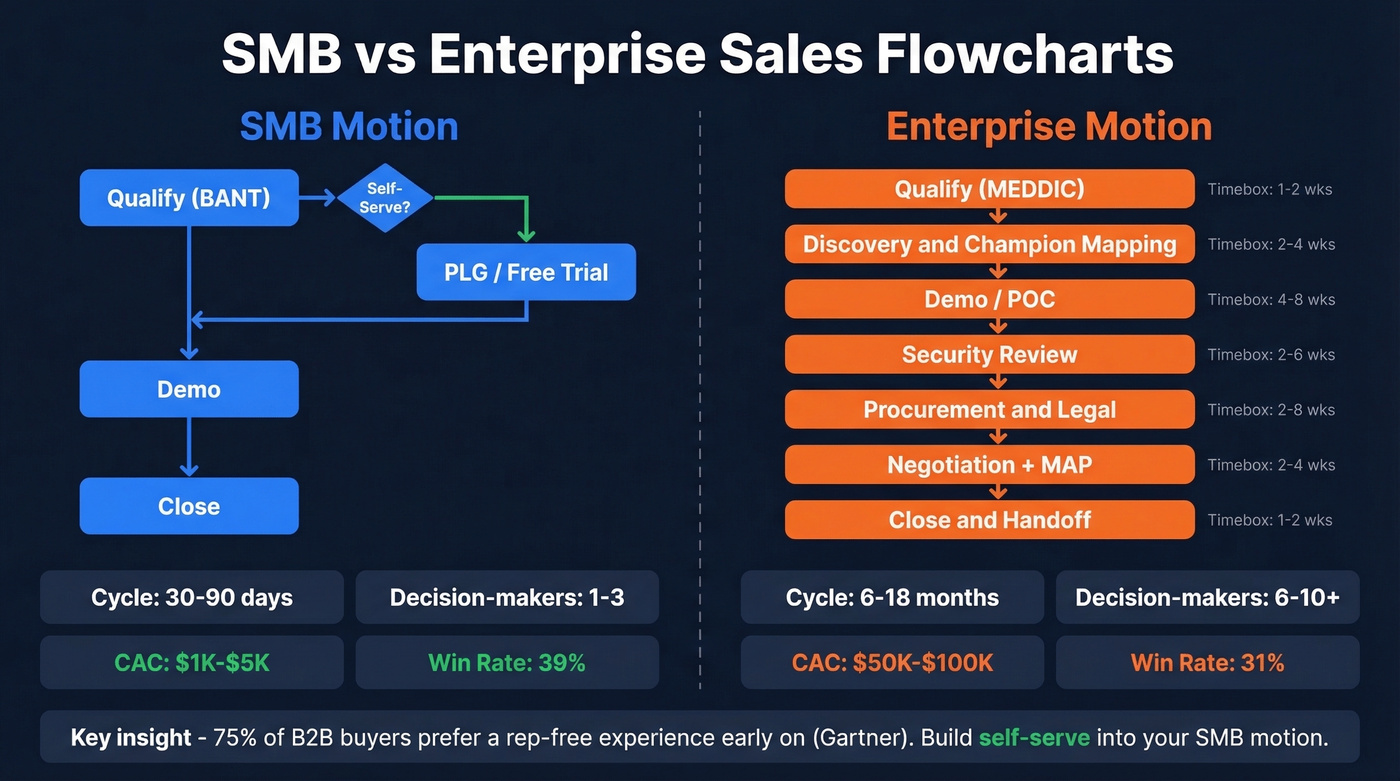
| Dimension | SMB | Enterprise |
|---|---|---|
| Cycle length | 30-90 days | 6-18 months |
| Decision-makers | 1-3 | 6-10+ |
| CAC | $1K-$5K | $50K-$100K |
| Opp to Close rate | 39% | 31% |
Your SMB flowchart should include a self-serve or PLG branch. Gartner found 75% of B2B buyers prefer a rep-free experience early on. Let them qualify themselves through a free trial or product tour before a rep engages.
Your enterprise flowchart needs additional stages: security review, procurement, legal. These aren't optional add-ons - they're where enterprise deals stall and die. Build them into the diagram explicitly, with their own timeboxes and owners.
If your average deal is under $5K and your cycle is short, you probably don't need a 7-stage flowchart at all. Three stages - qualify, demo, close - with tight timeboxes will outperform an elaborate process your reps ignore.
Your flowchart is only as strong as the data feeding Stage 1. Teams using unverified contact data see 35%+ bounce rates - killing every downstream conversion benchmark. Prospeo's 300M+ profiles with 98% email accuracy and 7-day refresh mean reps enter the qualification stage with contacts that actually pick up.
Stop diagnosing pipeline leaks caused by bad data at the top.
How to Build Your Sales Process Flowchart
Map reality first, not the ideal. Pull your CRM data: actual stage durations, actual conversion rates, actual reasons deals stall. Your flowchart should reflect what's happening, then you iterate toward what should happen.
For format, choose swimlane over linear if your team has SDR/AE/SE/CS handoffs. Swimlanes make ownership visible - you can see exactly where a deal changes hands and where handoff friction lives. Venngage has solid swimlane examples if you need a visual reference.
Let's talk tools. Here's what I'd actually recommend:
- Miro - free tier, paid plans from around $8-$10/user/month. Best for team collaboration.
- Lucidchart - free tier, paid from around $8/user/month. Best for complex diagrams with lots of decision branches.
- Creately - free swimlane templates to start fast.
- monday CRM - from around $12/seat/month if you want the flowchart operationalized inside your CRM.
Track your pipeline velocity formula after every quarterly update. If the number isn't improving, the flowchart needs another pass.
Five Mistakes That Kill Your Flowchart
- Mapping the ideal instead of the real. Start with CRM data, not aspirations. We've watched teams build beautiful diagrams that no rep follows because they don't match how deals actually move through the pipeline.
- No metrics tied to stages. A flowchart without conversion benchmarks is decoration.
- Too much detail. If it takes 20 minutes to explain, you've lost the big picture.
- Never updating it. Look, your process changes quarterly. Your flowchart should too.
- Buying someone else's process. Build from your own win/loss patterns, not a downloaded template. The consensus on r/sales backs this up - cookie-cutter frameworks rarely survive contact with real prospects.
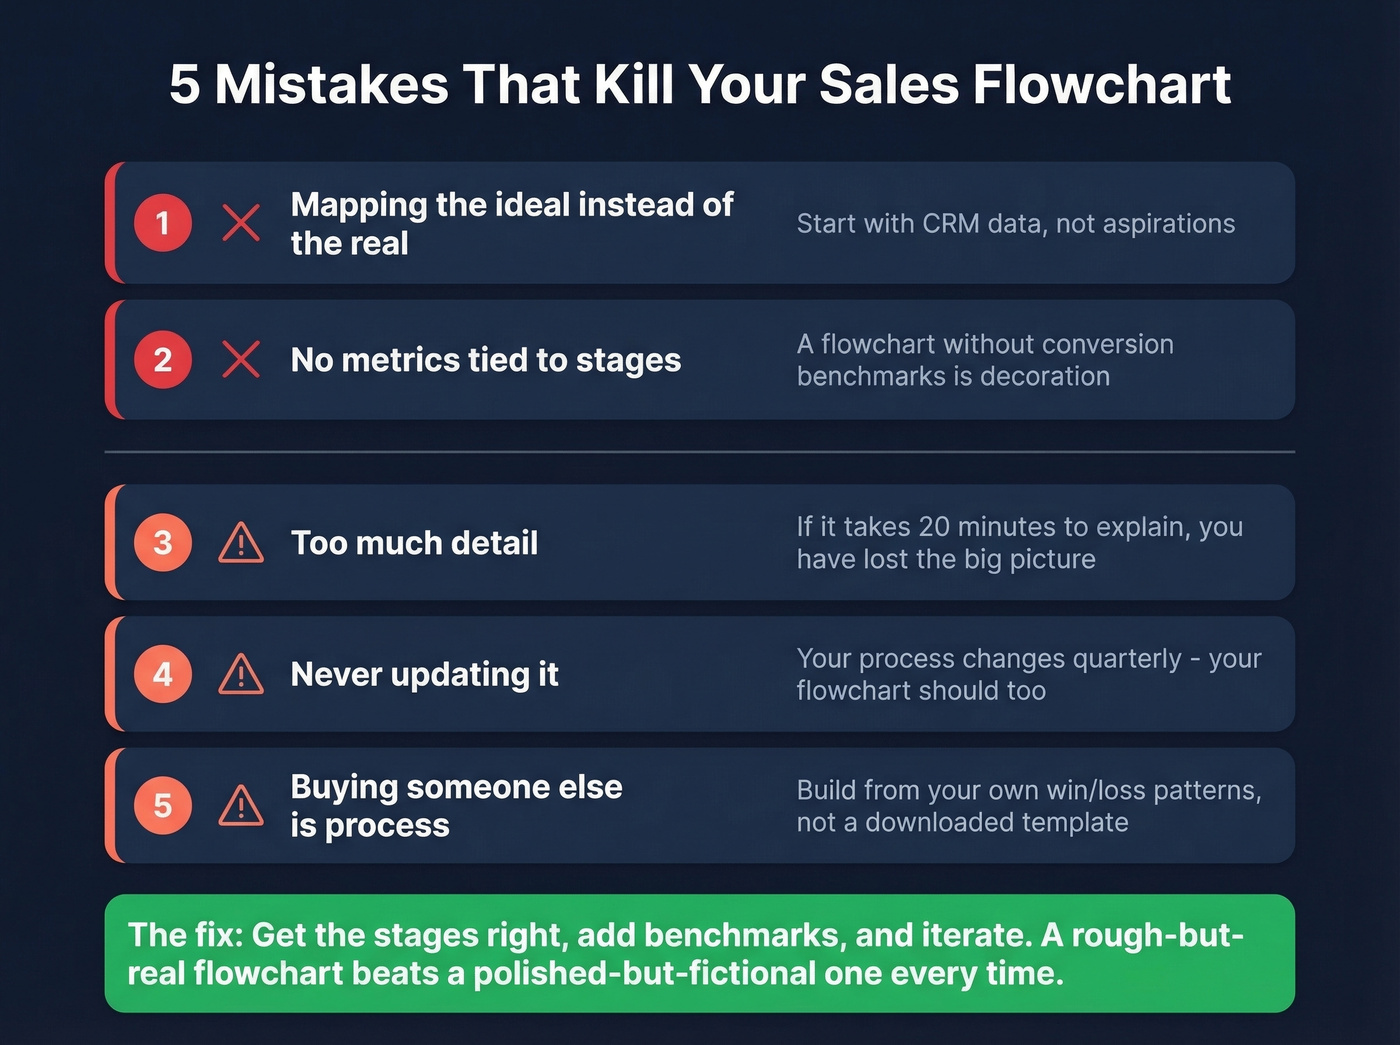
Skip the mistake of over-engineering your first version. Get the stages right, add benchmarks, and iterate. A rough-but-real flowchart beats a polished-but-fictional one every time.
A well-built B2B sales process flowchart isn't a one-time artifact - it's a living diagnostic tool. Pin benchmarks to every stage, enforce decision gates, and revisit it quarterly with fresh CRM data. That's how you turn a diagram into something that actually drives revenue.
Pipeline velocity = opportunities × deal value × win rate ÷ cycle length. The fastest way to improve that number? Give reps verified emails and direct dials so they spend time in demo and close stages, not chasing dead contacts. Prospeo delivers 125M+ verified mobiles with a 30% pickup rate - at $0.01 per email.
Accelerate every stage of your flowchart with data reps actually trust.
FAQ
What's the difference between a sales process and a sales funnel?
A sales process is the sequence of actions your team takes to move a deal forward; a sales funnel measures conversion rates between stages. Your flowchart combines both - mapping rep activities alongside stage-to-stage drop-off percentages so you can diagnose exactly where pipeline leaks.
How many stages should a B2B sales flowchart have?
Six to seven for most mid-market teams: prospecting, qualification, demo/POC, proposal, negotiation, close, and post-close handoff. Enterprise motions add security review and procurement as explicit stages - skip them and you'll wonder why deals stall at 80% probability.
What's the best way to get accurate data for Stage 1?
Use a verified B2B data platform with a short refresh cycle. Prospeo delivers 98%-accurate emails on a 7-day refresh at roughly $0.01/lead, which keeps bounce rates under 4%. Pair that with 30+ search filters - intent data, technographics, headcount growth - to feed only ICP-matched leads into your flowchart's first decision gate.