Customer Acquisition Cost for Startups: The 2026 Operating Manual
A RevOps lead we work with ran the numbers last quarter and realized his team had been underreporting CAC by 40% for two straight board decks. They'd left out sales tooling, content production costs, and half the SDR comp. The investors noticed. That conversation didn't go well.
CAC matters more than almost any metric except product-market fit, per David Skok's canonical framework. And a16z's analysis of 60+ public companies found that improving LTV:CAC from 2x to 3x nearly triples valuation. The stakes aren't abstract - they're your next round, your runway, and whether you survive long enough to figure out distribution.
Quick version:
- The formula: Total sales + marketing spend (fully loaded) / new customers acquired
- The metric that matters most: CAC payback period, not raw CAC. A $500 CAC with 6-month payback beats a $200 CAC with 18-month payback every time.
- What "good" looks like: Seed stage - payback under 12 months. Series A - LTV:CAC of 3:1 or better, gross margins above 70%.
What Startup CAC Really Means (And What Founders Get Wrong)
Customer acquisition cost is total sales and marketing spend divided by new customers acquired in the same period. Simple formula. But nearly 70% of SaaS businesses miscalculate it, usually by leaving costs out of the numerator.
Here's what belongs in the numerator - all of it:
- Ad spend - paid search, social, display, sponsorships
- Sales compensation - SDR and AE salaries, commissions, bonuses, manager comp
- Marketing salaries - demand gen, content, ops
- Tools and subscriptions - CRM, sequencing, data providers, analytics
- Content production - freelancers, agencies, design, video
- Overhead allocation - office space, travel, events proportional to S&M
That tools line item is real money. Data providers alone range from free tiers to $40K+/year enterprise contracts. Every dollar you spend acquiring customers belongs in the numerator, including the software that makes prospecting possible.
How to Calculate CAC Correctly
The basic formula is straightforward: Total S&M Spend / New Customers = CAC. But the version that actually matters to investors adjusts for gross margin in the payback calculation:
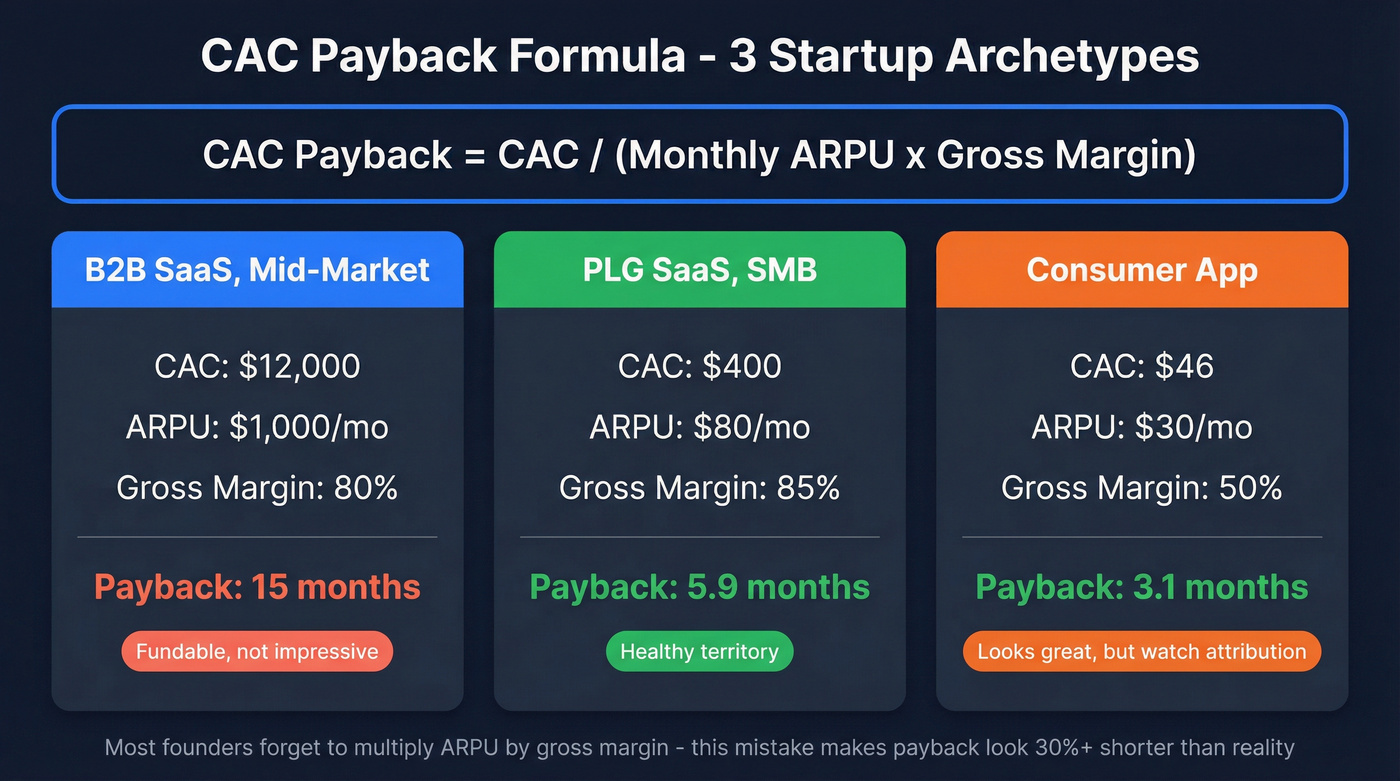
CAC Payback = CAC / (Monthly ARPU x Gross Margin)
Three startup archetypes illustrate the range.
B2B SaaS, mid-market: $12,000 CAC, $1,000/month ARPU, 80% gross margins. Payback = $12,000 / ($1,000 x 0.80) = 15 months. That's the median across 939 B2B SaaS companies per Optifai's 2025 dataset. Fundable, but not impressive.
PLG SaaS, SMB: $400 CAC, $80/month ARPU, 85% gross margins. Payback = $400 / ($80 x 0.85) = 5.9 months. Healthy territory - comfortably under the 6.8-month SaaS median.
Early-stage consumer app: $46 CAC via Google Ads, $30/month subscription, 50% gross margins. Payback = $46 / ($30 x 0.50) = 3.1 months. Looks great - but one founder on r/ycombinator reported this exact scenario and discovered their ad platform showed 3 conversions while the database had 5 signups. Attribution mismatch made the real CAC unknowable.
Most founders use raw ARPU in the payback formula instead of margin-adjusted ARPU. If your gross margins are 60% instead of 80%, your payback just got 33% longer. That's the difference between "fundable" and "concerning."
2026 Benchmarks Every Startup Should Know
Acquisition costs have risen 40-60% since 2023 across most B2B categories, driven by rising ad costs, privacy changes, and channel saturation. Here's where things stand.
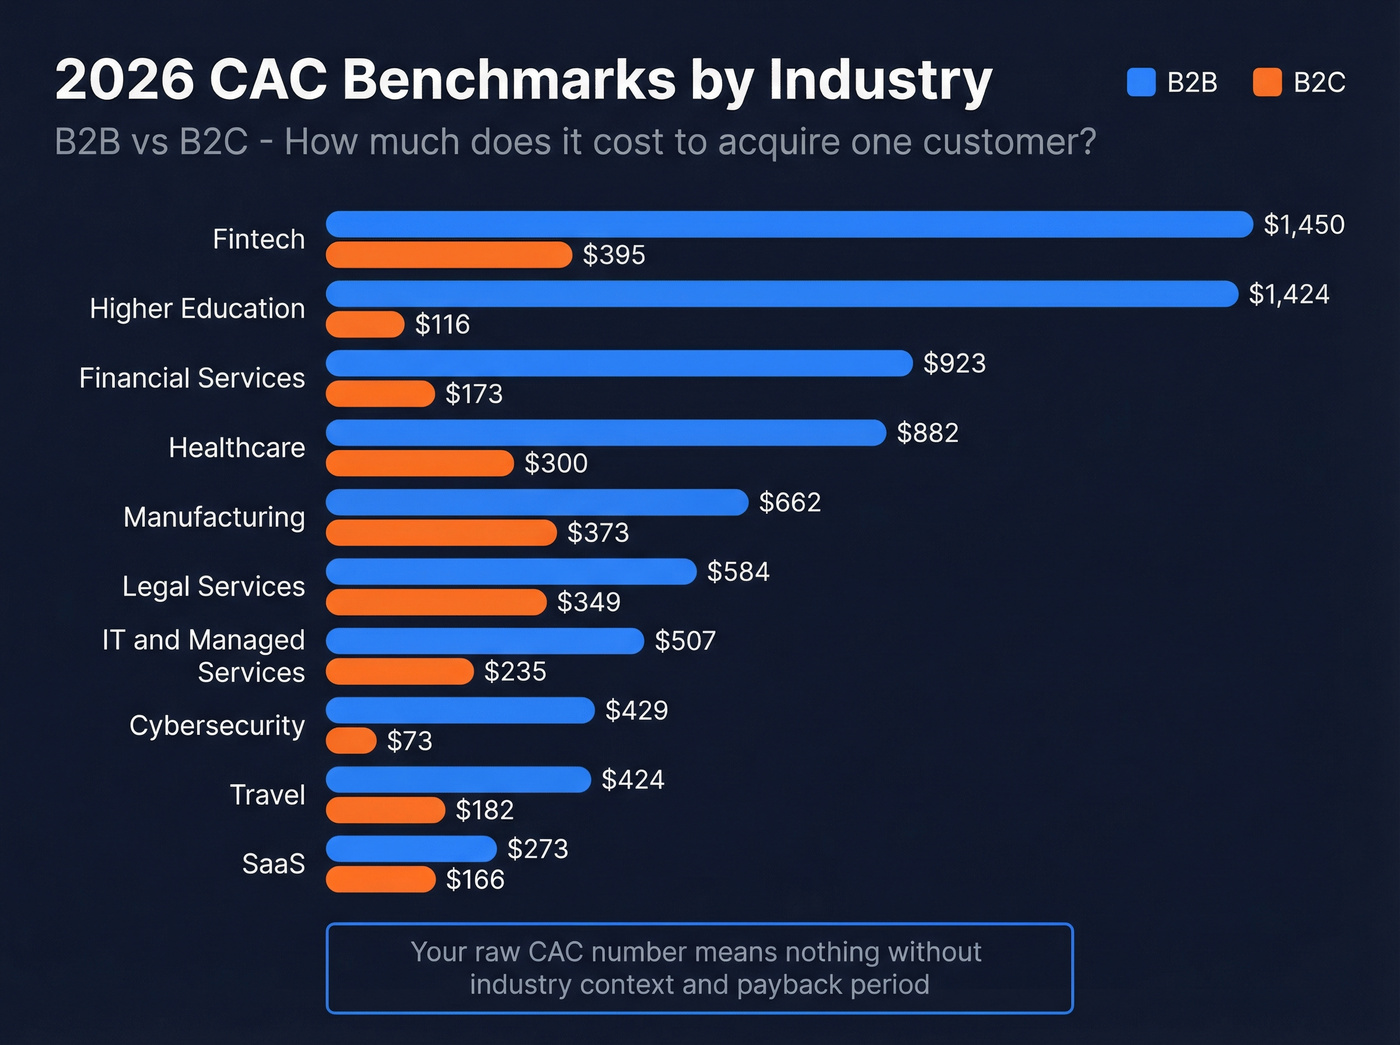
| Industry | B2B CAC | B2C CAC |
|---|---|---|
| SaaS | $273 | $166 |
| eCommerce | $84 | $68 |
| Financial Services | $923 | $173 |
| Higher Education | $1,424 | $116 |
| Fintech | $1,450 | $395 |
| Healthcare | $882 | $300 |
| Real Estate | $923 | $165 |
| Telecom | $315 | $196 |
| Manufacturing | $662 | $373 |
| Legal Services | $584 | $349 |
| IT & Managed Services | $507 | $235 |
| Cybersecurity | $429 | $73 |
| Travel | $424 | $182 |
| Automotive | $496 | $271 |
| Environmental | $541 | $278 |
Data from First Page Sage's 2026 benchmark report covering 29 industries. Benchmarks vary by dataset - Data-Mania reports B2B SaaS CAC closer to $536, reflecting different sample compositions.
The outliers tell the story. A $500 CAC in cybersecurity is a steal. A $500 CAC in eCommerce means something's broken. Your raw number means nothing without industry context and payback period. Understanding the average CAC for startups in your specific vertical is the only way to know whether your number is healthy or alarming.
Acquisition Cost by Segment and Channel
By Customer Segment
The segment you're selling into determines your CAC floor more than almost any other variable.
| Segment | CAC Range | Sales Cycle | Typical Payback |
|---|---|---|---|
| SMB | $100-$400 | 1-3 months | 3-8 months |
| Mid-market | $400-$800 | 3-6 months | 8-15 months |
| Enterprise | $800-$5,000+ | 6-18 months | 12-24 months |
Skok's framework puts this in sharper relief: any sales motion requiring human touch runs $400-$5,000 per customer. Direct field sales can push acquisition costs as high as $100,000 per deal. At that level, you need gross margin per deal north of $150K just to break even on the sales motion.
By Acquisition Channel
Not all channels are created equal, and the gap is massive.
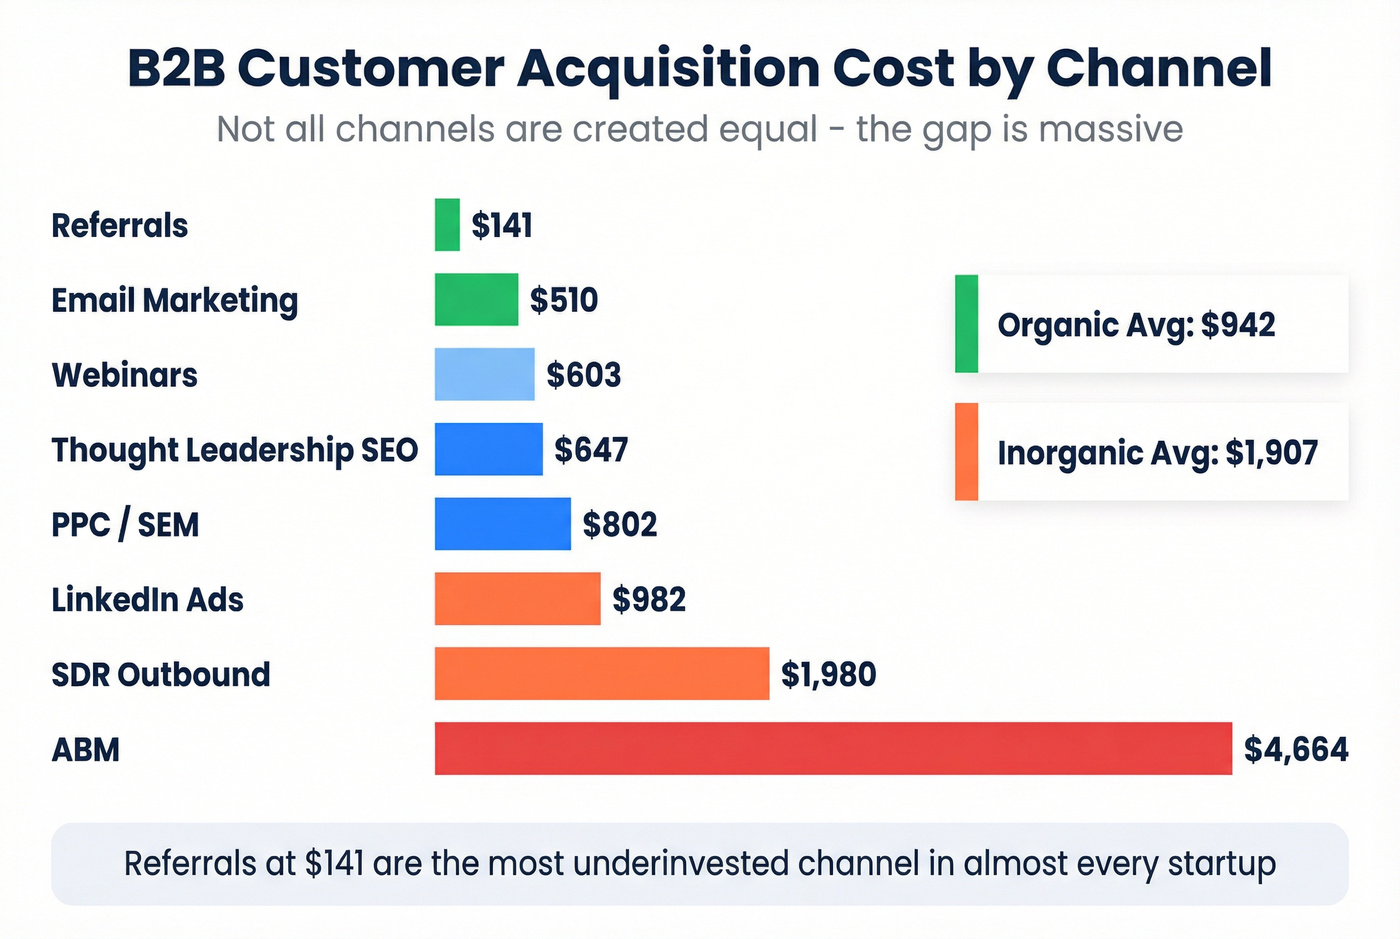
| Channel | B2B CAC | B2C CAC |
|---|---|---|
| Referrals | $141 | $200 |
| Email Marketing | $510 | $287 |
| Thought Leadership SEO | $647 | $298 |
| Webinars | $603 | $251 |
| PPC / SEM | $802 | $308 |
| LinkedIn Ads | $982 | N/A |
| SDR Outbound | $1,980 | N/A |
| ABM | $4,664 | N/A |
Channel benchmarks compiled from First Page Sage and Data-Mania datasets, based on ~120 firms and campaigns running Dec 2021-Nov 2024.
Organic channels average $942 CAC in B2B versus $1,907 for inorganic. Referrals at $141 are the most underinvested channel in almost every startup we've worked with. Teams pour money into paid acquisition while their happiest customers sit there, ready to refer, with zero incentives or systems in place.
One important caveat: most channels show elevated CAC during the first 4-6 months as campaigns optimize. Don't kill a channel based on month-one numbers.
That tools and subscriptions line in your CAC numerator? It matters more than most founders think. Prospeo replaces $40K/year data contracts with verified emails at $0.01 each - 90% cheaper than ZoomInfo - while delivering 98% accuracy that keeps your bounce rate under 4%.
Shrink your fully-loaded CAC without sacrificing pipeline quality.
CAC Payback Period - The Metric Investors Care About
Raw CAC is a vanity metric without payback context. A $5,000 CAC with 4-month payback is infinitely better than a $500 CAC with 24-month payback.
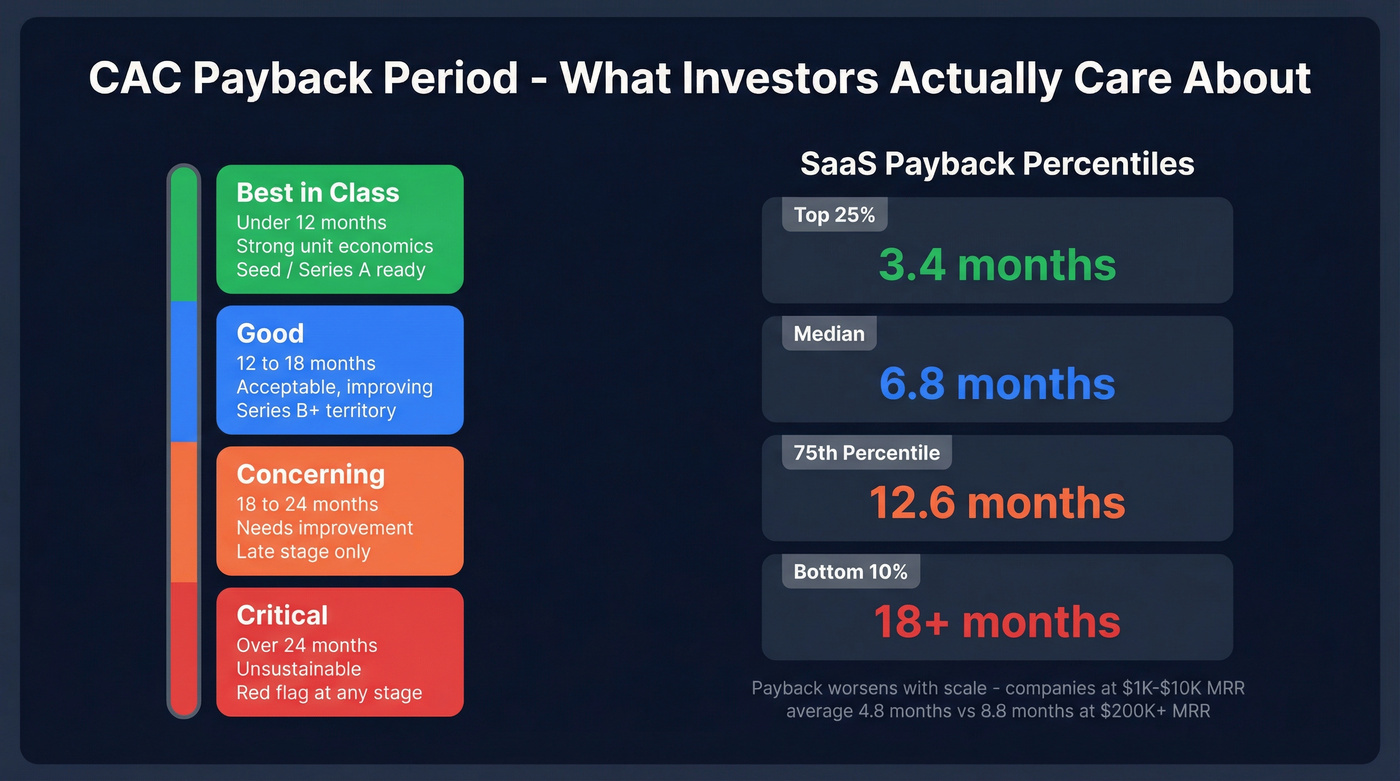
The Proven SaaS benchmark dataset shows wide variance:
| Percentile | Payback (months) |
|---|---|
| Top 25% | 3.4 |
| Median | 6.8 |
| 75th percentile | 12.6 |
| Bottom 10% | 18+ |
By model: B2C apps average 4.2 months, prosumer/SMB tools 6.2 months, and B2B SaaS 8.6 months. Payback also worsens with scale - companies at $1K-$10K MRR average 4.8-month payback versus 8.8 months at $200K+ MRR. You exhaust your best channels first, and every incremental customer costs more.
What Investors Expect by Stage
| Health Band | Months | Investor Read | Stage Fit |
|---|---|---|---|
| Best-in-class | <12 | Strong unit economics | Seed / Series A |
| Good | 12-18 | Acceptable, improving | Series B+ |
| Concerning | 18-24 | Needs improvement | Late stage only |
| Critical | >24 | Unsustainable | Red flag at any stage |
For Series A readiness in 2026, investors want CAC payback under 12 months, LTV:CAC of 3:1+, gross margins above 70%, and $1-2M ARR. For Series B+, the bar loosens slightly to 18 months, but anything beyond that signals structural inefficiency. Miss the payback threshold and you'll spend the entire partner meeting explaining why your unit economics will improve "at scale."
Here's the thing: if your average deal size is under $10K, you probably don't need a $40K/year data platform or a 6-person SDR team. Most early-stage startups would get better efficiency from a $99/month email tool, a referral program, and one good SDR than from the enterprise GTM stack they're trying to copy from Series C companies.
LTV:CAC - The Ratio That Drives Valuation
The 3:1 LTV:CAC benchmark exists for a reason. Below 3:1, you're spending too much to acquire customers relative to their lifetime value. At 1:1, you're literally breaking even on acquisition - no margin left for R&D, G&A, or profit.
But above 5:1 is also a problem. It signals you're underinvesting in growth. You've found a channel that works and you're not pouring enough fuel on it. Investors see a 7:1 ratio and think "this team is leaving revenue on the table."
a16z's analysis of 60+ public consumer internet companies found that improving LTV:CAC from 2x to 3x can nearly triple a company's valuation. That's not incremental - it's a multiplier effect. Investors also cross-reference NRR: at Series A, they want 110-120%+ net revenue retention, which directly inflates LTV and improves the ratio. Efficient acquisition without retention is a leaky bucket.
The practical distinction: CAC payback is your operating metric - check it weekly. LTV:CAC is your investor metric - it tells the board whether the business model is viable at scale. You need both.
5 Mistakes That Inflate Startup CAC
Cherrypicking Your Best Month
Presenting your lowest-CAC month as "our CAC" is the fastest way to lose credibility in diligence. Investors know about seasonality, one-off viral moments, and small-sample noise. Less than 3 months of data and less than $10K in spend isn't a CAC number - it's a guess.
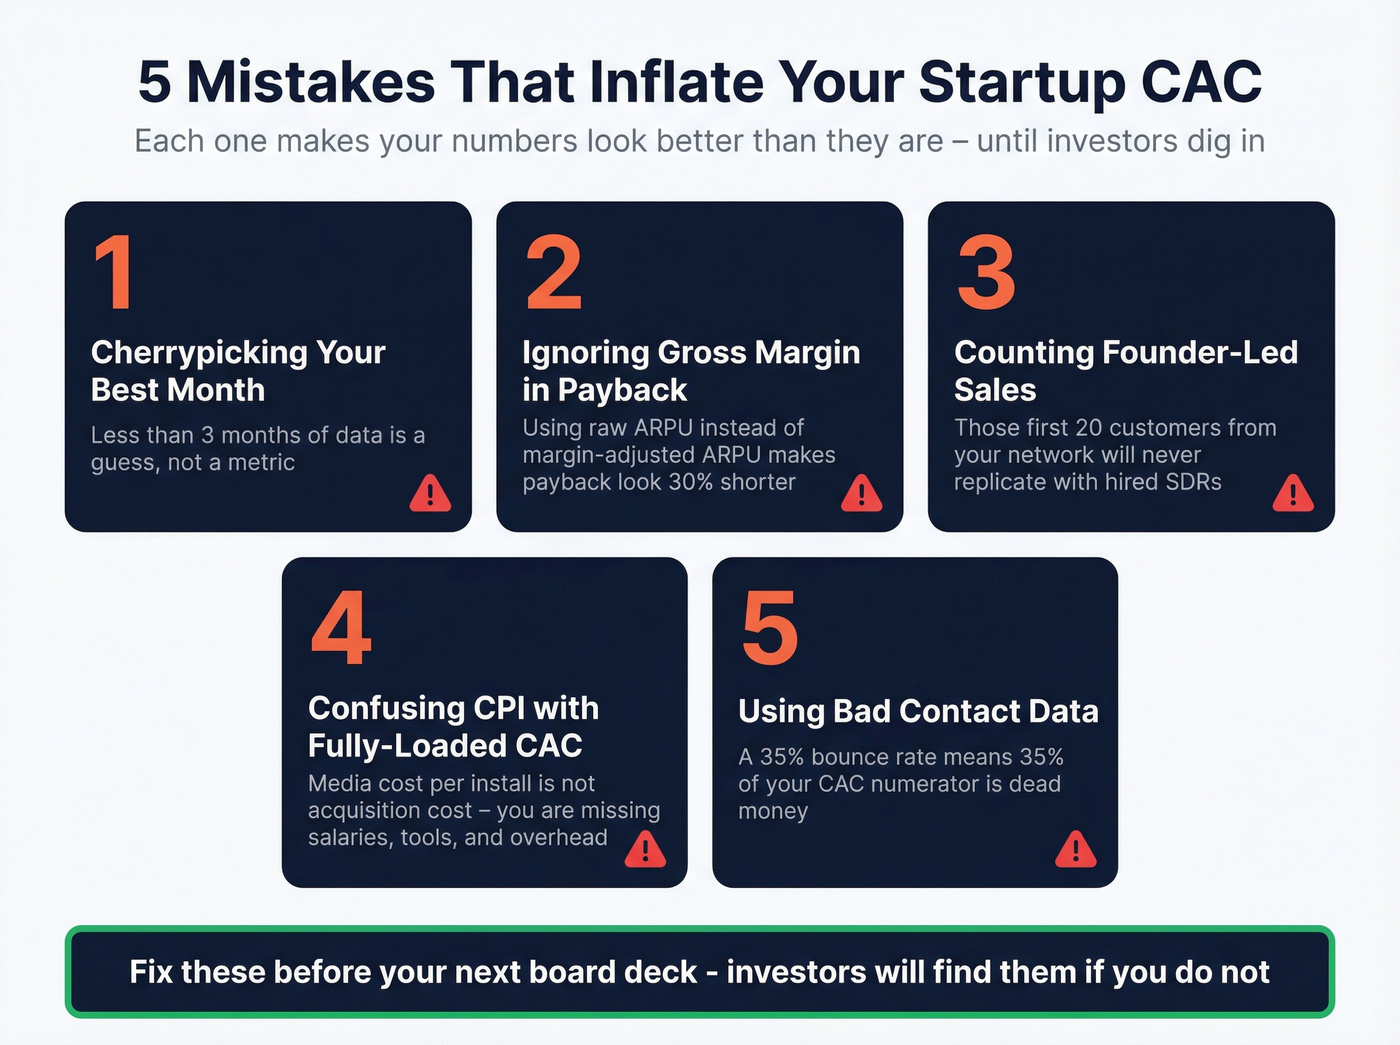
Ignoring Gross Margin in Payback
Most founders divide CAC by monthly ARPU and call it payback. Wrong. If your gross margins are 65% instead of 85%, your real payback is 30% longer than you think. Always use the margin-adjusted formula.
Counting Founder-Led Sales
Those first 20 customers you closed through your personal network don't count. Founder-led sales produce artificially low CAC that won't replicate when you hire your first SDR. This is the most common distortion in early-stage metrics, and it's the one that burns founders hardest when they try to model a repeatable sales motion off numbers that were never repeatable in the first place.
Confusing CPI with Fully-Loaded CAC
A founder on r/startups calculated their CAC at ~EUR9 using CPI and funnel conversion rates, versus the EUR200 benchmark they'd found elsewhere. The gap? CPI-derived cost per customer misses salaries, tools, creative production, and overhead. It's a media cost, not an acquisition cost.
Using Bad Contact Data
Every bounced email is wasted spend in your CAC numerator. If your SDR team's bounce rate is 35%, you're effectively paying 35% more per acquired customer - dead money flowing straight into your worst line item. Reducing acquisition costs starts with eliminating waste before you optimize anything else.
We saw this play out at Snyk, where 50 AEs were prospecting 4-6 hours per week with bounce rates of 35-40%. After switching to Prospeo, bounce rates dropped below 5%, AE-sourced pipeline jumped 180%, and the team generated 200+ new opportunities per month. At roughly $0.01 per lead versus $1+ at legacy providers, the tool cost barely registers in the numerator.
When (and How) to Start Tracking CAC
Not every startup should obsess over acquisition economics from day one. The metric only becomes meaningful once you have a repeatable GTM motion.
0-10 customers: Don't calculate CAC. You're validating product-market fit, not optimizing acquisition. Every customer came through founder hustle, and that's fine. Track qualitative signals - why people buy, how they found you, what objections they raise.
10-100 customers: Start tracking directional CAC. You've likely hired your first marketer or SDR. Separate founder-sourced deals from repeatable channels. Your number will be noisy, but the trend matters. This is also when real-time tracking starts to matter - waiting for quarterly board decks to discover a problem means you've already burned 3 months of runway.
100-1,000 customers: CAC is now a core operating metric. You should know it by channel, by segment, and by cohort. This is where disciplined unit economics become the difference between raising your next round and running out of cash. Skip this stage of rigor and you'll find out the hard way during diligence.
Let's be honest: Skok's warning is worth repeating. Founder-closed deals make CAC non-predictive of what a scaled sales team will actually cost. The number looks great on a deck and means nothing for your Series A model.
SDR outbound runs $1,980 per customer acquired. Half that cost is wasted on bad data - bounced emails, wrong numbers, stale contacts. Prospeo's 7-day data refresh and 125M+ verified mobiles with 30% pickup rates mean your reps connect faster. Teams using Prospeo book 26% more meetings than ZoomInfo users.
Cut your outbound CAC payback period by reaching real buyers on the first attempt.
FAQ
What's a good CAC for a startup?
SMB SaaS typically runs $100-$400, mid-market $400-$800, and enterprise $800-$5,000+. Raw CAC matters less than payback period - aim for under 12 months at seed/Series A stage, and always use the gross-margin-adjusted formula: CAC / (ARPU x gross margin).
How do you calculate CAC payback period?
Divide your fully loaded CAC by monthly ARPU multiplied by gross margin. Example: $6,000 CAC / ($500 ARPU x 0.80 gross margin) = 15 months. Include all sales and marketing costs - salaries, tools, ad spend, overhead - in the numerator.
What LTV:CAC ratio do investors expect?
3:1 is the minimum for Series A readiness; most VCs treat 3:1-5:1 as the healthy range. Below 1:1 is unsustainable, and above 5:1 signals you're underinvesting in growth and leaving revenue on the table.
Why does CAC increase as startups scale?
You exhaust your highest-converting, lowest-cost channels first and face diminishing returns on each incremental dollar. Industry-wide, B2B acquisition costs have risen 40-60% since 2023 due to higher ad prices, privacy regulations, and increased competition.
What's the cheapest way to reduce outbound CAC?
Start with data quality - verified contact data eliminates wasted outreach and lowers cost per booked meeting. Pair that with referral programs, which produce the lowest B2B CAC of any channel at $141 average.