Customer Acquisition Cost Examples: Real Numbers by Industry, Channel, and Stage
Your CFO just asked what it costs to acquire a customer. You pulled up ad spend, divided by new logos, and said "$180." That number is wrong - often by a lot.
Here's a customer acquisition cost example that shows the gap: a B2B SaaS team thinks their CAC is low because they only count ad spend. Include salaries, tools, and overhead, and the real number jumps fast. CAC rose 40-60% between 2023 and 2025, and most teams are still calculating it like it's 2019. Below, we'll walk through how to get the real number, what "good" looks like across industries, and where companies quietly bleed money without realizing it.
The Quick Version
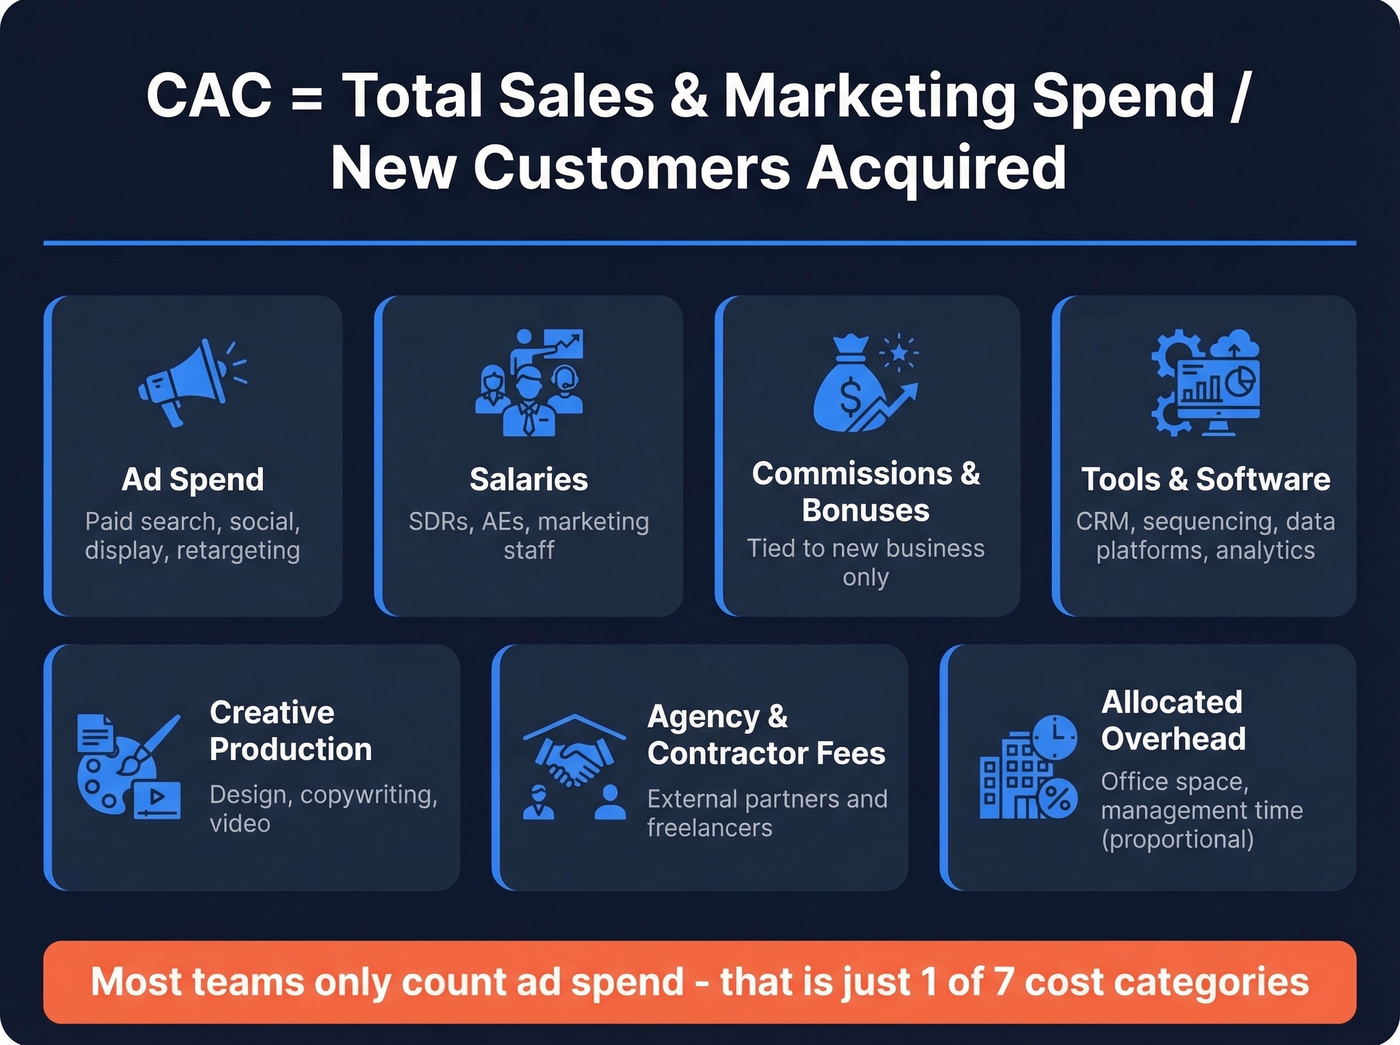
- The formula: Total Sales & Marketing Costs / New Customers Acquired = CAC
- What "good" looks like: B2B SaaS averages $239, eCommerce ~$86, Financial Services ~$784. Your number means nothing without an industry benchmark.
- The #1 mistake: Only counting ad spend. Salaries, tools, commissions, and overhead make up the bulk of true acquisition cost. If you're not including them, your CAC is a fantasy.
What Is Customer Acquisition Cost?
Customer acquisition cost is the total amount you spend to turn a stranger into a paying customer. Not a lead. Not a free trial signup. A customer who's given you money.
That distinction matters more than most teams realize. CAC and CPA get confused constantly - CPA measures the cost of any conversion (a form fill, a demo request, an app install), while CAC measures the cost of a revenue-generating customer. A $50 CPA and a $500 CAC for the same product aren't contradictory; they're measuring different stages of the funnel.
Investors, board members, and acquirers evaluate your business on CAC, not CPA. A 3:1 LTV-to-CAC ratio is the baseline for a healthy business. If you're reporting CPA as CAC, you're overstating your unit economics - and someone will eventually notice.
The CAC Formula and What to Include
The formula itself is simple:
CAC = Total Sales & Marketing Spend / Number of New Customers Acquired
The hard part is what goes into "total sales & marketing spend." A proper total acquisition cost example needs to account for every dollar that touches the acquisition engine:
- Ad spend across paid search, paid social, display, and retargeting
- Sales and marketing salaries, including SDRs, AEs, and marketing staff
- Commissions and bonuses tied to new business
- Tools and software - your CRM, sequencing tools, data platforms, analytics
- Creative production for design, copywriting, and video
- Agency and contractor fees
- Allocated overhead like office space and management time proportional to acquisition
One nuance that changes everything: new CAC vs. blended CAC. New CAC only counts spend and customers from net-new acquisition. Blended CAC mixes in expansion revenue (upsells, cross-sells) in a way that can make the number look better while hiding whether your acquisition engine actually works. Calculate both, but report new CAC to your board.
Four Real-World CAC Examples
eCommerce Brand
A DTC skincare company spends $9,500 on sales and marketing in a month and acquires 500 new customers.
CAC = $9,500 / 500 = $19
The B2B eCommerce average is $86. At $19, this brand is running an efficient machine - strong organic and referral channels are doing the heavy lifting alongside paid. This is what's possible when a brand invests early in owned channels rather than relying solely on paid media.
B2B SaaS Startup
A Series A SaaS company spends $50,000 in a quarter across SDR capacity, paid search, tooling/content, and overhead. They close 200 new customers.
CAC = $50,000 / 200 = $250
That's right in line with the $239 combined B2B SaaS average. In SMB SaaS, paid CAC often lands in the $300-$800 range, with enterprise sales-led motions pushing well past $1,000. At $250 with a blended motion, this team is healthy - but they should track organic and inorganic CAC separately to see which channels are actually pulling weight.
Enterprise Software: The $10,000 Number That's Actually Fine
$10,000 to acquire a single customer. That number makes seed-stage founders gasp and enterprise sales leaders shrug.
An enterprise vendor spends $250,000/quarter on a 4-person sales team, $100,000 on events and field marketing, and $50,000 on tools and overhead. They close 40 enterprise deals.
CAC = $400,000 / 40 = $10,000
Each deal is worth $120,000+ in ACV. With a 12:1 LTV-to-CAC ratio, this is excellent. Enterprise CAC is supposed to be high - the only question is whether LTV justifies it. Here, it does by a wide margin. If you're selling six-figure contracts, don't panic about a five-figure CAC; panic if your close rate drops.
Agency / Professional Services
| Agency Example | Industry Avg | |
|---|---|---|
| Quarterly spend | $25,000 | - |
| New clients | 50 | - |
| CAC | $500 | $500-$800 |
| Primary channel | Referrals + content | Varies |
At $500, this agency sits at the low end of the professional services range. Legal services average $749. The referral-heavy growth model is the difference - referrals are consistently one of the lowest-CAC B2B channels, and agencies that build referral engines early reap the benefits for years.
CAC Benchmarks by Industry (2026)
The most comprehensive B2B dataset comes from First Page Sage's January 2026 report, covering 29 industries from January 2022 through August 2025.
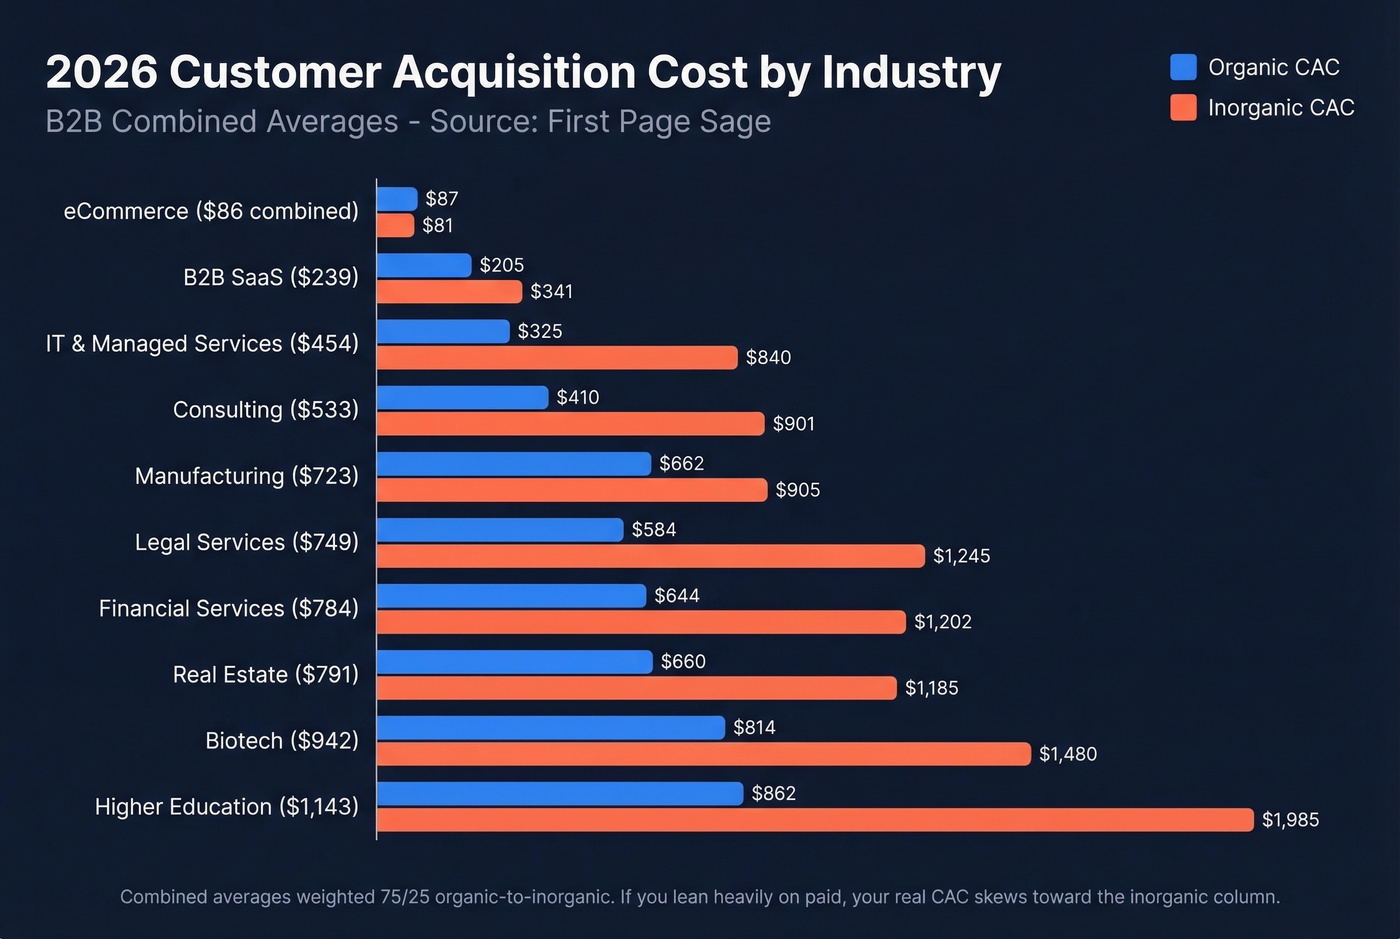
| Industry | Organic CAC | Inorganic CAC | Combined |
|---|---|---|---|
| B2B SaaS | $205 | $341 | $239 |
| eCommerce | $87 | $81 | $86 |
| Financial Services | $644 | $1,202 | $784 |
| Legal Services | $584 | $1,245 | $749 |
| Higher Education | $862 | $1,985 | $1,143 |
| IT & Managed Services | $325 | $840 | $454 |
| Manufacturing | $662 | $905 | $723 |
| Real Estate | $660 | $1,185 | $791 |
| Biotech | $814 | $1,480 | $942 |
| Consulting | $410 | $901 | $533 |
Inorganic CAC runs higher than organic in nearly every industry. The combined averages are weighted 75/25 organic-to-inorganic, reflecting the dataset's SEO-heavy client mix. If your company leans heavily on paid channels, your real CAC will skew closer to the inorganic column.
Within SaaS, sub-verticals vary wildly per Usermaven's 2026 benchmarks:
| SaaS Sub-Vertical | Combined CAC |
|---|---|
| Fintech | $1,450 |
| Insurance | $1,280 |
| Medtech | $921 |
| Security | $805 |
| Legaltech | $299 |
If you're in fintech SaaS and your CAC is $500, you're crushing it. If you're in legaltech and your CAC is $500, you've got a problem.
Data platforms are a real line item in your CAC formula. Most teams pay $1+ per lead for emails that bounce 15-20% of the time - inflating acquisition cost and tanking deliverability. Prospeo delivers 98% email accuracy at $0.01/email, so every dollar in your CAC calculation actually reaches a real buyer.
Stop padding your CAC with bad data. Start with 75 free emails.
CAC by Channel
This is where CAC analysis gets actionable.
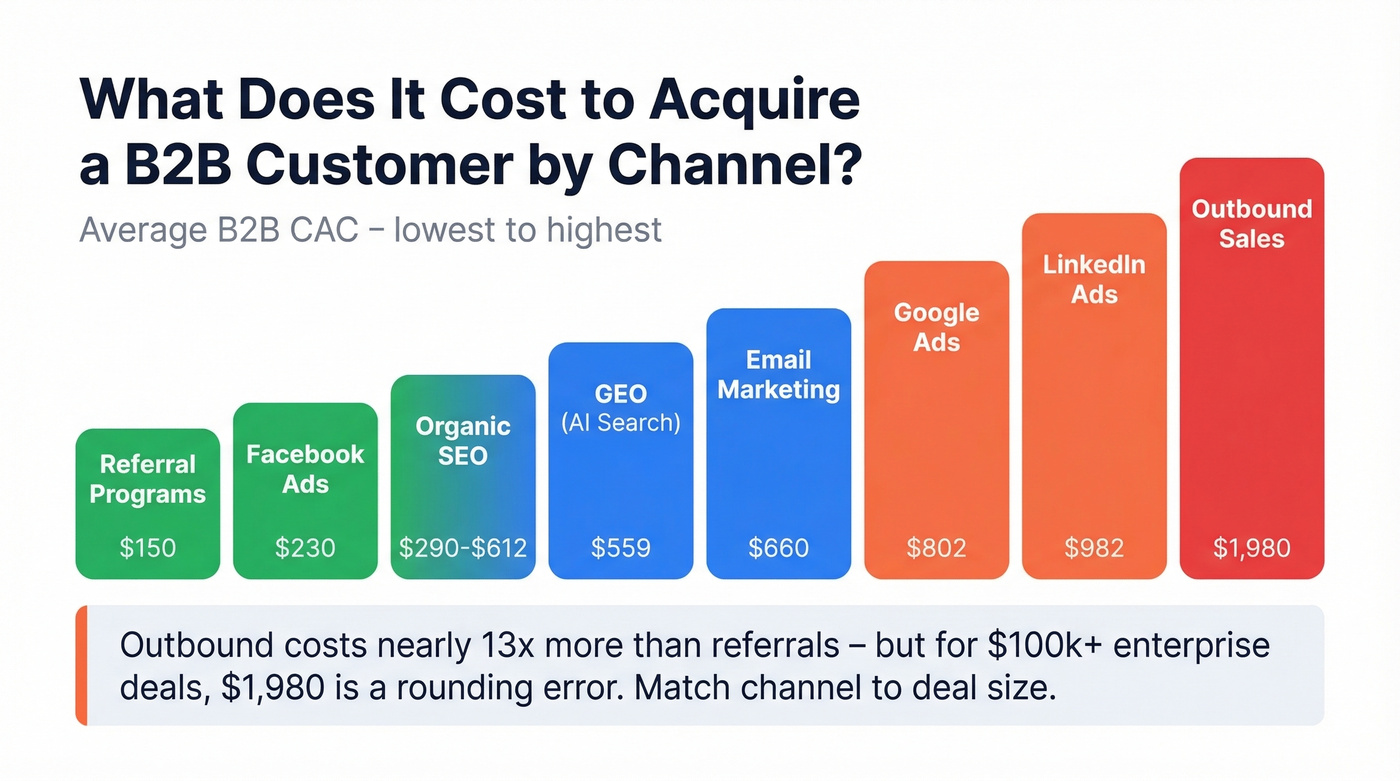
| Channel | Avg B2B CAC |
|---|---|
| Referral Programs | ~$150 |
| Facebook Ads | ~$230 |
| Organic SEO | ~$290-$612 |
| GEO (AI Search) | ~$559 |
| Email Marketing | ~$660 |
| Google Ads | ~$802 |
| LinkedIn Ads | ~$982 |
| Outbound Sales | ~$1,980 |
Referral programs deliver the lowest B2B CAC by a wide margin. Outbound sales is the most expensive - nearly 13x the cost of a referral. That doesn't mean outbound is bad; for enterprise deals with $100k+ ACV, a $1,980 CAC is a rounding error. But if your average deal size sits below $10k, outbound math gets brutal fast.
For retail and eCommerce, the numbers look different. Per Shopify benchmarks: email marketing runs $15.92 per customer, SEO $30.33, paid ads $59.17, and influencer partnerships $73.58.
One emerging channel worth watching: Generative Engine Optimization. A First Page Sage study of 127 companies found GEO averaging $559 CAC with a 27% higher conversion rate than traditional SEO. GEO CAC dropped from $2,134 in Q4 2023 to $559 by Q2 2025 as methods standardized - worth tracking if you're already investing in SEO.
Five Mistakes That Inflate Your CAC
1. Only counting ad spend. Salaries, tools, commissions, and overhead typically represent the majority of acquisition cost. If your "CAC" is just your Google Ads bill divided by conversions, you're lying to yourself.
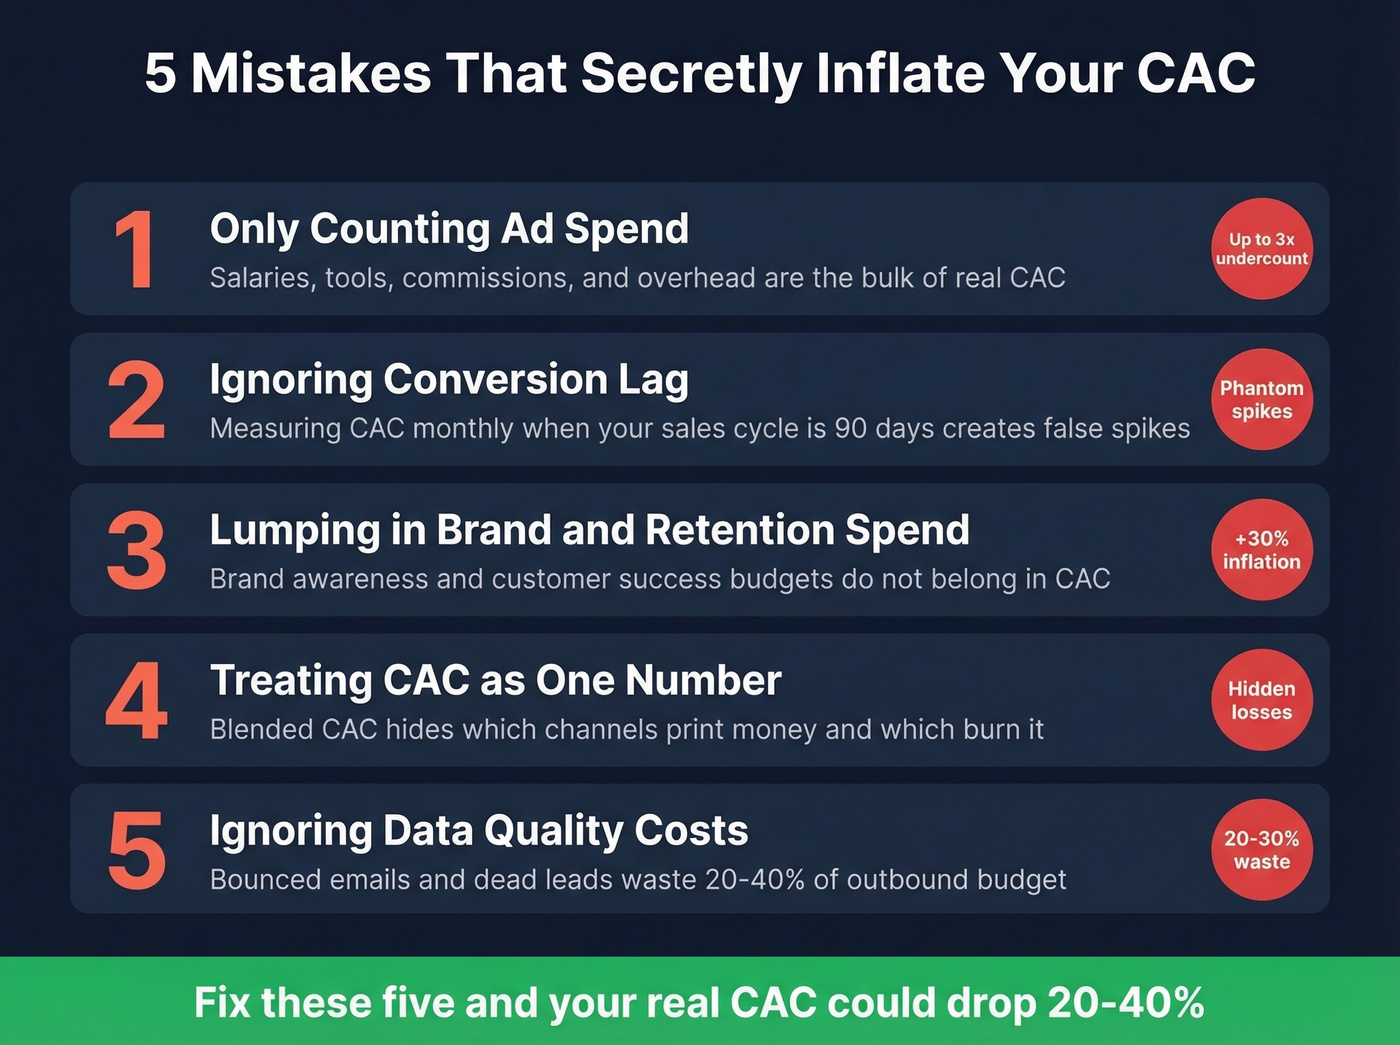
2. Ignoring conversion lag. If your sales cycle is 90 days but you're measuring CAC monthly, you'll see artificial spikes - spending in January, closing in April, and panicking about January's "infinite CAC." Align your reporting window to your actual sales cycle.
3. Lumping brand and retention spend into acquisition. That brand awareness campaign? The customer success team's budget? Product-led content for existing users? None of that belongs in your CAC numerator. We've seen teams accidentally inflate their CAC by 30% just by including the wrong cost centers.
4. Treating CAC as one number. Your LinkedIn Ads CAC and your referral CAC are completely different animals. Segment by channel, ICP, product line, and region. One blended number hides which channels are printing money and which are burning it.
5. Ignoring data quality costs. Here's the thing: if your outbound team sends 5,000 emails and 800 bounce while another 1,200 hit people who've changed jobs, you just wasted 40% of your outbound budget on dead leads. That waste flows straight into CAC. We've seen teams cut CAC 20-30% just by cleaning their contact database before launching campaigns.
CAC Payback Period
CAC alone doesn't tell you if your business is healthy. Payback period does.
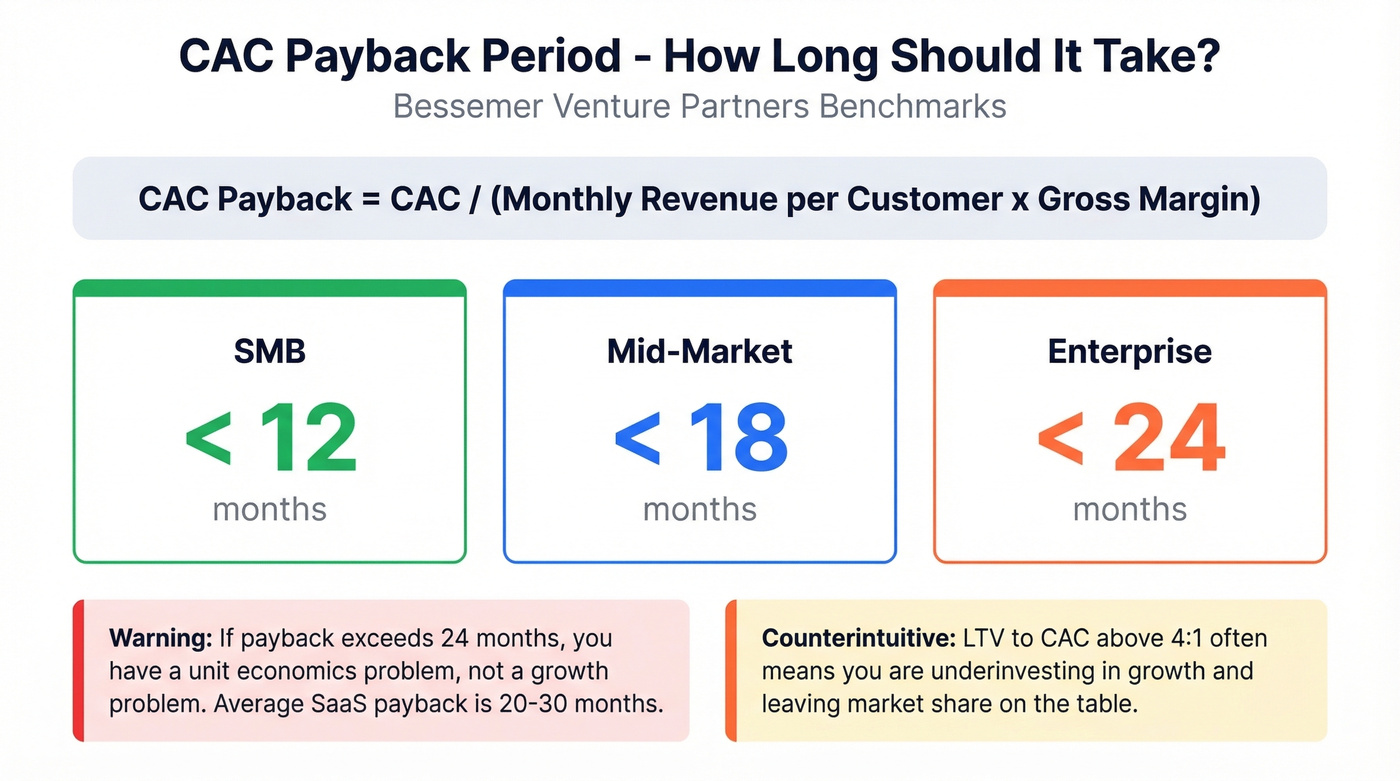
CAC Payback = CAC / (Monthly Revenue per Customer x Gross Margin)
Bessemer Venture Partners' benchmarks by segment:
| Segment | Target Payback |
|---|---|
| SMB | < 12 months |
| Mid-Market | < 18 months |
| Enterprise | < 24 months |
Average SaaS payback runs 20-30 months. Early-stage companies with unoptimized funnels can stretch to 36-48 months. If your payback exceeds 24 months, you don't have a growth problem - you have a unit economics problem. Either your CAC is too high, your pricing is too low, or your gross margins need work.
And here's the counterintuitive flip side: a ratio above 4:1 isn't necessarily good news. It often signals you're underinvesting in growth and leaving market share on the table. If your LTV:CAC is 6:1, you're probably not spending enough on acquisition. Your competitors will outgrow you while you congratulate yourself on efficiency.
When CAC Kills a Company
Webvan is the textbook case. The online grocery delivery company spent roughly $210 per customer acquired while aggressively expanding into new markets. They raised $375M in their IPO and hit a $1.2B peak valuation. Then they went bankrupt.
The math was simple - $210 CAC on grocery orders with razor-thin margins and no clear path to repeat purchase frequency that would justify the spend. High CAC is survivable only if unit economics work. Webvan's never did. Let's be honest: if your margins can't absorb your acquisition cost within a reasonable payback window, no amount of growth capital will save you.
How to Reduce Your CAC
Fix your data quality first. Bad contact data is the silent CAC killer - and the cheapest lever to pull. Prospeo's 98% email accuracy and 7-day data refresh cycle mean your outbound budget reaches real prospects instead of dead inboxes. At ~$0.01 per verified email, it's the single highest-ROI move most B2B teams overlook. One of our customers, Snyk, dropped their bounce rate from 35-40% to under 5% and saw AE-sourced pipeline jump 180%.
Shift spend toward lowest-CAC channels. Referral programs, organic SEO, and email marketing consistently deliver the lowest CAC. If 60% of your budget is in LinkedIn Ads and outbound, rebalancing even 20% toward referral and content can cut blended CAC by 15-25%.
Improve conversion rates across the funnel. One mobile app team reduced cost per install from $7.97 to $1.96 - a 75% drop - by restructuring ad groups into theme-based clusters, setting CPI caps, and adding geo targeting. You don't always need to spend less; sometimes you need to convert more of what you're already spending.
Invest in retention. Higher LTV makes CAC more sustainable even if CAC stays flat. A customer who stays 36 months instead of 12 triples the return on the same acquisition spend.
Kill wasted spend, not all spend. Stop obsessing over reducing CAC. Start obsessing over reducing wasted CAC. Kill underperforming channels, double down on winners, and measure each one independently. Skip the "cut everything by 10%" approach - it's lazy and it starves your best channels alongside your worst ones.
That enterprise CAC example above? $50K in tools and overhead per quarter. Teams using Prospeo cut prospecting tool costs by up to 90% vs ZoomInfo while booking 26% more meetings - directly improving both sides of the CAC equation: lower spend, more customers closed.
Better data means lower CAC. The math is that simple.
FAQ
What is a good customer acquisition cost?
It depends entirely on your industry and lifetime value - the baseline is a 3:1 LTV-to-CAC ratio. B2B SaaS averages $239 while Financial Services averages $784, so benchmarks vary dramatically by vertical. Anything above 4:1 may signal you're underinvesting in growth.
How often should I calculate CAC?
Calculate CAC monthly at minimum, but align your reporting window to your sales cycle length. A 90-day enterprise sales cycle measured monthly produces misleading spikes. Cohort-based reporting gives the clearest picture of true acquisition efficiency.
What's the fastest way to lower CAC?
Clean your contact data before launching campaigns. Teams using verified, recently refreshed data routinely cut outbound waste by 30%+ - which drops CAC immediately without changing spend or strategy.
How do you calculate CAC for a startup?
Use total sales and marketing spend divided by new customers, but include founder time, equity-based compensation, and tool costs. Early-stage startups that exclude these understate true CAC by 40% or more. Investors will recalculate it anyway - better to know the real number upfront.
Can you walk through a simple customer acquisition cost example?
Say you run a B2B newsletter platform. You spend $3,000 on Google Ads, $2,000 on content, and $1,000 on tooling - $6,000 total. You acquire 30 paying subscribers. CAC = $6,000 / 30 = $200. If each subscriber pays $50/month and stays 12 months, your LTV is $600 and your 3:1 ratio is healthy.