The Data-Backed Guide to the Customer Journey Funnel
Most funnel guides hand you a pretty diagram and zero numbers. You get five color-coded stages, a vague arrow pointing down, and advice like "create awareness." That's not a framework - it's a poster.
What actually moves the needle in a customer journey funnel is knowing your stage-to-stage conversion rates, understanding where people drop off, and building paths to bring them back.
What Is a Customer Journey Funnel?
The concept dates back to 1898, when E. St. Elmo Lewis sketched out AIDA - Attention, Interest, Desire, Action). Over a century later, most marketing teams still use some version of that linear model, even though buyer behavior has changed beyond recognition.
A customer journey funnel maps the stages a buyer moves through from first contact to purchase and beyond. The "beyond" part matters. Traditional funnels treat the sale as the finish line. Modern ones extend through retention and advocacy, because returning customers spend 67% more than new ones.
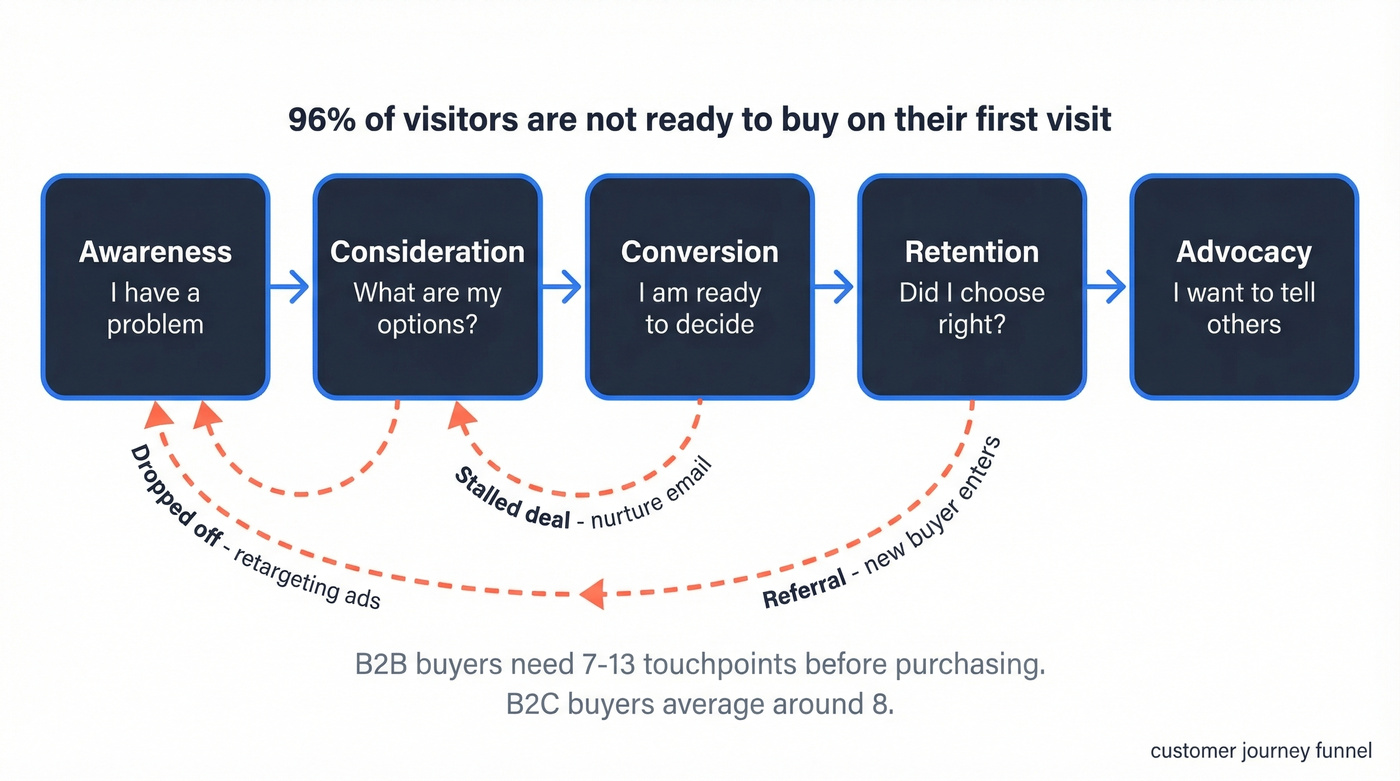
Here's the thing: 96% of visitors aren't ready to buy on their first visit. Your funnel isn't really a funnel at all - it's a system of re-entry loops, nurture sequences, and timed touchpoints designed to catch people when they're finally ready. The linear model was always a simplification. In 2026, it's a dangerous one if you take it literally. What you need instead is a buyer-centric framework built around how people actually research, evaluate, and decide - not how your internal pipeline happens to be structured.
The consensus on r/sales and r/AskMarketing is consistent: teams over-focus on funnel tools (ClickFunnels, GoHighLevel, WordPress) and under-invest in funnel strategy. The platform doesn't matter if you haven't defined your stages and set benchmarks. That's where we'll spend our time.
Quick Version
TL;DR - the entire framework compressed:
- Define 5 stages: Awareness → Consideration → Conversion → Retention → Advocacy
- Set benchmarks for each (industry-specific numbers below)
- Instrument tracking: GA4 for web behavior, CRM for pipeline stages, product analytics for in-app
- Build re-entry paths: remarketing and email sequences for the 85-95% who drop off at every stage
The three metrics that matter most: stage-to-stage conversion rate, pipeline velocity, and customer lifetime value (CLV).
Stop obsessing over funnel tools. The tool is the least important decision you'll make.
The 5 Buyer Funnel Stages
B2B buyers need 7-13 touchpoints before purchasing. B2C buyers average around 8. And 60% of consumers take 6+ actions before deciding to buy from a new brand. These aren't linear steps - people bounce between stages, drop off, and re-enter. But you still need a stage model to measure against. Five stages cover the full lifecycle; more than that and you're measuring noise.
Awareness
The buyer realizes they have a problem - or you put the problem in front of them. Channels here are broad: SEO, paid social, content marketing, events, word of mouth. The customer mindset is "I didn't know this existed" or "I didn't know this was solvable."
Your job isn't to sell. It's to earn attention and plant a seed with educational content that addresses the problem without pushing a product.
Consideration
Now they're researching. Comparing options. Reading reviews, watching demos, asking peers. B2B buyers at this stage are building internal business cases, while B2C buyers are reading comparison posts and checking Reddit threads. Your job is to be present in every channel they're evaluating - and to provide proof, not promises.
Lead magnets, webinars, and case studies do the heavy lifting here. Personalized touchpoints at this stage drive 10-15% more revenue than generic messaging, so segment your content by buyer role and awareness level. Understanding the sales cycle from the customer's perspective helps you serve the right content at the right moment instead of defaulting to generic nurture blasts.
Conversion
The decision moment. In B2B, this often involves multiple stakeholders, procurement reviews, and security questionnaires. In B2C, it might be a single click.
Either way, friction kills conversions. Reduce form fields, offer clear pricing, and provide social proof that scales with the price point. High-ticket offers need stronger proof than testimonials alone - think ROI calculators and named case studies.
Retention
Most funnels stop at conversion. That's a mistake. Onboarding quality, product adoption, and customer success touchpoints determine whether someone stays. The mindset here is "did I make the right choice?" Your job is to deliver value fast and reduce buyer's remorse. Activation metrics - time to first value, feature adoption rates - are your early warning system.
Advocacy
Happy customers become your cheapest acquisition channel. Referrals, reviews, case studies, and community participation all compound over time. This is where the funnel connects back to awareness for new buyers. The flywheel effect kicks in when you systematically ask for and incentivize advocacy - not as an afterthought, but as a designed stage with its own KPIs.
Funnel Benchmarks by Industry
Numbers are what separate a real funnel strategy from a whiteboard exercise. Here are stage-by-stage conversion benchmarks across three industries, plus channel-level data that shows how dramatically source quality affects conversion.
Stage-by-Stage Conversion Benchmarks
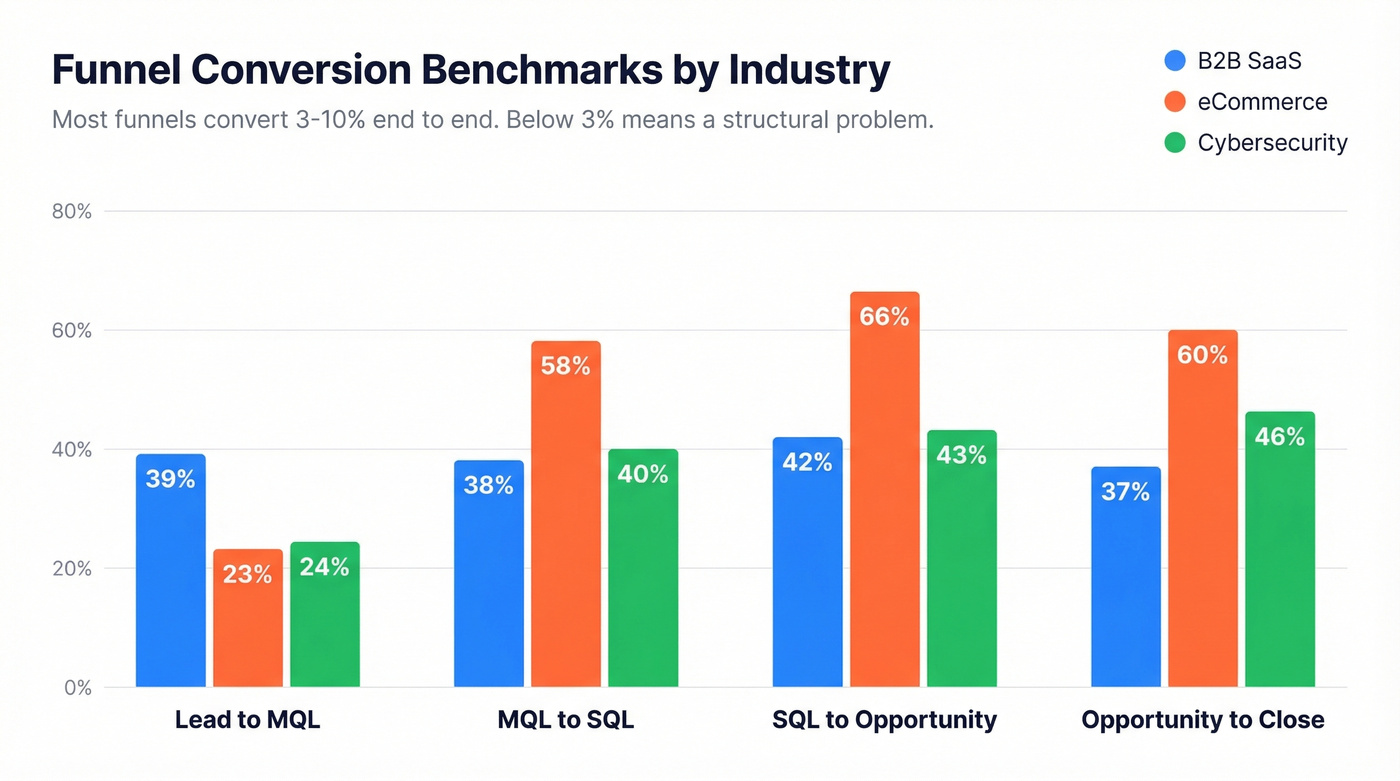
| Industry | Lead → MQL | MQL → SQL | SQL → Opp | Opp → Close |
|---|---|---|---|---|
| B2B SaaS | 39% | 38% | 42% | 37% |
| eCommerce | 23% | 58% | 66% | 60% |
| Cybersecurity | 24% | 40% | 43% | 46% |
Notice the pattern: eCommerce has lower top-of-funnel conversion but much higher close rates because the qualification bar is lower - if someone's browsing products, intent is already high. B2B SaaS often feels the MQL-to-SQL handoff most painfully, which is exactly where many B2B teams report their "leads but no conversions" problem. VWO reports slightly different ranges (Lead→MQL 25-35%, MQL→SQL 13-26%), which reflects how much benchmarks vary by methodology. Use these as directional guides, not gospel.
Channel Benchmarks (B2B SaaS)
| Channel | Visitor → Lead | MQL → SQL | Opp → Close |
|---|---|---|---|
| SEO | 2.1% | 51% | 38% |
| PPC | 0.7% | 26% | 35% |
| Events | 1.0% | 24% | 40% |
SEO leads convert to SQL at nearly double the rate of PPC leads. That's not because SEO is magic - it's because organic searchers are further along in their buying journey. Events have the highest close rate, which makes sense: face-to-face interaction builds trust faster than any digital channel.
Overall, most funnels convert between 3% and 10% end-to-end. Below 3%, you've got a structural problem. Above 10%, you're either in a niche market or not casting a wide enough net at the top.
Pipeline Velocity
This is the most underused B2B metric. The formula:
(Opportunities x Avg Deal Value x Win Rate) / Sales Cycle Length
Worked example for a mid-market SaaS company: 50 opportunities x $26,265 median deal x 25% win rate / 84-day median cycle = $3,908/day in pipeline velocity. Track this monthly. If velocity drops, you can diagnose whether it's a volume problem (fewer opportunities), a value problem (smaller deals), a quality problem (lower win rate), or a speed problem (longer cycles).
B2B vs. B2C Funnel Differences
The same five-stage framework applies to both, but the dynamics are fundamentally different. Here's how they compare, based on Factors.ai's breakdown:
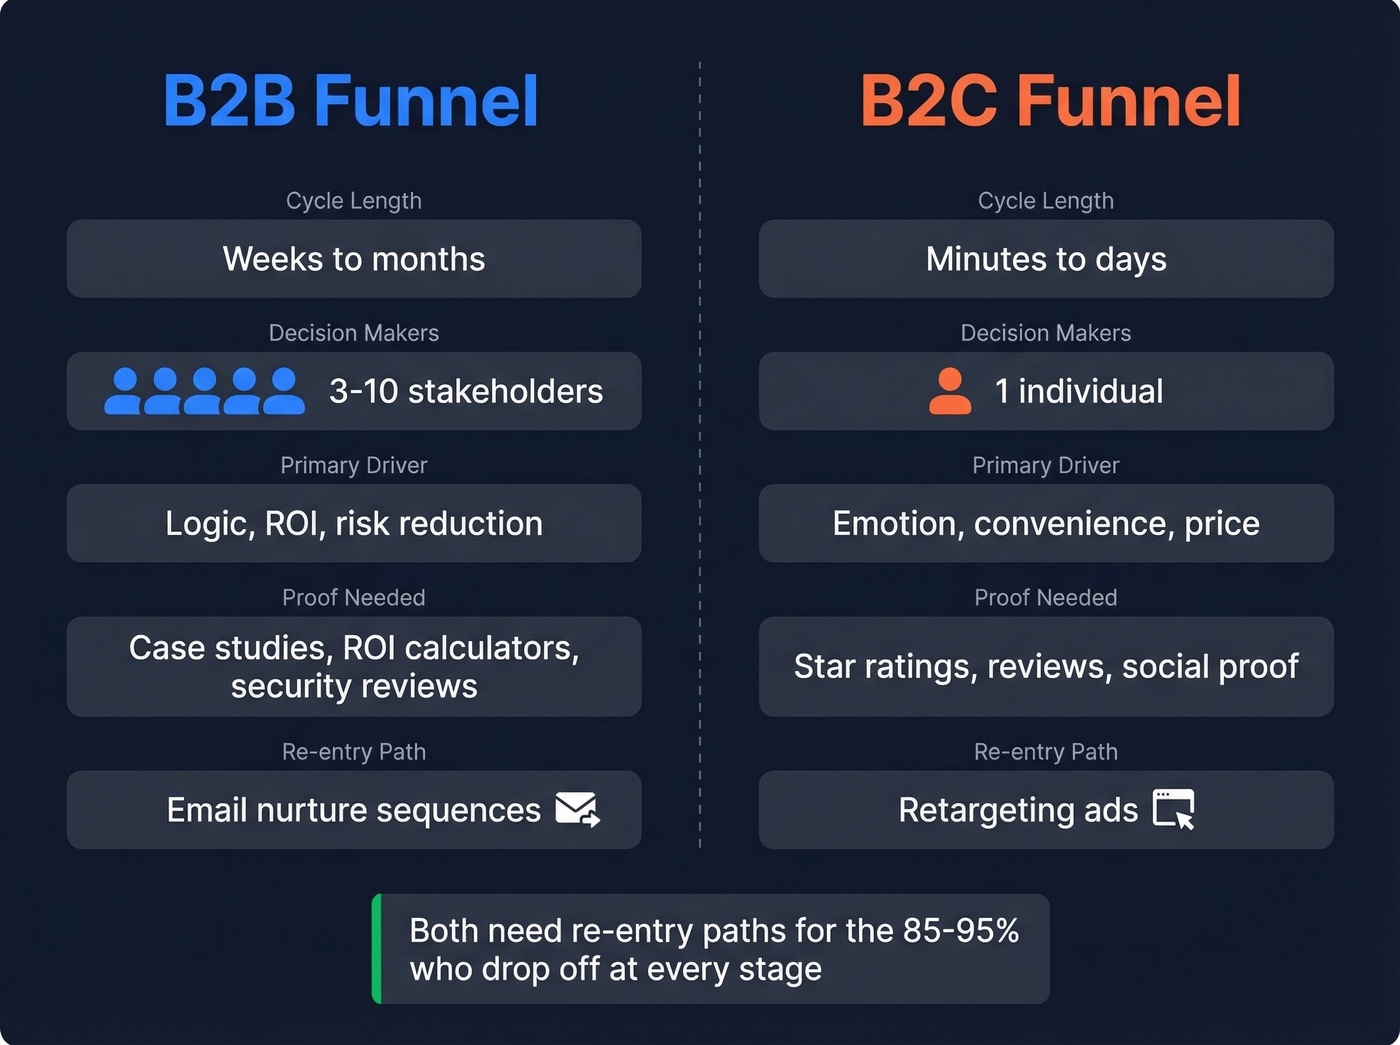
| Dimension | B2B | B2C |
|---|---|---|
| Typical stages | 6 (incl. evaluation) | 4 (AIDA-style) |
| Cycle length | Weeks to months | Minutes to days |
| Decision-makers | 3-10 stakeholders | Individual |
| Primary driver | Logic, ROI, risk | Emotion, convenience |
| Proof required | Case studies, ROI data | Reviews, ratings |
B2B funnels are longer and messier. A single deal might involve a champion, an economic buyer, a technical evaluator, and procurement - each with different concerns at different stages. B2C funnels are shorter but higher volume, which means small conversion rate improvements compound fast. Expect conversion rates to drop as you scale to colder audiences - a funnel converting at 15% with warm traffic can easily fall to 5% when you broaden targeting. That's normal, not broken.
The practical implication: B2B teams need stage-specific content for each stakeholder role. B2C teams need to reduce friction at every step, because the buyer won't wait. Both need re-entry paths, but B2B re-entry is usually email-driven while B2C leans on retargeting ads.
In either case, designing every touchpoint around what the buyer needs to feel confident - not what your sales team needs to hit quota - is what separates high-performing funnels from decorative ones.
B2B buyers need 7-13 touchpoints before purchasing. Every bounced email is a wasted touchpoint. Prospeo's 98% email accuracy and 7-day data refresh mean your consideration-stage nurture sequences actually land - not bounce.
Stop losing funnel conversions to bad data. Start with verified contacts.
How to Build Your Funnel
The most common question on r/AskMarketing isn't "what is a customer journey funnel?" It's "where do I even start?"
Define Stages and Entry Points
Start with the five stages above. Then identify where people actually enter your funnel. Not everyone starts at awareness - some prospects land mid-funnel via a referral or a competitor comparison search. Two leads in the same stage who arrived via completely different paths need different messaging, even if they're sitting in the same CRM bucket. Map each entry point so you know what content to serve.
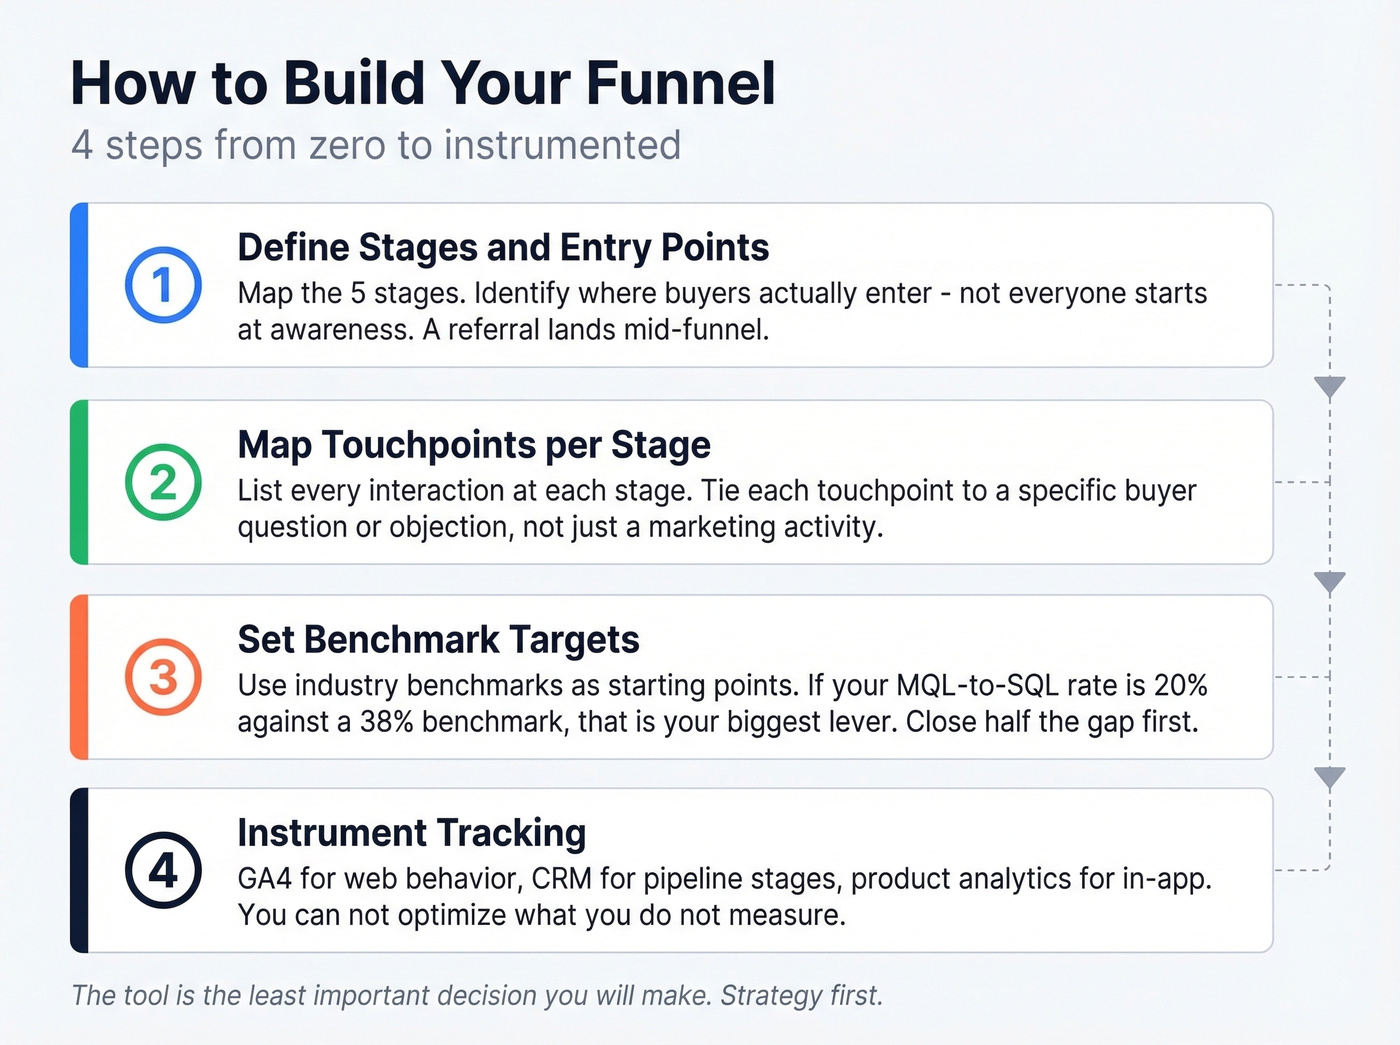
Map Touchpoints per Stage
List every interaction a buyer has at each stage. For a B2B SaaS company, awareness might include blog posts, podcast mentions, and paid social. Consideration might include demo requests, pricing page visits, and G2 reviews. Be exhaustive - you can't optimize what you haven't mapped. Tie each touchpoint to a specific buyer question or objection, not just a marketing activity.
Set Benchmark Targets
Use the industry benchmarks above as starting points. If you're a B2B SaaS company and your MQL-to-SQL rate is 20% against a 38% benchmark, that's your biggest lever. Set realistic targets: aim to close half the gap in the first quarter, not all of it.
Instrument Tracking
GA4 handles web behavior - set up Funnel Exploration reports for each stage transition. Your CRM (HubSpot, Salesforce) tracks pipeline stages. Product analytics tools like Mixpanel or Amplitude cover in-app behavior. The goal is one dashboard that shows stage-to-stage conversion in real time.
Verify Your Contact Data
Before you launch nurture sequences, verify your contact list. We've seen teams pour budget into email nurture campaigns only to discover 30%+ of their list was dead addresses - which tanks deliverability and corrupts every downstream metric. Prospeo catches invalid emails before they do damage, with 98% accuracy on a 7-day refresh cycle.
Build Re-Entry Paths for Drop-Offs
This is the step most teams skip, and it's the one that matters most. For every stage transition, design a path for the people who don't convert. Someone who visits your pricing page but doesn't request a demo? Retarget them with a case study ad. Someone who downloads a whitepaper but goes cold? Put them in a 5-email nurture sequence.
Segment drop-offs by awareness level: someone who's problem-aware - they know the pain but haven't explored solutions - needs different messaging than someone who's solution-aware and already comparing vendors. The 85-95% who drop off at each stage aren't lost. They're just not ready yet.
Review and Iterate Monthly
Pull your stage-to-stage conversion data monthly. Compare against benchmarks. Identify the biggest gap and focus your next sprint there. Don't try to optimize every stage simultaneously - pick the leakiest one and fix it first.
KPIs for Every Funnel Stage
Every stage needs its own metrics. Here's the full framework with formulas and benchmark ranges:
| Stage | Key Metrics | Benchmark Range |
|---|---|---|
| Awareness | Traffic, impressions, bounce rate | Bounce: 26-40% |
| Consideration | Lead gen rate, engagement rate | Lead→MQL: 25-39% |
| Conversion | CVR, CAC, CPC | Overall: 3-10% |
| Retention | Churn rate, CLV, NPS | NPS: 30+ is good |
| Advocacy | Referral rate, review volume | Track monthly trend |
A common KPI target is site load speed under 2 seconds for awareness-stage pages. Anything slower and your bounce rate climbs before the funnel even starts.
Quick-Reference Formulas
- CTR: (Clicks / Impressions) x 100
- CVR: (Conversions / Visitors) x 100
- NPS: % Promoters - % Detractors
- CAC: Total Sales & Marketing Spend / New Customers Acquired
- CLV: Average Purchase Value x Purchase Frequency x Customer Lifespan
- Pipeline Velocity: (Opportunities x Deal Value x Win Rate) / Cycle Length
The mistake we see repeatedly: teams track top-of-funnel vanity metrics (impressions, traffic) and bottom-of-funnel revenue, but nothing in between. Stage-level KPIs are what let you diagnose problems before they hit the P&L.
Segment, Then Optimize
One funnel for all traffic is a blunt instrument. Build separate funnel views by acquisition source, persona, or product line - a lead from an organic case study and a lead from a cold paid ad will convert at wildly different rates, and blending them hides the signal. Once you have segmented funnels, the next-level move is using analytics tools to forecast which segments are likely to convert and where to allocate budget. Stop reacting to last month's data and start anticipating next month's drop-offs.
5 Common Funnel Mistakes
Treating the Funnel as Linear
Real buyers don't move neatly from stage 1 to stage 5. They research, go dark for three weeks, come back via a retargeting ad, read a case study, and then ask a colleague for a recommendation. Design your funnel with re-entry loops at every stage. If your only path is forward, you're losing the majority of potential buyers who need a second or third pass.
Obsessing Over Tools
A common refrain on r/PPC: teams spend weeks evaluating ClickFunnels vs. GoHighLevel vs. WordPress when they haven't even defined their stages or set conversion targets. The tool is a container. The strategy is what goes inside it. Pick a tool in a day. Spend a week on your stage definitions and benchmarks.
Stopping at Conversion
If your funnel ends at "closed-won," you're leaving money on the table. Retention and advocacy are where compounding growth happens. We've seen teams double their effective LTV just by adding a structured onboarding sequence and a 90-day check-in cadence. The funnel doesn't end at the sale - it loops back to awareness through referrals and reviews.
Optimizing in Data Silos
86% of companies with multiple CX tools report siloed data. Your ad platform says one thing, your CRM says another, and your product analytics tool tells a third story. Fragmented data means you optimize channels, not journeys. Unify your data into a single view - even if it's just a weekly export into a shared dashboard - before you start making optimization decisions.
Feeding Bad Data Into a Good Funnel
This is the invisible leak. If 30%+ of your emails bounce, every metric from consideration onward is fiction. Your open rates, click rates, and nurture-to-SQL conversion are all inflated by a denominator that includes people who never received your message. Meritt cut their bounce rate from 35% to under 4% and tripled pipeline after switching to verified contact data. If your bounce rate exceeds 5%, fix the data before you touch anything else.
Tools for Funnel Analysis
You don't need to buy into the $24.65B customer journey analytics market to analyze your funnel. You need three layers: quantitative tracking, qualitative insight, and data quality.
GA4 is the starting point for quantitative analysis - it's free, and Funnel Exploration reports show stage-to-stage drop-off clearly. For product analytics, Mixpanel and Amplitude go deeper into in-app behavior, cohort analysis, and retention curves. On the qualitative side, Hotjar gives you session recordings and heatmaps, while Contentsquare and FullStory handle enterprise-grade UX diagnosis.
| Tool | Category | Starting Price | Best For |
|---|---|---|---|
| GA4 | Web analytics | Free | Stage drop-off analysis |
| Mixpanel | Product analytics | $20/mo | In-app funnels |
| Amplitude | Product analytics | Free tier | Retention cohorts |
| Hotjar | Session replay | $32/mo | UX diagnosis |
| Contentsquare | Session replay | Custom | Enterprise UX |
| HubSpot CRM | Pipeline tracking | Free | B2B pipeline stages |
| Prospeo | Data quality | Free (75 verified emails/mo) | Contact verification |
| Miro | Journey mapping | ~$8/user/mo | Collaborative mapping |
Skip Contentsquare unless you're running an enterprise operation with dedicated UX analysts - for most teams, Hotjar gives you 90% of the insight at a fraction of the cost.
Your MQL-to-SQL conversion rate tanks when reps chase outdated contacts. Prospeo gives you 300M+ profiles with 30+ filters - buyer intent, job changes, headcount growth - so every stage of your funnel targets real, in-market buyers.
Hit your stage-to-stage benchmarks with data refreshed every 7 days.
Beyond the Funnel - Flywheels and Influence Maps
The funnel model has a structural flaw: it treats customers as output. They enter at the top, exit at the bottom, and you start over. The flywheel model - Attract, Engage, Delight - positions customers as the growth engine. Happy customers generate referrals, reviews, and case studies that attract new buyers, creating a self-reinforcing loop.
BCG's 2025 research goes further, arguing for "influence maps" that replace the linear funnel entirely. Their framework identifies four behaviors - streaming, scrolling, searching, shopping - that happen across the entire journey, not in neat sequential stages.
Let's be honest about what works in practice: use both. The funnel gives you a measurement framework - stage-to-stage conversion rates, pipeline velocity, KPIs you can actually track. The flywheel gives you a growth philosophy - invest in post-purchase experience because it compounds. Measure like a funnel, invest like a flywheel. That's the most practical model for 2026.
Hot take: If your average deal size is under $15K, you probably don't need a sophisticated multi-touch attribution model. A well-instrumented five-stage customer journey funnel with monthly reviews will outperform a $200K analytics stack that nobody actually uses. Complexity is not a strategy.
Real-World Examples
Theory is useful. Proof is better. Here are three companies that made specific funnel changes and measured the results, drawn from Amplitude's case study collection:
8x8 (Jitsi.org) identified that a key feature was buried in the product. By promoting it more prominently during onboarding, Day 7 retention doubled. That's a retention-stage fix - no new traffic required, just better activation.
MINDBODY found that users who engaged with the "Activity Dashboard" booked 24% more classes per week. But the real win was adding a "Book It Again" button - conversions through that path were 4.5x higher than other browsing paths. A single UX change at the conversion stage moved the entire funnel.
Rappi tested a low-cost trial against a free trial and found that users who paid a small amount were 25% more likely to convert to full membership. They also introduced a free shipping threshold that increased average order size by 15%. Smart friction - adding a small barrier - actually improved outcomes. Not every optimization is about removing steps.
FAQ
What's the Difference Between a Marketing Funnel and a Customer Journey?
A marketing funnel focuses on conversion stages from awareness to purchase. A customer journey maps the full experience, including post-purchase retention and advocacy. Modern customer journey funnels merge both, extending past the sale to capture lifetime value and referral loops. The distinction matters less than ensuring your model doesn't stop at "closed-won."
How Many Stages Should a Funnel Have?
Five is the consensus: Awareness, Consideration, Conversion, Retention, Advocacy. B2B teams sometimes add a sixth, splitting consideration into "interest" and "evaluation." Fewer stages are easier to measure and act on - start with five and add granularity once you have baseline data.
What's a Good End-to-End Conversion Rate?
Overall, 3-10% is the typical range across industries. Stage-level rates matter more: Lead-to-MQL runs 25-39%, MQL-to-SQL runs 13-38% depending on industry and channel. Below 3% overall, diagnose stage by stage - the bottleneck is usually one specific transition, not spread evenly.
How Do I Fix a Leaky Funnel?
Start with the widest gap between your numbers and industry benchmarks. Most leaks occur at MQL-to-SQL (qualification criteria too loose or too tight) or from bad contact data corrupting everything downstream. If 30%+ of emails bounce, every downstream metric is fiction - fix the data first, then fix the stage with the biggest benchmark gap.
What Does a Buyer-Centric Funnel Look Like in Practice?
It starts with mapping every question, objection, and decision point your prospect faces - then aligning content, outreach, and follow-up to those moments rather than your internal pipeline stages. Consideration-stage emails address the buyer's evaluation criteria (not your feature list), demos are customized to the prospect's use case, and re-entry sequences acknowledge where the buyer left off instead of restarting from scratch.