Customer Scoring: How to Build Models Teams Actually Use
A founder we know built an elaborate scoring model in HubSpot. Whitepaper download: +15 points. Pricing page visit: +25. The "perfect prospect" hit 100. His biggest deal - $20K ARR - came from a lead that scored 12 out of 100. That lead booked a demo from a cold message, never opened an email, never downloaded anything. Meanwhile, the 89-point "hot lead" turned out to be a grad student writing a thesis.
Scoring measures activity. It doesn't measure outcomes.
The business case for getting this right is enormous. Companies that lead in customer experience generated returns 260 points above the S&P 500 over 16 years - 5.4x the returns of CX laggards. Teams using AI-driven scoring see 15-20% revenue uplift on average, with conversion rates climbing 25%. This isn't a nice-to-have. It's the infrastructure that separates companies who retain and expand from companies who churn and wonder why.
The Short Version
Customer scoring isn't one model - it's five common score families: value, health, churn risk, credit, and account. Pick the one tied to your biggest revenue lever. Start with fewer than 10 signals, tie every signal to an outcome like renewal, expansion, or churn, and automate playbooks so the score triggers action - not just a dashboard number. If you're building only one score first, make it a customer health score tied to renewal risk for post-sale teams, or an RFM/RFE score for transactional or usage-based businesses.
What Is Customer Scoring?
Customer scoring is the practice of assigning a numeric value to each customer based on criteria that matter to a specific business decision - renewal likelihood, lifetime value, credit risk, churn probability, or account fit. It's the umbrella, not any single model underneath it.
Here's the thing: it's not just lead scoring, and it's not just NPS. Lead scoring lives in marketing automation and stops at the handoff to sales. Customer scoring picks up where lead scoring ends, incorporating product usage, support history, payment behavior, and engagement data that marketing tools never see. NPS is one input to a score, not a score itself. We've watched teams try to boil everything into one number and abandon the project within a quarter.
The Five Score Types
Stop trying to produce one universal number. That's why teams abandon the project. Build two or three scores by job-to-be-done instead.
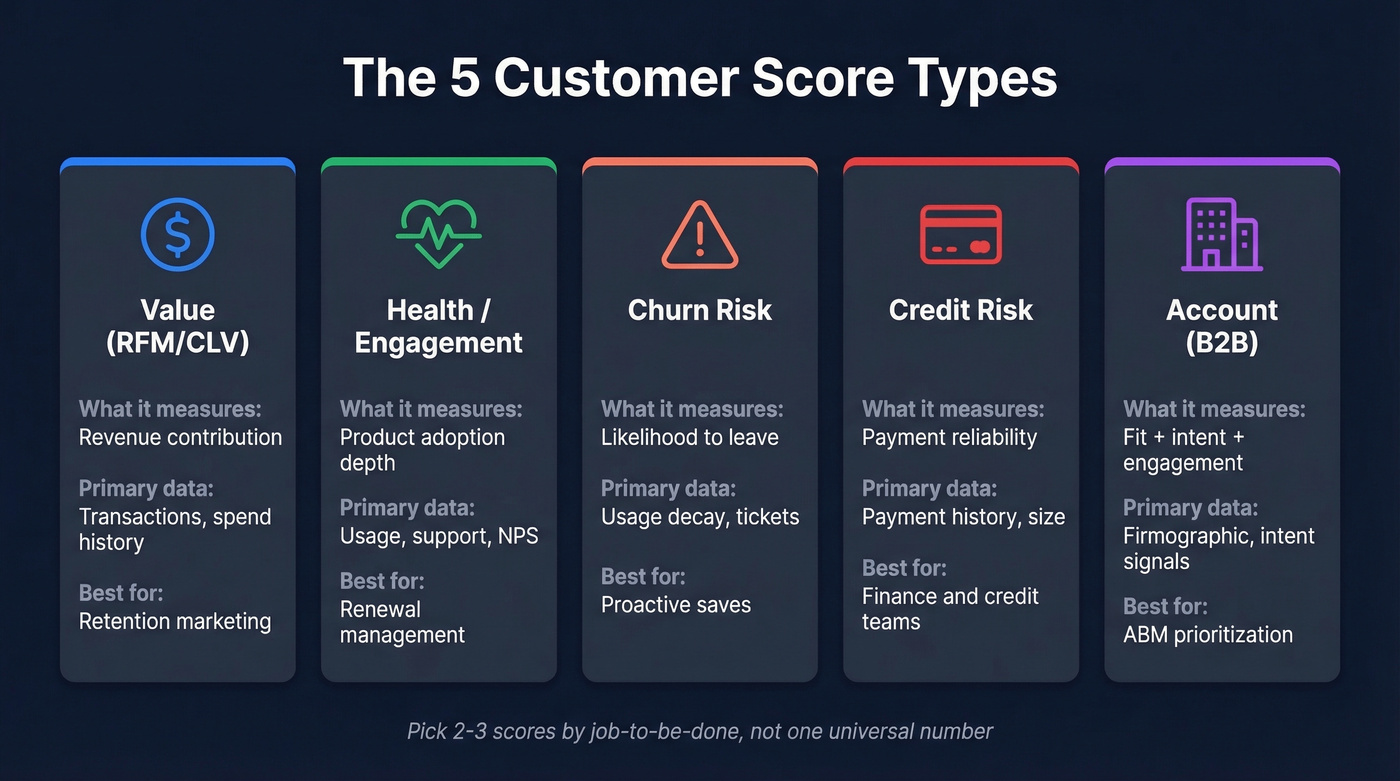
| Score Type | What It Measures | Primary Data | Best For |
|---|---|---|---|
| Value (RFM/CLV) | Revenue contribution | Transactions, spend | Retention marketing |
| Health/Engagement | Product adoption | Usage, support, NPS | Renewal management |
| Churn Risk | Likelihood to leave | Usage decay, tickets | Proactive saves |
| Credit Risk | Payment reliability | Payment history, size | Finance/credit teams |
| Account (B2B) | Fit + intent + engagement | Firmographic, intent | ABM prioritization |
Value scoring ranks customers by what they've spent and how recently - the workhorse for e-commerce and transactional businesses. Health scoring tracks whether customers are actually using your product in ways that predict renewal, not just logging in but engaging with differentiating features.
Churn risk is health scoring's inverse, often powered by the same signals but weighted toward decay patterns and support escalations. Credit risk scoring lives in finance departments, combining payment history, company size, and sector health to decide credit terms - a different world from marketing scores, but still under the same umbrella.
Account scoring is the B2B play, combining ICP fit, intent signals, and buying committee engagement to rank target accounts. B2B deals involve 6-10 stakeholders on average, which makes individual lead scoring brittle. Account-level scoring catches committee-wide signals that lead scoring misses entirely.
How to Build a Scoring Model
1. Define the outcome you're predicting. Renewal? Expansion? Churn within 90 days? If you can't state the outcome in one sentence, the model won't work.
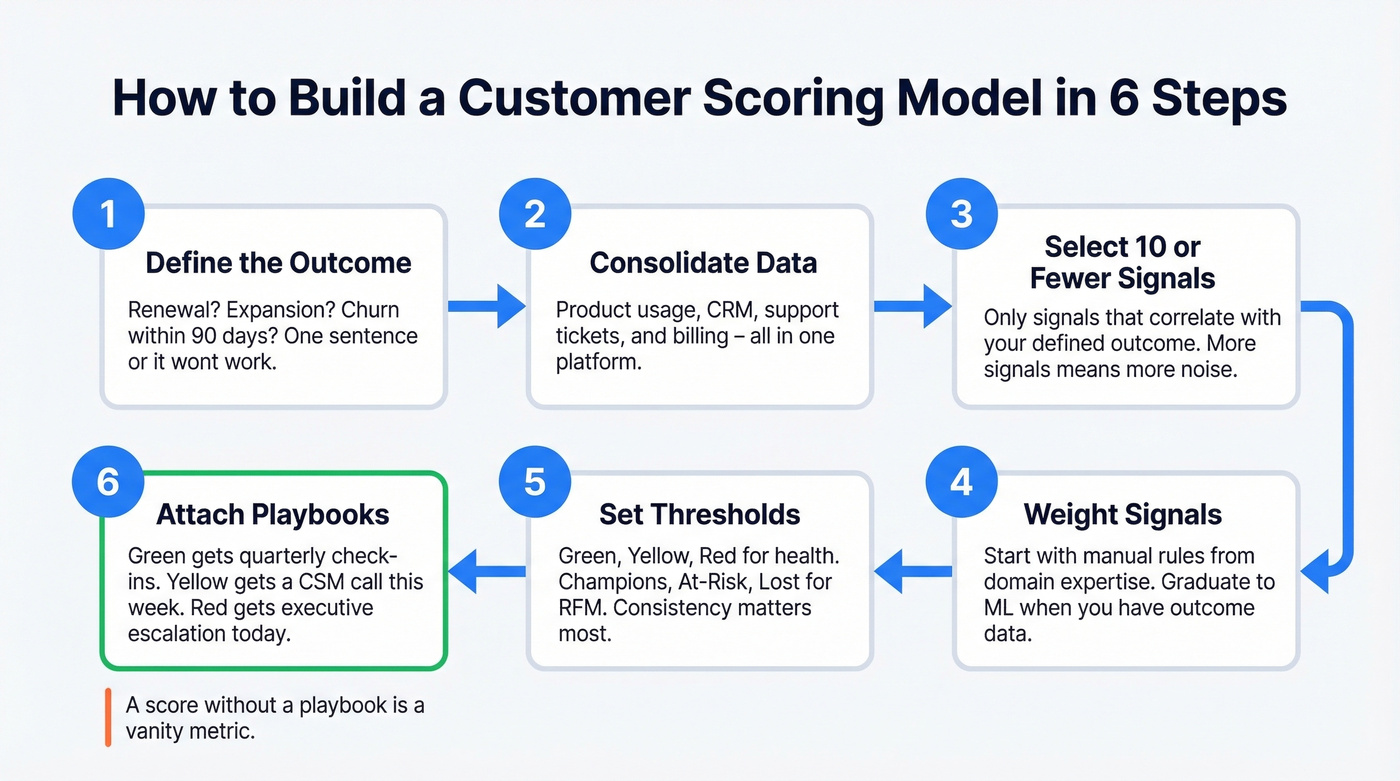
2. Consolidate data into one platform. Product usage, CRM records, support tickets, and billing data need to live in the same place. Fragmented data is the top reason health scores get ignored.
3. Select 10 or fewer signals tied to that outcome. More signals doesn't mean more accuracy - it means more noise. Pick the ones that actually correlate with the outcome you defined in step one.
4. Weight signals using rules or ML. Start with manual weights based on domain expertise. Graduate to logistic regression or random forest models once you have enough outcome data to validate against. One note on tooling: scoring features in major CRMs and marketing platforms often sit behind Pro/Enterprise tiers, and it's common to see per-seat pricing in the $100-$200/user/month range for advanced packages.
5. Set thresholds and segment. Green/Yellow/Red for health scores. Champions/At-Risk/Hibernating for RFM. The labels matter less than consistency.
6. Attach playbooks and alerts to each segment. A score that doesn't trigger a playbook is a vanity metric. Green accounts get quarterly check-ins. Yellow gets a CSM call this week. Red gets an executive escalation today.
If you can't explain the score in one minute, sales and CS won't trust it.
Account scoring falls apart when firmographic data is stale and contact info bounces. Prospeo's 300M+ profiles refresh every 7 days - not every 6 weeks - so your ICP fit, intent signals, and engagement data actually reflect reality. 98% email accuracy means your scores drive action, not dead ends.
Stop scoring leads you can't actually reach.
Worked Example: RFM Value Scoring
RFM stands for Recency, Frequency, Monetary. You need 6-12 months of transaction data with three fields: customer ID, transaction date, and transaction amount. Here's a synthetic example with five customers scored on quintiles from 1 to 5, where 5 is best.
Raw Transaction Data
| Customer | Days Since Last Purchase | Orders (12mo) | Total Spend |
|---|---|---|---|
| Acme Corp | 8 | 24 | $48,000 |
| Beta LLC | 15 | 18 | $31,000 |
| Gamma Inc | 62 | 6 | $12,000 |
| Delta Co | 140 | 3 | $5,200 |
| Epsilon Ltd | 310 | 1 | $800 |
RFM Scores and Segments
| Customer | R | F | M | RFM Code | Segment |
|---|---|---|---|---|---|
| Acme Corp | 5 | 5 | 5 | 555 | Champion |
| Beta LLC | 5 | 4 | 4 | 544 | Loyal |
| Gamma Inc | 3 | 3 | 3 | 333 | Needs Attention |
| Delta Co | 2 | 2 | 2 | 222 | At Risk |
| Epsilon Ltd | 1 | 1 | 1 | 111 | Lost |
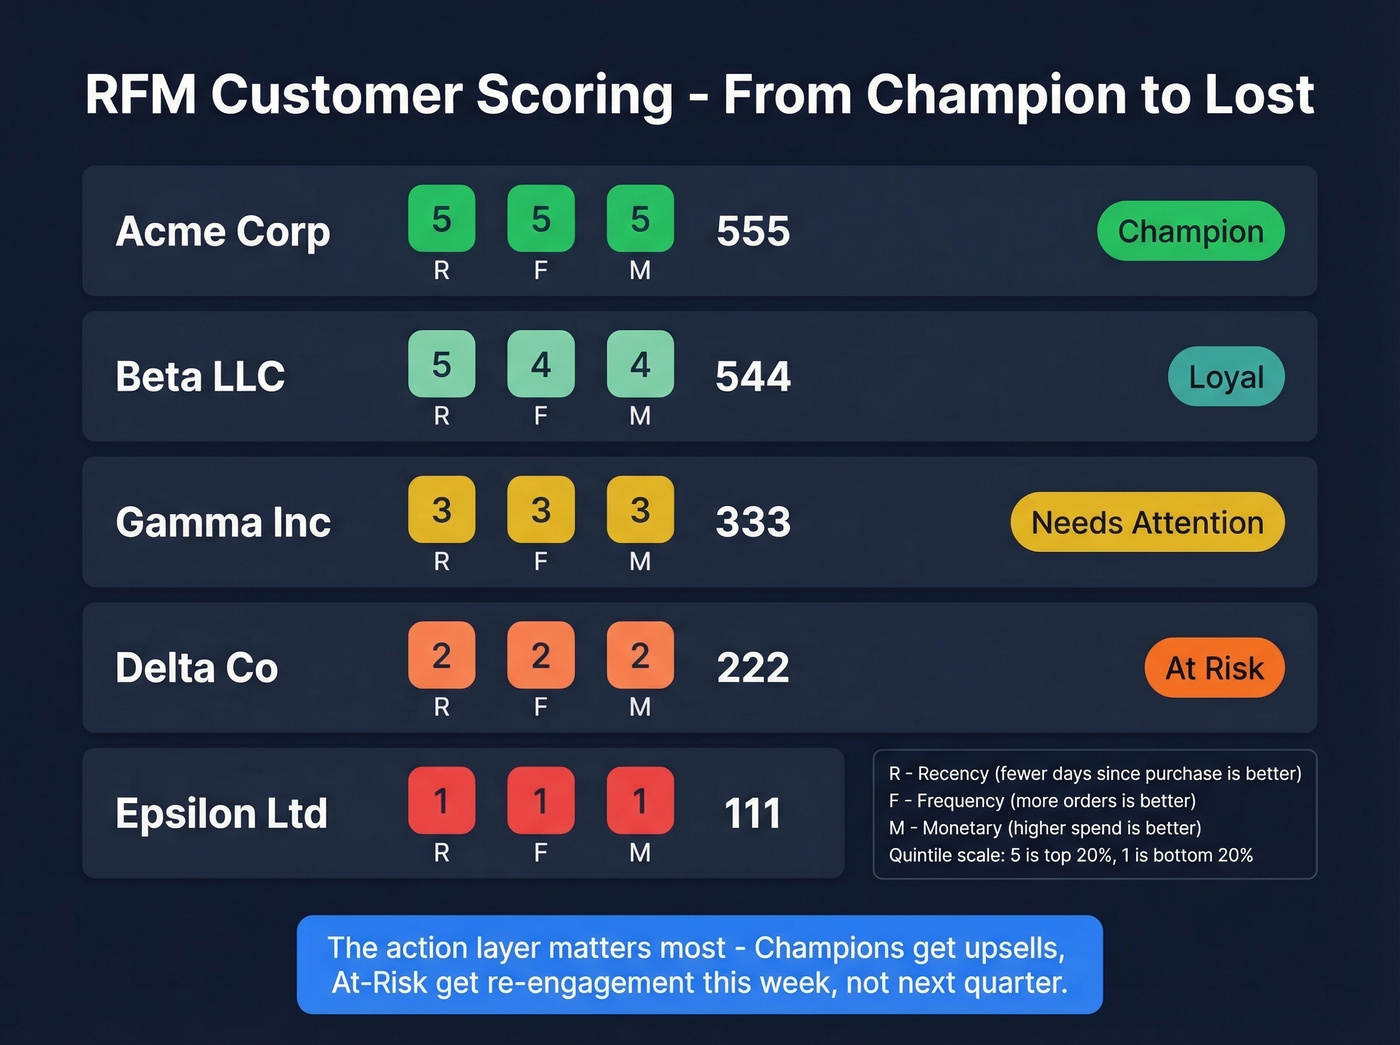
Recency is scored inversely - fewer days since last purchase gets a 5. Frequency and Monetary are scored directly - higher is better. Each metric is split into quintiles across your full customer base, so the top 20% gets a 5 and the bottom 20% gets a 1.
The action layer is what matters. Champions get early access and upsell offers. At-Risk customers get a re-engagement sequence this week, not next quarter. Increasing retention by 5% increases profits 25-95% - the math on saving even a few At-Risk accounts is hard to argue with.
For SaaS companies where transaction value isn't the best signal, swap Monetary for Engagement to create an RFE model. Engagement metrics like feature adoption depth, session duration, and key workflow completions replace spend data. The scoring mechanics stay identical.
Worked Example: Health Score
Most health score tutorials show you the formula and skip the part where it breaks. Let's start with the break.
The classic impact x frequency method asks you to pick activities, assign an impact value from 1 to 10, record frequency over a time window, and multiply. Sounds reasonable until you see the output:
| Activity | Impact (1-10) | Frequency | Score |
|---|---|---|---|
| Subscription Renewal | 10 | 10 | 100 |
| Unresolved Tickets | 5 | 4 | 20 |
| Active Users | 9 | 500 | 4,500 |
See the problem? Active Users dominates the total so completely that renewal status and support tickets become irrelevant noise. A customer with 500 active users and 40 unresolved tickets looks healthier than a customer with 50 active users and zero tickets. In our experience, this is where about half of first-attempt health scores die - the team sees nonsensical rankings and loses faith in the whole project.
Normalization Fixes Everything
Scale each raw total to a 0-100 range within its own distribution, then apply percentage weights that reflect business priority. If renewal behavior matters most, give it 40% weight. Usage gets 35%. Support health gets 25%. Now the score reflects your actual priorities, not whichever metric has the biggest raw numbers.
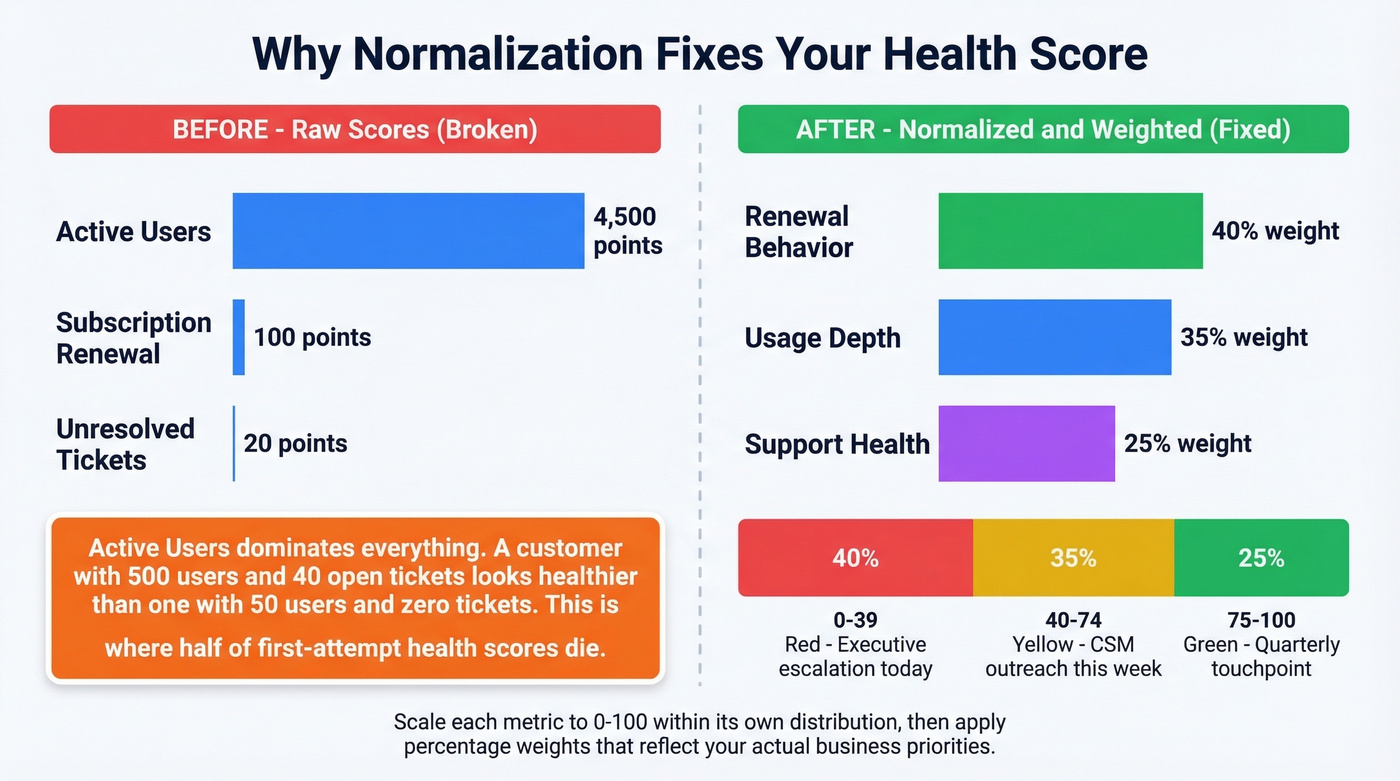
Once you have normalized scores, set thresholds. Green (75-100) means the account is healthy - quarterly touchpoint. Yellow (40-74) means something's slipping - CSM outreach within the week. Red (0-39) means churn risk is real - executive escalation and a save plan.
Playbooks only work when the contact data is fresh. If your CSM's "urgent save call" goes to a VP who left six months ago, the score was right but the execution failed. Tools like Prospeo, with 98% email accuracy and a 7-day refresh cycle, close that gap - stale contacts are the silent killer of score-triggered outreach.
If 30% of your score is manual CSM notes, you don't have a model. You have opinions in a spreadsheet. Automate or cut.
Mistakes That Kill Scoring Models
Too much manual input. When more than 25% of your health measures require a human to log something, the model won't scale. We've seen the breakdown happen even earlier - around 15%. CSMs fill it in for their top accounts and ignore the rest. Automate the data collection or cut the signal.
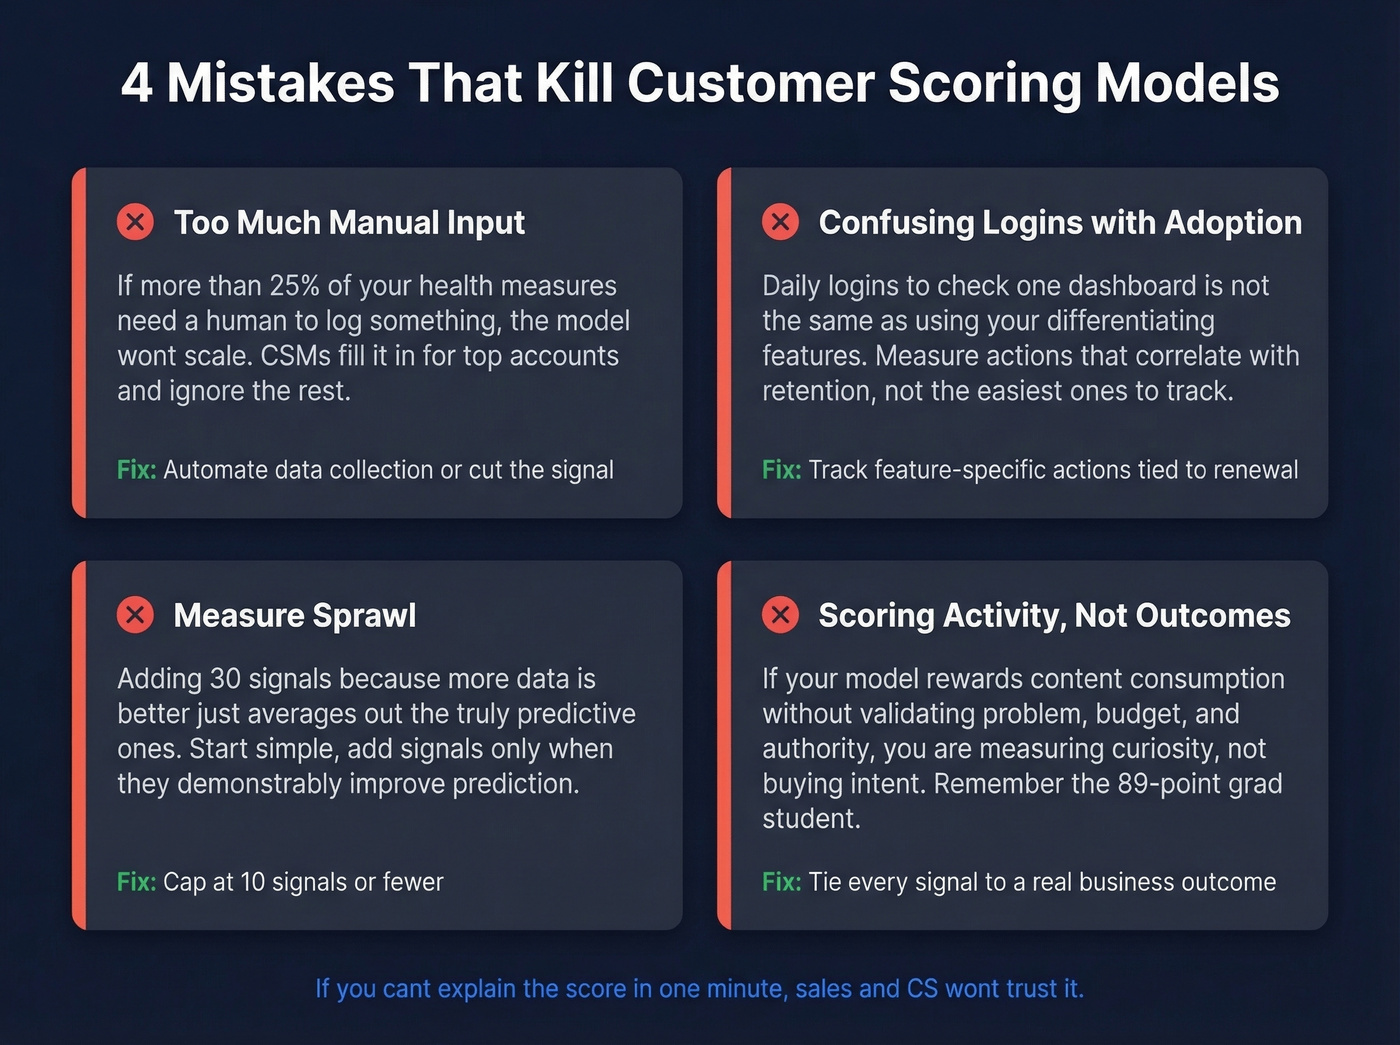
Confusing logins with adoption. Healthy login rates don't equal healthy usage. A customer logging in daily to check one dashboard isn't the same as a customer using your differentiating features. Measure the actions that correlate with retention, not the ones that are easiest to track.
Measure sprawl. Adding 30 signals because "more data is better" averages out the truly predictive ones. The consensus on r/CustomerSuccess is blunt: "Start simple, add signals only when they demonstrably improve prediction." Dozens of failed over-engineered models back that up.
Scoring activity, not outcomes. The 89-point student from our opening story tells you everything. If your model rewards content consumption without validating problem, budget, and authority, you're measuring curiosity - not buying intent.
No validation loop. A score that never gets tested against actual renewals or churn events is a guess that calcifies into gospel. Skip this if you want to build dashboards nobody trusts.
How to Validate Your Model
Backtesting is the minimum. Take your current scoring model, apply it to last year's cohort, and compare predicted outcomes to actual outcomes. Did high-score customers actually renew at higher rates? Did low-score accounts actually churn? If the answer is "sort of," your weights need adjustment.
Lift analysis goes further. Compare conversion or renewal rates for accounts your team acted on versus a holdout group. If the score-triggered playbook didn't produce measurably better outcomes than doing nothing, the score isn't driving value - it's generating dashboards.
One published propensity-modeling case study cites Alphonso improving prediction accuracy from 8% to 80%. That's the kind of lift that justifies the investment.
For ML-based scoring, target an AUC of 0.70-0.85 for well-instrumented SaaS churn models. Below 0.70, the model isn't meaningfully better than random. Above 0.85, double-check for data leakage - it's more common than you'd think, especially when billing status sneaks into the feature set.
We've seen teams build a beautiful model in Q1 and wonder why it's useless by Q4. Scores decay as customer behavior shifts, market conditions change, and your product evolves. Refresh weights quarterly. Revalidate against outcomes every six months at minimum.
Real talk: ML works best as a prioritization signal with guardrails, not as an autonomous decision engine. The teams that get burned are the ones that hand scoring to a model and stop asking whether the outputs make sense.
You just defined your segments - Champions, At-Risk, Lost. Now you need verified contact data to execute the playbooks. Prospeo layers buyer intent across 15,000 topics with 30+ filters so your account scores feed directly into outreach that connects. At $0.01 per email, scaling your scoring model doesn't scale your costs.
Turn every customer segment into a triggered, data-backed playbook.
Customer Scoring FAQ
What is customer scoring, and how does it differ from lead scoring?
Lead scoring ranks prospects before they buy using marketing signals like email opens and form fills. Customer scoring is the post-sale umbrella - health scores, value scores, churn risk, and account scores that incorporate product usage, support data, and payment behavior. Marketing automation tools rarely access real-time product or support data, which is why lead scoring alone can't predict retention.
How often should you refresh scores?
Product usage signals should refresh weekly; transactional RFM scores work on a monthly cadence. Run a full recalibration - revalidating weights against actual outcomes - at least quarterly. A model accurate in January can mislead by June if behavior patterns shift and weights stay frozen.
What tools do you need to get started?
A CRM, product analytics, and a scoring layer. A spreadsheet works for your first model - don't let tooling be the blocker. At scale, CS platforms like Gainsight or ChurnZero handle automation and playbooks, typically $200-$500/mo for SMB teams. For score-triggered outreach, verified contact data is non-negotiable - bounced emails mean your Red-account save plan never reaches anyone.
Can small teams build this without ML?
Yes. Manual rule-based scoring with 5-8 weighted signals outperforms no scoring at all. Most teams under 500 customers should start with a spreadsheet model, validate it for two quarters, then graduate to ML only when they have enough outcome data to train against. Complexity without data volume produces worse results than simple heuristics.