Data Cleaning: What It Actually Takes to Fix Your Data
Poor data quality costs the average organization $12.9M per year. That's not a typo, and it's not just a big-company problem. Whether you're a data scientist staring at a messy CSV or a RevOps lead watching your CRM fill up with duplicates, data cleaning starts the same way: a disciplined process you can repeat. Here's the one that actually works - with code, tools, pricing, and the mistakes that'll wreck your analysis if you skip them.
What You Need (Quick Version)
If you've got a messy dataset open right now, here's the short version. Profile your data before you start deleting rows - you need to understand what's broken before you fix it. Use pandas if you code, OpenRefine if you don't. The 7-step process below works for any dataset, from a 500-row spreadsheet to a 50M-record warehouse table.
Data Cleaning Definition
Data cleaning (also called data cleansing or data scrubbing) is the process of detecting and correcting errors, inconsistencies, and inaccuracies in a dataset so it's fit for analysis. That means fixing typos, removing duplicates, standardizing formats, handling missing values, and flagging outliers. Not glamorous. But it's the difference between insights you can trust and conclusions that fall apart under scrutiny.
You've probably heard that data scientists spend "80% of their time cleaning data." That stat is everywhere, and it's wrong. A 2015 CrowdFlower survey found 66.7% of respondents said cleaning was one of their most time-consuming tasks - not that it consumed 80% of their hours. By 2017, CrowdFlower's combined figure for collecting, labeling, cleaning, and organizing data was 51%. A 2018 Kaggle survey pegged time spent cleaning at roughly 15%. The point: even in widely cited surveys, cleaning is a major pain, but it's nowhere near the mythical "80%."
One quick distinction: cleaning fixes errors in existing data. Data transformation reshapes clean data for a new purpose - pivoting, aggregating, joining. They're sequential, not interchangeable. Clean first, transform second.
Why Dirty Data Costs More Than You Think
The numbers are alarming. Gartner pegs the average cost of poor data quality at $12.9M per year per organization. MIT Sloan research shows companies lose 15-25% of revenue annually from bad data. An IBM IBV study found that over a quarter of organizations estimate they lose more than $5M annually due to poor data quality, with 7% reporting losses above $25M.
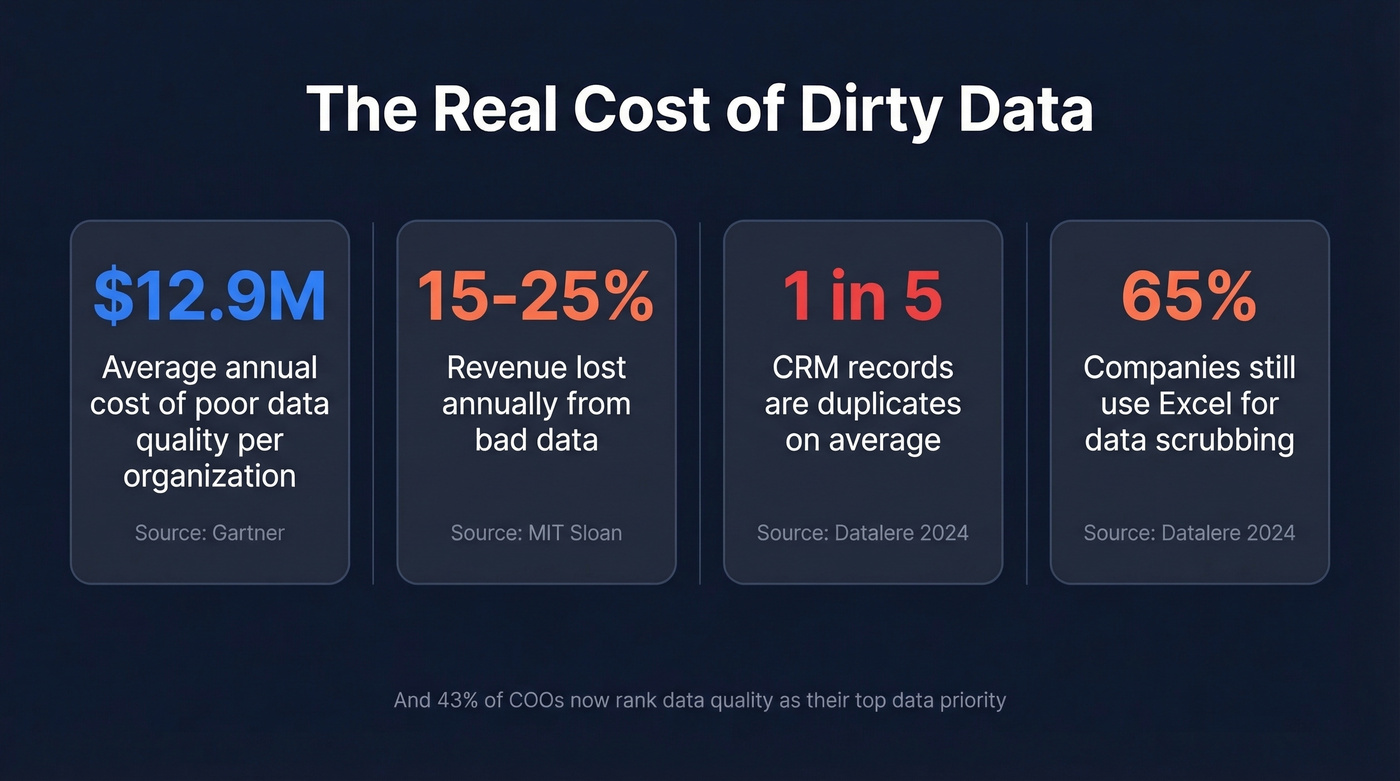
These aren't abstract figures. They show up as failed marketing campaigns sent to invalid emails, sales reps calling disconnected numbers, and forecasts built on duplicate records. In CRM systems specifically, duplication rates reach up to 20%. One in five records in your CRM might be a duplicate - inflating pipeline, skewing reports, and wasting rep time.
The leadership layer feels it too. 43% of chief operations officers now rank data quality as their most significant data priority. With AI adoption accelerating, the stakes keep rising: 45% of business leaders cite data accuracy and bias concerns as the leading barrier to scaling AI initiatives. Garbage in, garbage out - and IBM cites a Gartner forecast that AI spending will surpass $2T in 2026.
Here's the thing: 65% of companies still rely on manual methods like Excel to scrub their data. Excel isn't a data quality tool. It's a spreadsheet that happens to have find-and-replace.
Data Cleaning vs. Data Transformation
These get conflated constantly. Let's separate them.
| Data Cleaning | Data Transformation | |
|---|---|---|
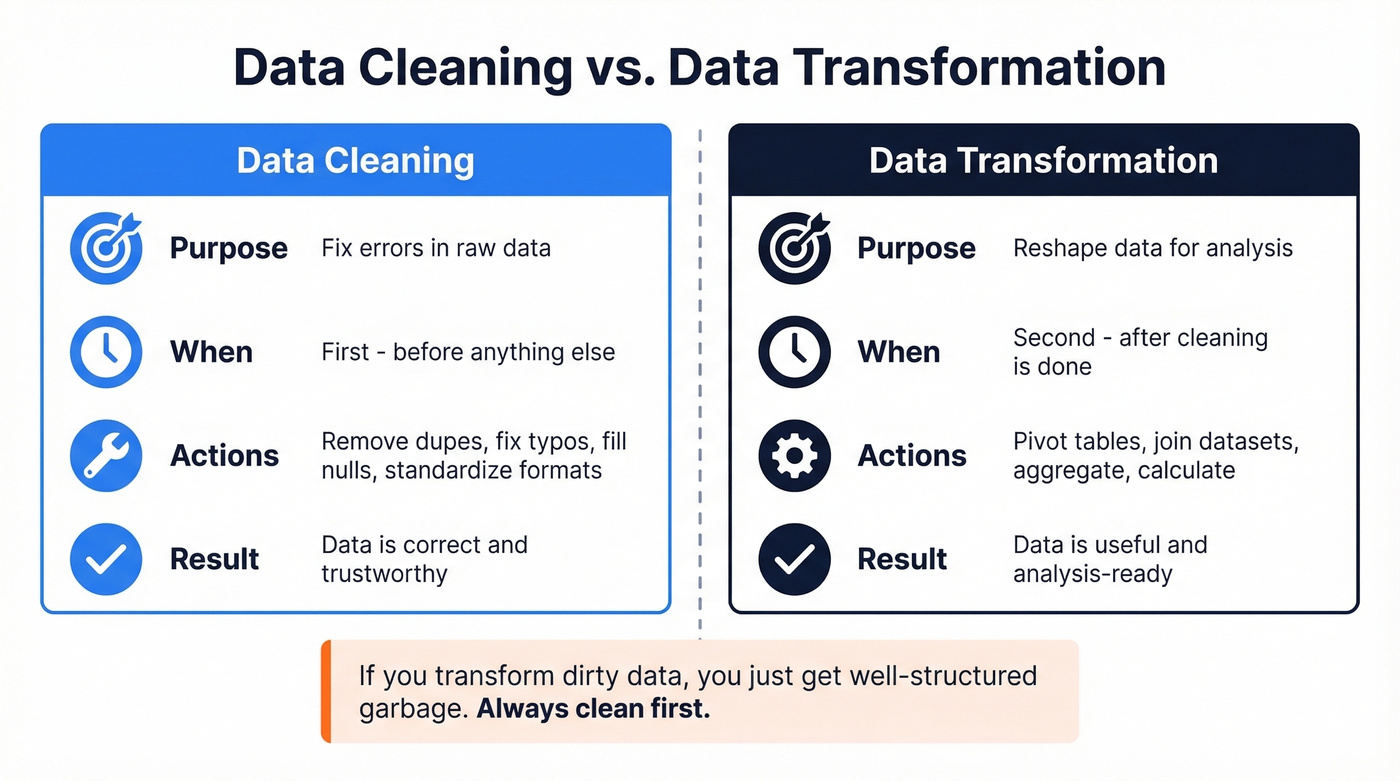
| Purpose | Fix errors in raw data | Reshape data for analysis |
| Timing | Before transformation | After cleaning |
| Examples | Remove dupes, fix typos, fill nulls | Pivot tables, join datasets, aggregate |
Cleaning makes data correct. Transformation makes correct data useful. If you transform dirty data, you just get well-structured garbage.
The 7-Step Data Cleaning Process
This process works whether you're cleaning a marketing list in a spreadsheet or a 100M-row table in Snowflake. The tools change; the logic doesn't.
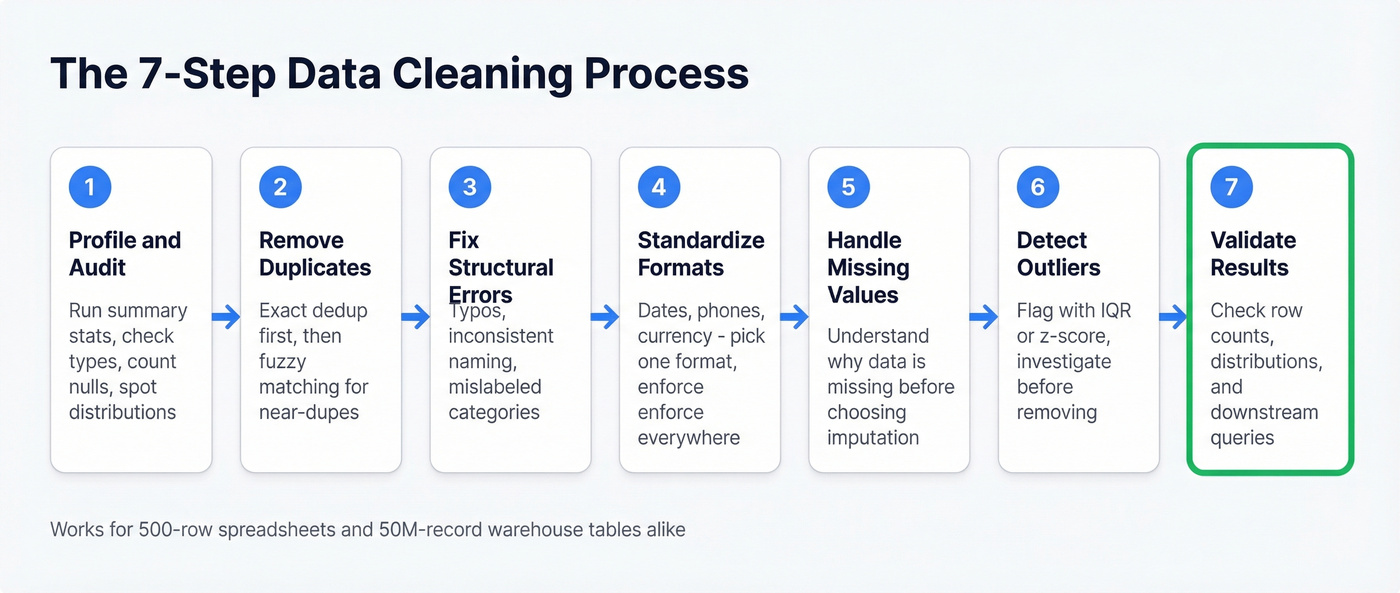
1. Profile and Audit
Before you touch a single cell, understand what you're working with. Run summary statistics, check data types, count nulls, and look at value distributions. If your "age" column has a max value of 999, you've got a problem - and you want to find it before you start modeling, not after.
2. Remove Duplicates
Exact duplicates are easy. Near-duplicates - "John Smith" at "Acme Corp" vs "Jon Smith" at "Acme Corporation" - are where it gets tricky. We've seen duplication rates hit 15-20% on unmanaged CRM databases. Use fuzzy matching when exact deduplication isn't enough.
3. Fix Structural Errors
These are the typos, inconsistent naming conventions, and mislabeled categories that creep in during manual entry. "California," "CA," "calif." - all the same state, three different values. Variations in business names, personal names, and addresses make up roughly 60% of the data quality challenges organizations experience. Standardize them or your groupby operations will silently split what should be one category into three.
4. Standardize Formats
Dates in MM/DD/YYYY mixed with DD-MM-YYYY. Phone numbers with and without country codes. Currency values stored as strings with dollar signs. Pick a format, enforce it everywhere, document what you chose.
5. Handle Missing Values
Don't just drop every row with a null. First, understand why the data is missing. Is it random? Systematic? Structurally impossible? A missing "company size" field might mean the data wasn't collected; a missing "revenue" field might mean the company is pre-revenue. The right imputation strategy depends on the missingness type.
6. Detect and Handle Outliers
An outlier isn't automatically an error. A $10M deal in a dataset of $50K deals is unusual, but it might be your biggest customer. Use IQR or z-score methods to flag outliers, then investigate each one before deciding to keep, cap, or remove it.
7. Validate Results
Run your analysis on the cleaned dataset and check that the results make sense. Do row counts match expectations? Are distributions reasonable? Does a downstream query return what you'd expect? Validation is the step most people skip, and it's the one that catches the mistakes from steps 1-6.
CRM duplication rates hit 20%. Bounce rates climb. Reps waste hours on disconnected numbers. Most of that cleanup exists because the data was bad when it entered your system. Prospeo's 5-step verification, catch-all handling, and 7-day refresh cycle eliminate dirty contact data at the source - 98% email accuracy, 92% API match rate, 50+ data points per record.
Fix your data problem at the source, not in a spreadsheet.
How to Clean Data in Python
Pandas is the workhorse. Here are the patterns you'll use on almost every cleanup job, ready to copy-paste.
Check for missing values:
df.isnull().sum()
This gives you a per-column count of nulls. Start here every time.
Remove duplicates:
df.drop_duplicates(inplace=True)
For near-duplicates, you'll need fuzzy matching libraries like fuzzywuzzy or recordlinkage, but exact deduplication handles the low-hanging fruit.
Fill missing values:
df['revenue'].fillna(df['revenue'].mean(), inplace=True)
Mean imputation works for normally distributed numeric columns. For categorical data, use the mode or a dedicated "Unknown" category. Don't fill everything with zero - that's a data quality decision masquerading as a convenience shortcut.
Standardize strings:
df['city'] = df['city'].str.lower().str.strip()
This catches trailing whitespace and case inconsistencies in one line. For more complex standardization, chain a .replace():
df['state'] = df['state'].str.lower().str.strip().replace({
    'ca': 'california',
    'ny': 'new york'
})
Clean currency columns:
df['price'] = (
    df['price']
    .str.replace('$', '', regex=False)
    .str.replace(',', '', regex=False)
    .astype(float)
)
Currency stored as strings is one of the most common format issues. Strip the symbols, cast to float, move on.
Convert date columns:
df['date'] = pd.to_datetime(df['date'], errors='coerce')
The errors='coerce' flag turns unparseable dates into NaT instead of throwing an exception - useful for finding the rows that need manual attention.
Detect outliers with IQR:
Q1 = df['salary'].quantile(0.25)
Q3 = df['salary'].quantile(0.75)
IQR = Q3 - Q1
mask = (df['salary'] >= Q1 - 1.5 * IQR) & (df['salary'] <= Q3 + 1.5 * IQR)
df_clean = df[mask]
This removes values outside 1.5x the interquartile range. It's aggressive - always check what you're cutting before you commit.
5 Mistakes That Break Your Analysis
Removing Outliers Blindly
The IQR method above is a detection tool, not an automatic deletion rule. Removing every statistical outlier without investigation can delete rare but valid observations - your highest-value customers, your most unusual transactions. Flag first, investigate second, remove only with justification.
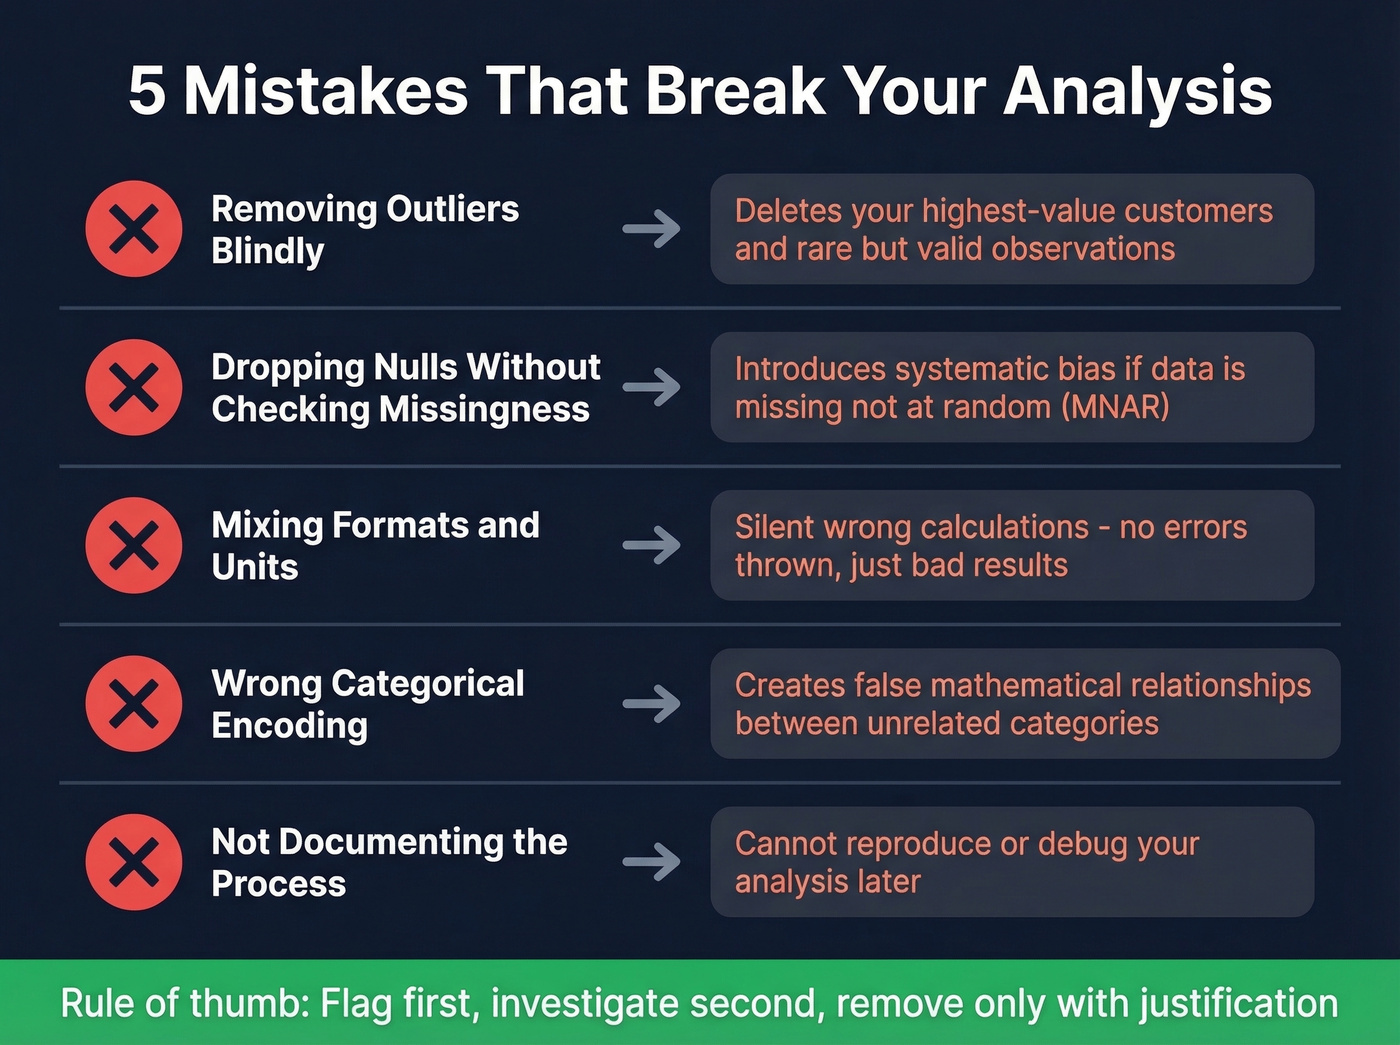
Dropping Nulls Without Checking Missingness Type
If data is missing completely at random (MCAR), dropping rows is defensible. If it's missing not at random (MNAR) - say, high-income respondents skip the income question - dropping those rows introduces systematic bias. Check the pattern before you dropna().
Mixing Formats and Units
Revenue in USD mixed with EUR. Distances in miles mixed with kilometers. Dates in American format mixed with European. These errors don't throw exceptions - they just silently produce wrong calculations. Unit standardization should happen in step 4, every single time.
Wrong Categorical Encoding
Mapping "Low/Medium/High" to 1/2/3 implies that High is three times Low. For ordinal variables, that's sometimes acceptable. For nominal variables like country or department, arbitrary integer encoding creates false mathematical relationships. Use one-hot encoding or proper category types instead.
Not Documenting the Process
If you can't reproduce your cleaning steps, you can't debug your analysis. Every decision - why you dropped those 47 rows, why you imputed with median instead of mean, why you capped salary at $500K - should be logged. In pandas, this means keeping your cleaning script versioned. On a team, it means a shared cleaning log or a dbt-style transformation layer.
Best Data Cleaning Tools (2026)
The ETL and data quality market is projected to grow from $8.85B in 2026 to $18.60B by 2030, which means the tooling options are expanding fast. Here's what's worth your time right now, grouped by budget.
| Tool | Best For | Starting Price | Free Tier? | Code Required? |
|---|---|---|---|---|
| Prospeo | B2B contact data | ~$0.01/email | Yes (75 emails) | No |
| OpenRefine | No-code exploration | Free | Yes | No |
| pandas/Python | Full control | Free | Yes | Yes |
| Power Query | Excel/Power BI users | Included | Yes | No |
| Alteryx | Visual enterprise prep | ~$250/user/mo | No | No |
| dbt | Pipeline testing | Free (Core) | Yes (Core) | SQL |
| Julius | AI-assisted analysis | $37/mo | Limited | No |
| Mammoth | No-code teams | $99/mo | No | No |
| Melissa | Address/name quality | $40/10K credits | No | No |
| Talend | Enterprise ETL | ~$1,170/user/yr | No | No |
| Informatica | Enterprise governance | ~$2,000/mo | No | No |
| Soda | Pipeline monitoring | Free (Core) | Yes (Core) | YAML |
| Great Expectations | Data validation | Free (OSS) | Yes | Python |
| AWS Glue | Cloud-native ETL | Usage-based | Free tier | Python/Spark |
| Integrate.io | Cloud ETL/ELT | $1,999/mo | No | No |
Free and Low-Cost
OpenRefine is the best free tool for exploring and cleaning messy data without writing code. Its cluster-and-edit feature for fuzzy matching is excellent - it'll find "Acme Corp," "ACME Corporation," and "acme corp." and let you merge them in a few clicks. The faceting and filtering interface makes it easy to spot patterns in dirty data that would take dozens of pandas commands to replicate. The limitation is scale: it runs locally and struggles with datasets over a few hundred thousand rows. For anything under that threshold, it's the first tool we'd recommend to a non-coder.
pandas / Python handles everything from a 1,000-row CSV to multi-gigabyte datasets with chunking or Dask. The code patterns in the Python section above cover 90% of cleanup tasks. The real advantage is reproducibility - your script is your documentation, and you can rerun it whenever the source data updates. Pair it with Great Expectations or dbt tests for validation, and you've got a production-grade pipeline. The learning curve is real, but the payoff is total control.
Power Query comes included with Excel and Power BI, and for business analysts who live in those tools, it's a massive upgrade over manual find-and-replace. It handles removing duplicates, splitting columns, changing types, and filtering rows through a visual interface. Where it gets interesting is the M language under the hood - advanced users can write custom transformations that run on every data refresh, turning a one-time cleanup into an automated pipeline. It won't replace a proper data engineering stack, but for recurring reports built on messy source files, Power Query saves hours every week.
Mid-Range
Alteryx Designer Cloud is the enterprise visual data prep tool. Drag-and-drop workflows, built-in profiling, and AI-assisted suggestions make it accessible to analysts who don't write Python. At ~$250/user/month, it's not cheap - but for teams doing complex multi-source blending and prep at scale, it replaces a lot of custom code. The tradeoff: you're locked into the Alteryx ecosystem, and pricing adds up fast across a large team.
dbt isn't a cleaning tool per se - it's a transformation framework with built-in testing. Its generic tests (unique, not_null, accepted_values, relationships) catch data quality issues at the pipeline level, which is where this work should happen in a modern data stack. The consensus among practitioners on r/dataengineering is that if you're already running dbt for transformations, adding data quality tests is a no-brainer - they're simple, they live next to your transformation code, and they run on every build.
Julius ($37/mo) handles basic cleanup during exploratory analysis - good for quick projects, not production pipelines. Mammoth Analytics ($99/mo) targets no-code teams with visual data prep. Melissa ($40/10,000 credits) specializes in address and name standardization - if your primary challenge is messy addresses, it's purpose-built for that.
Enterprise and Niche
Informatica Cloud Data Quality is the enterprise governance play. Their CLAIRE AI handles automated profiling, standardization suggestions, and anomaly detection. At ~$2,000/mo, it's priced for organizations that need to enforce quality rules across hundreds of sources. Overkill for a startup; table stakes for a Fortune 500 data team.
Talend Data Fabric (~$1,170/user/year) is a full enterprise ETL suite with built-in quality rules. AWS Glue offers usage-based pricing for cloud-native ETL on AWS, with a free tier for getting started. Soda Core uses SodaCL, a YAML DSL, to run data quality checks as SQL - lightweight and easy to integrate into existing pipelines.
A note on Great Expectations: the community consensus is blunt. It can be needlessly complex and time-consuming to set up. Skip it unless you need a dedicated validation framework and have the engineering bandwidth to configure it properly. Integrate.io starts at $1,999/mo for unlimited pipelines - enterprise pricing for enterprise needs.
AI-Powered Data Cleaning
Let's be honest about what AI actually automates today versus the marketing hype.
ML-based anomaly detection catches patterns that rule-based systems miss - unusual value combinations, subtle format drift, records that don't match their cluster. Informatica's CLAIRE engine and Alteryx Designer Cloud do this well. DataRobot focuses on automated feature engineering and data quality assessment as part of its broader ML pipeline, making it a strong choice for teams already investing in machine learning infrastructure.
Automated standardization uses NLP to recognize that "123 Main St," "123 Main Street," and "123 main st." are the same address and suggest a canonical form. Entity resolution - matching records that refer to the same real-world entity across different sources - is where AI adds the most value, because fuzzy matching at scale is genuinely hard for rule-based systems.
What AI doesn't do yet: make judgment calls about whether an outlier is an error or a valid edge case. Decide whether missing data should be imputed, flagged, or dropped. Understand your business context well enough to know that "inactive" and "churned" mean different things in your CRM. The human-in-the-loop isn't going away anytime soon. AI compresses the mechanical work; the analytical decisions still need a person.
Data Cleaning for B2B and CRM Ops
Here's a hot take: if your average contract value is in the low five figures or below, you probably don't need to clean your contact data at all. You need to stop importing dirty data in the first place.
Most B2B cleanup problems - bouncing emails, disconnected phone numbers, duplicate records, stale job titles - aren't analysis problems. They're sourcing problems. If you're pulling contact data from a provider that refreshes quarterly or never, you're inheriting decay from day one. Industry estimates put B2B contact data decay at roughly 30% per year as people change jobs, companies rebrand, and email domains shift.
That 65% of companies still cleaning data in Excel? Much of that manual effort goes toward contact data that was stale when it arrived. We've seen teams spend 10+ hours a week manually verifying emails and deduplicating CRM records that should never have been imported dirty in the first place.
The smarter approach flips the model. Instead of fixing bad contact data after the fact, you start with verified data. Prospeo runs a 5-step verification process - including spam-trap removal, catch-all domain handling, and honeypot filtering - before any record enters your workflow. The 7-day refresh cycle means data stays current, not just accurate at the moment of purchase. Snyk's 50-person sales team saw bounce rates drop from 35-40% to under 5%, with AE-sourced pipeline up 180%. That's not incremental improvement - it's a category shift from "cleaning lists" to "not needing to."
For CRM-specific cleanup, the enrichment API returns 50+ data points per contact at a 92% match rate. Push your existing CRM records through it, and you get updated emails, verified phones, and fresh firmographic data back - without the manual scrubbing.
You just read that 65% of companies still scrub data manually in Excel. For contact data, that's a choice. Prospeo enriches your CRM with 143M+ verified emails and 125M+ verified mobiles - refreshed every 7 days, not every 6 weeks. At $0.01 per email, it costs less than one hour of manual cleanup.
Skip the cleanup. Start with data that's already clean.
Quick Reference Checklist
Use this as a pre-flight check before any cleanup project:
- Profile your data before making any changes
- Check for and remove exact duplicates
- Run fuzzy matching for near-duplicates
- Standardize date, currency, and text formats
- Handle nulls with intent - don't just drop everything
- Validate data types match expected schemas
- Flag outliers and investigate before removing
- Document every cleaning decision and transformation
- Validate results against business rules and expected distributions
- Test cleaned data with downstream queries before deploying
- Schedule recurring quality checks for live data sources
FAQ
What's the difference between data cleaning and data wrangling?
Data cleaning fixes errors and inconsistencies (duplicates, missing values, format drift), while data wrangling includes cleaning plus reshaping and combining data for a specific use case. In practice: cleaning makes records trustworthy; wrangling makes them analysis-ready via joins, pivots, aggregations, and feature creation.
How long does data cleaning typically take?
For many analytics projects, expect roughly 10-20% of total project time, aligning with a 2018 Kaggle survey that pegged cleaning at about 15%. A tidy CSV takes 1-3 hours; a legacy CRM with years of unmanaged entries can take several days, especially if you need entity resolution and rule validation.
Can data cleaning be fully automated?
No. Automation handles detection - duplicates, anomalies, schema drift - and suggestions, but humans still decide what's "correct" for the business. A practical setup is semi-automated: run profiling and rules on every refresh, then review exceptions weekly. Aim for less than 1% of records landing in the "needs review" bucket.
What's a good way to keep CRM contact data clean?
Use a verified source with frequent refresh (weekly is ideal), then run enrichment and deduplication on a schedule. Starting with 98% email accuracy and a 7-day refresh cycle prevents bounces and reduces duplicates instead of fixing them later - which is the whole point.
Summary
Data cleaning isn't about finding one magic tool. It's about a repeatable workflow: profile, dedupe, fix structural issues, standardize formats, handle missingness, investigate outliers, and validate against real business rules. Do that consistently, and your analysis stops breaking in weird, expensive ways. And in CRM workflows, starting with verified contact data can eliminate a huge chunk of the cleanup work entirely.