Deals Pipeline: The Operational Playbook Most CRM Guides Won't Give You
Four in five sales and finance leaders missed at least one forecast in the past year, per Xactly's benchmark report. Not because they lacked a CRM - because their deals pipeline was lying to them. Deals sitting in "Negotiation" with no next step. Close dates pushed three times. Contacts who changed jobs two months ago. The pipeline looked full, the forecast looked plausible, and the quarter still came up short.
This playbook covers the operational side of managing a deals pipeline - stage design, the math, hygiene automations, and benchmarks that separate a pipeline you can forecast from one that's just a wish list.
The Short Version
- Use 5-7 stages mapped to buyer milestones, not internal tasks. "Proposal reviewed by decision-makers" beats "proposal sent."
- Every deal needs a real next step and a real date - or it leaves the pipeline.
- Track three metrics: coverage ratio, weighted pipeline value, average deal age.
- Smaller, cleaner pipelines close more. Disqualify early and often.
- Pipeline accuracy starts with contact data accuracy - garbage in, garbage forecast out.
What Is a Deals Pipeline?
A deals pipeline is the seller's view of active opportunities, organized by stage, moving toward closed-won or closed-lost. It's the operational backbone of every sales team - the thing you review on Monday morning and stress about on Thursday afternoon.
People use "pipeline" to mean two different things, and the confusion causes real problems. Sometimes it's the stage model itself - the visual board in your CRM with columns like Discovery, Proposal, Negotiation. Other times it's the dollar value of deals currently in play, as in "our pipeline is looking rough this quarter." Both usages are valid. Just make sure your team agrees on which one they mean in any given conversation.
A pipeline isn't a funnel. The funnel is the buyer's journey - awareness to consideration to purchase - measured by conversion rates at each stage. The pipeline is your process, measured by sales activities and deal progression. And neither is a forecast. Your forecast is a time-bound revenue projection, typically built from weighted pipeline data once opportunities are qualified. The pipeline is the raw material, the funnel measures conversion rates, and the forecast is the prediction you make from both.
One recurring theme on r/hubspot and r/sales: teams confuse leads with deals. Every form fill creates a deal, the pipeline gets cluttered with unqualified noise, and reps stop trusting the board. A deal should only enter your pipeline when there's a qualified opportunity - not when someone downloads a whitepaper.
Stages in a Deals Pipeline (7-Stage Framework)
How Many Stages?
Five to seven. That's the sweet spot for most B2B teams. Fewer than five and you can't spot where deals stall. More than seven and reps stop updating - they'll drag a deal from "Qualification" straight to "Closed Won" and backfill the stages later, if ever.
SMB teams with 30-45 day cycles can run lean with five stages. Enterprise teams selling six-figure deals over 90+ day cycles usually need six or seven to capture additional buying committee dynamics - technical validation, procurement review, legal redline. Start with five. Add a stage only when you can prove a bottleneck exists between two existing ones.
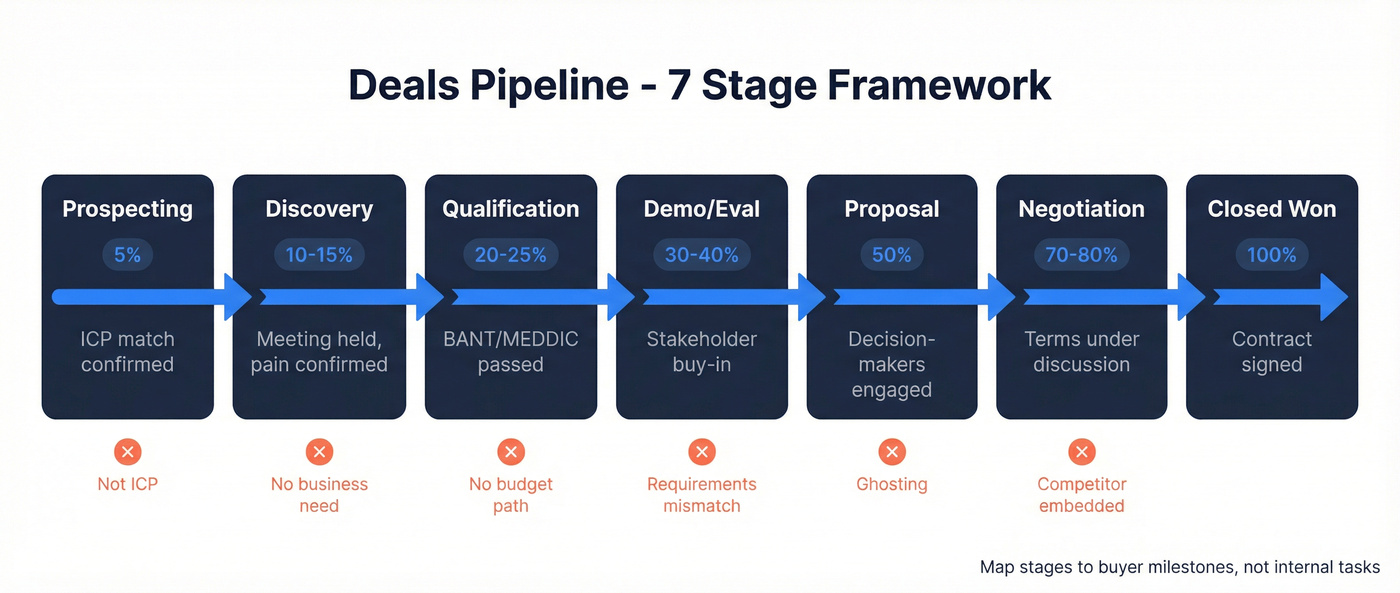
The critical design principle: stages should map to buyer commitment milestones, not your internal tasks. "Demo scheduled" is an internal task. "Stakeholder agrees problem is worth solving" is a buyer milestone. The second one actually tells you something about deal progression.
Here's the thing: if your average contract value is under $15K, you probably don't need more than five stages. We've watched mid-market teams bolt on "Technical Validation" and "Procurement Review" stages because enterprise playbooks told them to - then wonder why reps skip half the board. Match your stage count to your deal complexity, not your ambition.
Stage Template
| Stage | Entry Criteria | Exit Criteria | DQ Triggers | Probability |
|---|---|---|---|---|
| Prospecting | ICP match confirmed | Meeting booked | Not ICP, no contact info | 5% |
| Discovery | Meeting held | Pain + timeline confirmed | No business need | 10-15% |
| Qualification | BANT/MEDDIC passed | Champion identified | No budget path, no authority | 20-25% |
| Demo/Eval | Tech requirements shared | Stakeholder buy-in | Requirements mismatch | 30-40% |
| Proposal | Decision-makers engaged | Feedback received | Ghosting, RFP filler | 50% |
| Negotiation | Terms under discussion | Verbal agreement on terms | Competitor embedded / legal | 70-80% |
| Closed Won | Contract signed | Revenue booked | - | 100% |
Most mid-market AEs can effectively work 15-25 active opportunities at a time. Beyond that, deal quality drops because attention gets spread too thin. If your reps are carrying 40+ deals, they're not working a pipeline - they're maintaining a database.
When to Disqualify
Most reps hold onto deals too long. These fail triggers should move a deal to closed-lost immediately:
- No clear business need. They took the meeting out of curiosity, not pain.
- No budget path. Not "no budget" - no path to budget. If they can't articulate how they'd fund this, they won't.
- Decision-makers inaccessible. Your champion can't get you in front of the people who sign.
- Ghosting after proposal. Two follow-ups with no response = dead deal. Archive it.
- Being used as RFP filler. They already have a preferred vendor and need a third quote for procurement compliance. You're the third quote.
Skip the "nurture" stage if you don't have the resources to actually nurture. Parking dead deals in a holding pen just creates a second graveyard that nobody cleans.
You just read it: contacts who changed jobs two months ago wreck your pipeline. Prospeo refreshes 300M+ profiles every 7 days - not the 6-week industry average. That means your pipeline stages reflect real buyers, not ghosts.
Stop forecasting on stale data. Start with contacts that actually exist.
Pipeline Metrics That Matter
Coverage Ratio
The formula is simple: Total pipeline value / Sales target = Coverage ratio.
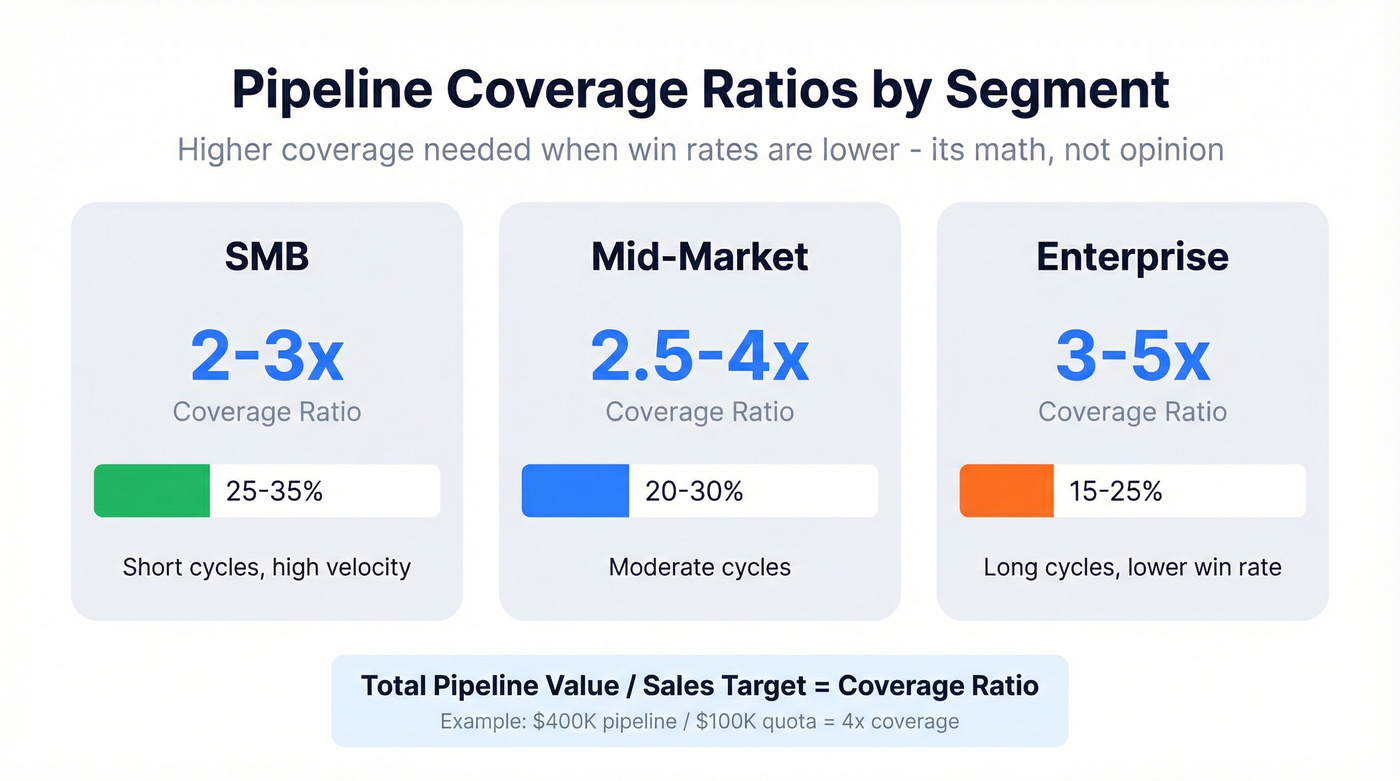
A $400K pipeline against a $100K quota = 4x coverage. But the "right" ratio depends entirely on your segment and win rate.
| Segment | Coverage Ratio | Typical Win Rate | Logic | |---------|---------------|-----------------|-------| | Enterprise | 3-5x | 15-25% | Long cycles, lower win rate | | Mid-Market | 2.5-4x | 20-30% | Moderate cycles | | SMB | 2-3x | Short cycles, higher velocity |
If your win rate is 25%, you need 4x coverage just to break even. That's math, not opinion. The mistake most teams make is treating coverage ratio as a universal benchmark - "we need 3x" - without adjusting for their actual close rates.
Your CRO dashboard should include a trust layer alongside these headline numbers: required field completeness, deals missing next steps, and duplicate rate. Without it, every other metric is built on questionable data.
Weighted Pipeline
Total pipeline value is a vanity metric on its own. A $500K pipeline where 60% of deals are in Discovery is worth far less than a $300K pipeline where half the deals are in Negotiation.
Weighted pipeline fixes this. The formula: Deal value x Stage probability = Weighted value. Sum across all deals.
Worked example: a $50K deal in Proposal at 50% probability = $25K weighted. A $100K deal in Discovery at 10% probability = $10K weighted. The smaller deal is worth more to your forecast, even though it's half the size.
| Stage | Probability Range |
|---|---|
| Discovery | 10-15% |
| Demo/Eval | 25-35% |
| Proposal | 45-55% |
| Negotiation | 70-80% |
| Verbal Commit | 90-95% |
Calibrate these quarterly against your actual conversion data. If your Discovery-to-Demo conversion is 40% but you're weighting Discovery at 10%, your weighted pipeline will systematically undercount early-stage value.
Velocity and Deal Age
Pipeline velocity tells you how fast money moves through your pipeline: (Number of deals x Average deal size x Win rate) / Average cycle length.
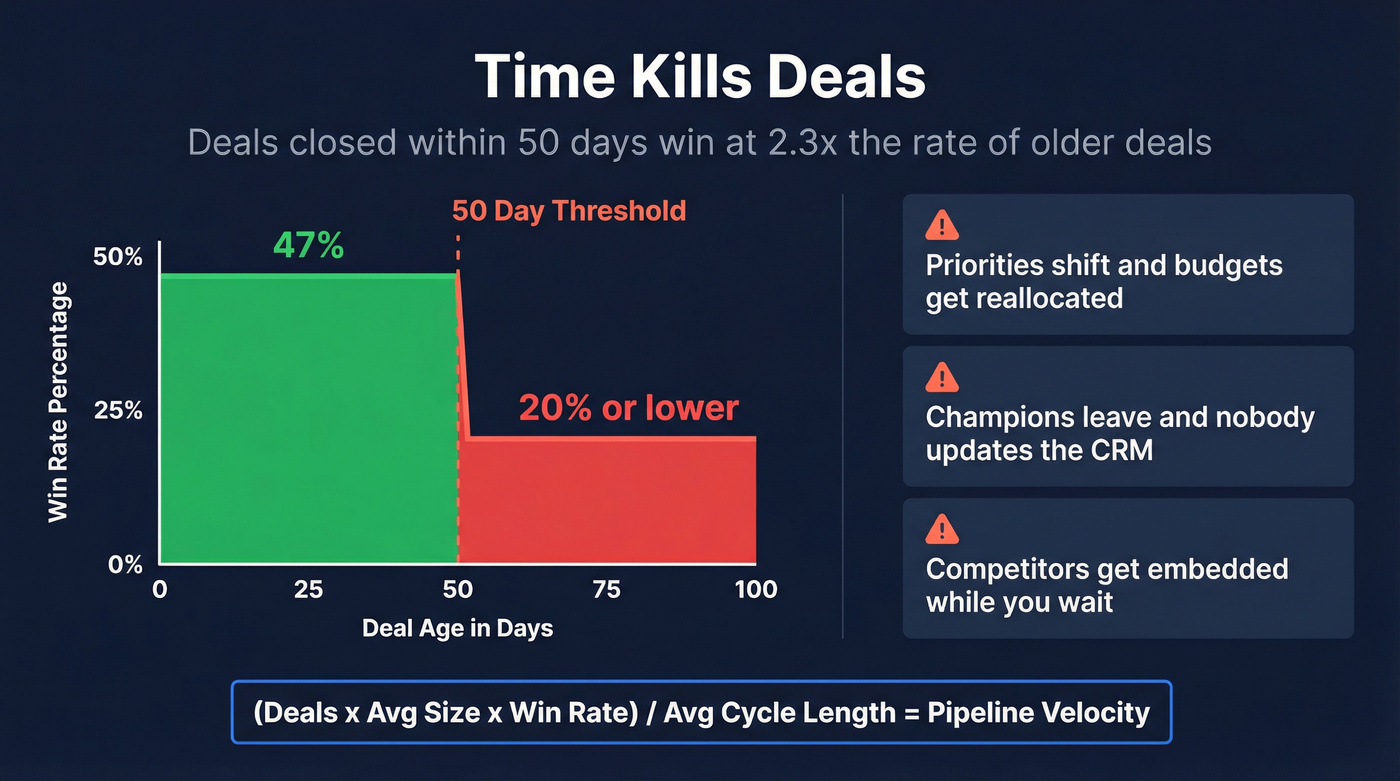
The time component matters most. Opportunities closed within 50 days have a 47% win rate. After 50 days, win rates drop to roughly 20% or lower. Time kills deals - not because buyers lose interest, but because priorities shift, champions leave, budgets get reallocated, and competitors get embedded.
Track average deal age by stage. If your median Discovery-to-Qualification time is 12 days but you've got deals sitting in Discovery for 35, those aren't "working" - they're decaying.
Benchmarks by Segment
Let's put numbers around what "normal" looks like. These benchmarks come from compiled SaaS funnel data across multiple studies.
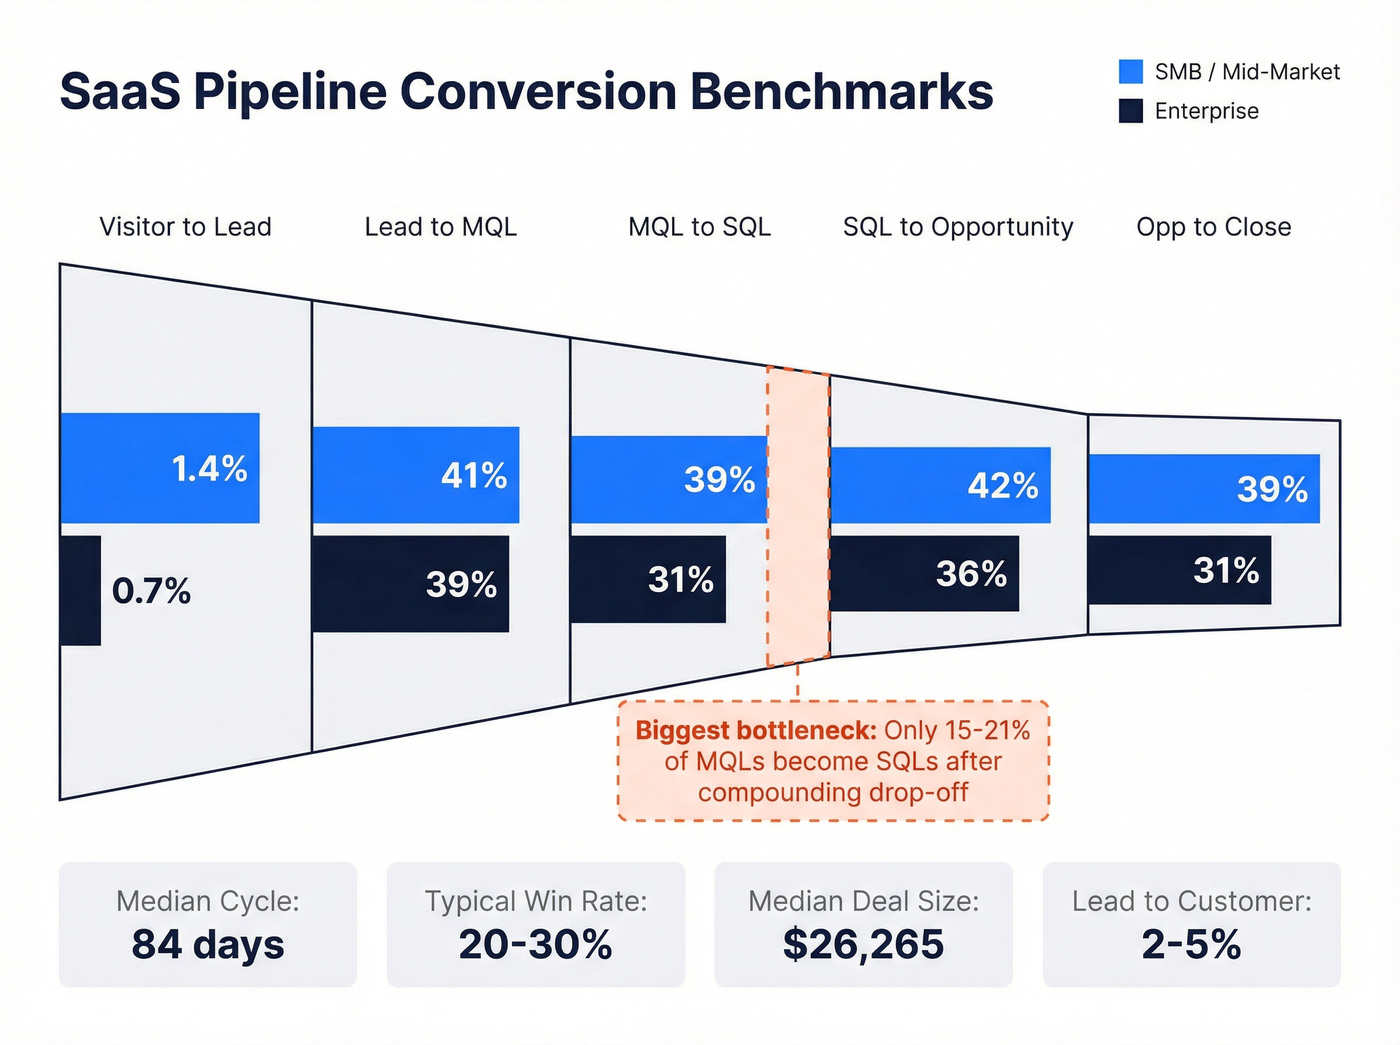
Headline benchmarks: lead-to-customer conversion runs 2-5%. Median sales cycle is 84 days, with an optimal range of 46-75. Typical win rates land between 20-30%. Median deal size for private SaaS is $26,265.
| Stage | SMB/Mid-Market | Enterprise |
|---|---|---|
| Visitor to Lead | 1.4% | 0.7% |
| Lead to MQL | 41% | 39% |
| MQL to SQL | 39% | 31% |
| SQL to Opportunity | 42% | 36% |
| Opp to Close | 39% | 31% |
The biggest bottleneck across the full funnel is the cumulative MQL-to-SQL handoff - while individual stage conversion rates look healthy in the table above, the compounding effect means only 15-21% of MQLs ultimately become SQLs when you factor in drop-off between stages. That's where most pipeline value evaporates.
For top-of-funnel context, the average marketing conversion rate across 100M+ datapoints is 2.9% - visitor to qualified lead across 14 industries. Channel mix matters a lot: compiled SaaS benchmarks put visitor-to-lead at 2.1% for SEO, 0.7% for PPC, and 1.0% for events.
Win rate distribution is revealing: the largest cluster of teams sits in the 21-25% bracket. Only 13% of teams reach 40%+. If you're at 25%, you're average. At 35%, you're outperforming most of your peers.
One pattern we see repeatedly: teams obsess over top-of-funnel volume when their real problem is mid-funnel conversion. If your MQL-to-SQL rate is below 20%, adding more leads won't fix your pipeline - fixing your qualification criteria will.
Why Your Deals Pipeline Is Lying to You
It's Thursday afternoon. You pull up the pipeline report. $1.2M in open pipeline against a $300K target - 4x coverage. Looks healthy. Except three deals in Negotiation haven't had a meeting in six weeks, two deals have close dates originally set for last quarter, and one "champion" left the company a month ago with nobody updating the record.
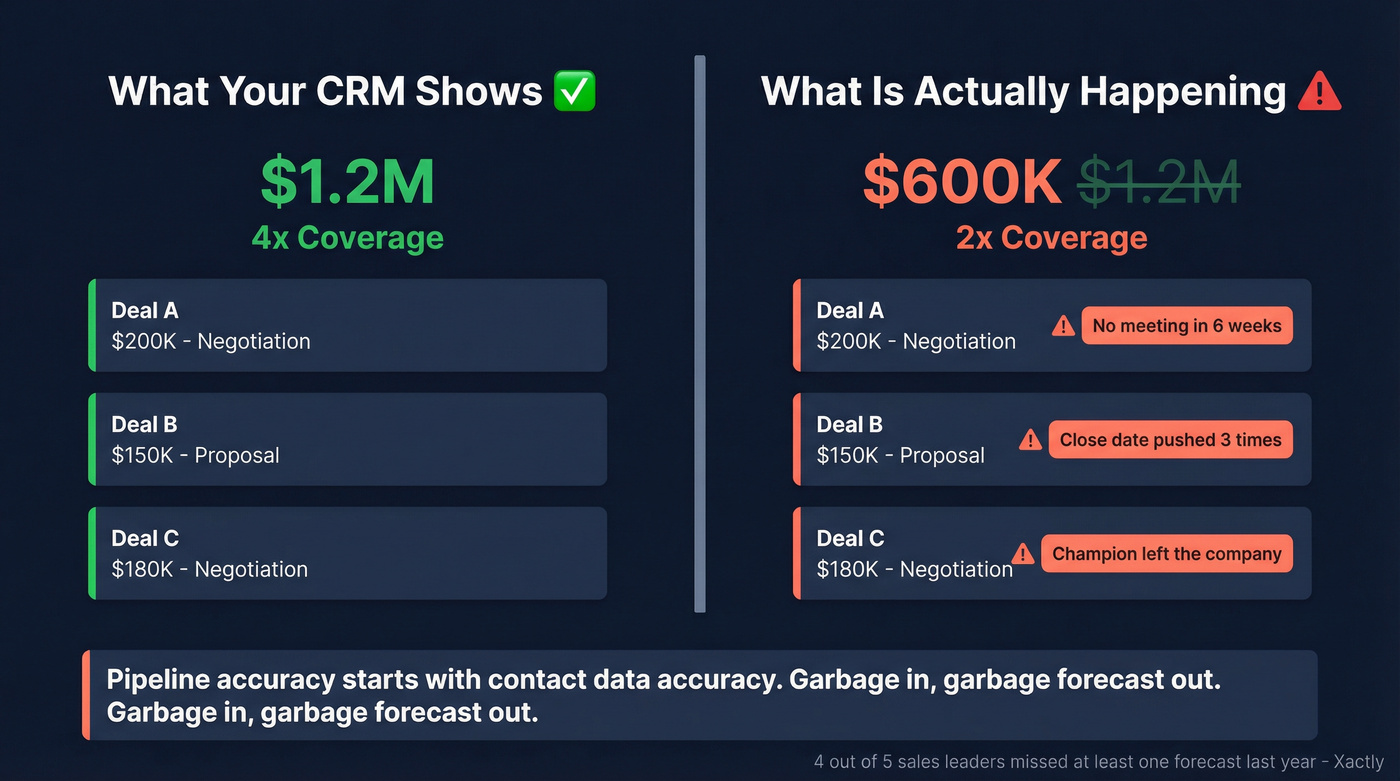
Your pipeline isn't $1.2M. It's probably $600K, and half of that is wishful thinking.
A recurring theme on r/sales: reps ask whether any organization forecasts deals accurately, or if it's all theater. The answer is usually theater - because the pipeline data feeding the forecast is garbage.
The one hard rule that fixes most of this: if there's no real next step and no real date, it doesn't belong in the active pipeline. Not "follow up sometime." A specific action with a specific date that both parties agreed to. Everything else is a maybe, and maybes don't belong in your forecast.
Three symptoms of a lying pipeline show up everywhere. Stages become "mood labels" - reps move deals forward because they feel good about the conversation, not because the buyer did something. Close dates are fiction nobody believes but nobody changes. Next steps are vague or missing entirely.
A top-heavy pipeline where most value sits in early stages means you're generating interest but not converting. A bottom-heavy pipeline means you're closing what you have but not feeding the top. Both are problems - just different ones. Diagnose which shape yours is before deciding where to invest.
The counterintuitive fix: make your pipeline smaller. Research attributed to Jason Jordan found that the most productive sellers maintain smaller pipelines through aggressive early disqualification - resulting in 20% more prospecting calls, 25% more meetings, and 50% more deals. A bloated pipeline doesn't just produce bad forecasts. It actively slows reps down because they're spreading attention across deals that'll never close.
Speed matters at the top: the average lead response time is 42 hours, and contacting within an hour makes you roughly 7x more likely to qualify the lead. Discipline matters everywhere else.
Pipeline Hygiene Automation
Manual pipeline cleanup doesn't scale. Here are five automations that keep your deals pipeline honest without relying on rep discipline.
Close-date push counter. When a deal's close date passes, auto-push it +30 days and increment a "Push Counter" field. Flag any deal that hits 3 pushes for manager review. Three pushes means the deal is either dead or fundamentally mispriced on timeline.
Auto-close stale early-stage deals. Any Stage 0 or pre-qualified opportunity with no activity in 14 days gets automatically closed-lost. These are the zombie deals that inflate your pipeline without contributing to forecast accuracy.
Next-step enforcement. Block stage advancement unless the "Next Step" and "Next Step Date" fields are populated. This is the single automation with the highest ROI - it forces the discipline that most reps skip.
Stage aging alerts. Flag mid-market deals older than 75 days in Negotiation or 45 days in Proposal. For SMB, cut those thresholds in half. Deals that exceed 1.5-2x your median time-in-stage are statistically unlikely to close.
Weekly hygiene dashboard. Surface deals owned by inactive users, opportunities missing next steps, close dates in the past, and required field completeness. Run this every Monday. Pipeline reports that track stage conversion and aging catch problems before they compound.
Most CRMs support these workflows natively. HubSpot, SuiteDash, and ActiveCampaign all handle pipeline boards with drag-and-drop stage management. The CRM doesn't matter nearly as much as the governance you build inside it. HubSpot's free tier handles basic pipelines; Pipedrive starts around $15-25/user/month; Salesforce entry tiers start around $25/user/month.
Pipeline accuracy starts with contact data accuracy. If your emails bounce because your contact data is stale, your pipeline metrics are fiction. In our experience, the fastest fix is running nightly data enrichment against open opportunities so stale contacts get flagged before they corrupt your next forecast - Prospeo's enrichment API does exactly this with a 92% match rate and 98% email accuracy on a 7-day refresh cycle. After Snyk's 50 AEs started using it for prospecting data, bounce rates dropped from 35-40% to under 5% and AE-sourced pipeline jumped 180%.
Pipeline accuracy starts at the top of the funnel. Prospeo's 98% email accuracy and 30% mobile pickup rate mean your reps spend time on real conversations - not chasing bounces that inflate coverage ratios and tank your forecast.
Clean data in, reliable forecast out. That's the math.
FAQ
How many stages should a deals pipeline have?
Five to seven for most B2B teams. Fewer than five and you can't identify where deals stall; more than seven and reps stop updating stages accurately. Start with five stages mapped to buyer milestones and only add a stage when you can prove a measurable bottleneck exists between two existing ones.
What's the difference between a pipeline and a sales funnel?
A pipeline is the seller's view - where deals sit in your process, tracked by activities and stage progression. A funnel is the buyer's view - how prospects convert from awareness to purchase, measured by conversion rates at each level. Pipeline tracks what your team does; funnel tracks how buyers respond.
How do you calculate pipeline coverage ratio?
Total pipeline value divided by your sales target. A $400K pipeline against a $100K quota gives 4x coverage. Enterprise teams typically need 3-5x given 15-25% win rates, while SMB teams can operate at 2-3x because shorter cycles improve close rates.
When should you remove a deal from the pipeline?
Remove it when there's no confirmed next step, no real date, or the contact is unreachable. Deals with close dates pushed three or more times should be closed-lost. Holding dead deals inflates your coverage ratio and produces inaccurate forecasts - smaller, cleaner pipelines consistently outperform bloated ones.
How does contact data quality affect pipeline accuracy?
Stale data silently corrupts every downstream metric. Deals attached to bounced emails or disconnected numbers look active but are actually dead, inflating coverage and forecast numbers. A 7-day data refresh cycle catches these before they compound - compared to the 6-week industry average, that's the difference between a pipeline you can trust and one that's lying to you every Monday morning.