Firmographics Meaning: Definition, Variables, and How B2B Teams Use Them
B2B contact data decays 30-70% per year. That means the firmographic data you pulled last quarter - headcount, revenue, industry codes - is already degrading. If your Ideal Customer Profile model runs on stale inputs, everything downstream breaks quietly: sequences hit the wrong accounts, territory plans miss, and pipeline forecasts turn into fiction.
So what does "firmographics" actually mean in practice? It's the set of characteristics used to classify and segment businesses, the same way demographics classify individuals. But understanding the definition is the easy part. Using firmographic data well - keeping it fresh, scoring it properly, layering in timing signals - is where most B2B teams fall short. Let's fix that.
Quick Version
Firmographics = the attributes used to classify and segment businesses, just as demographics classify individuals.
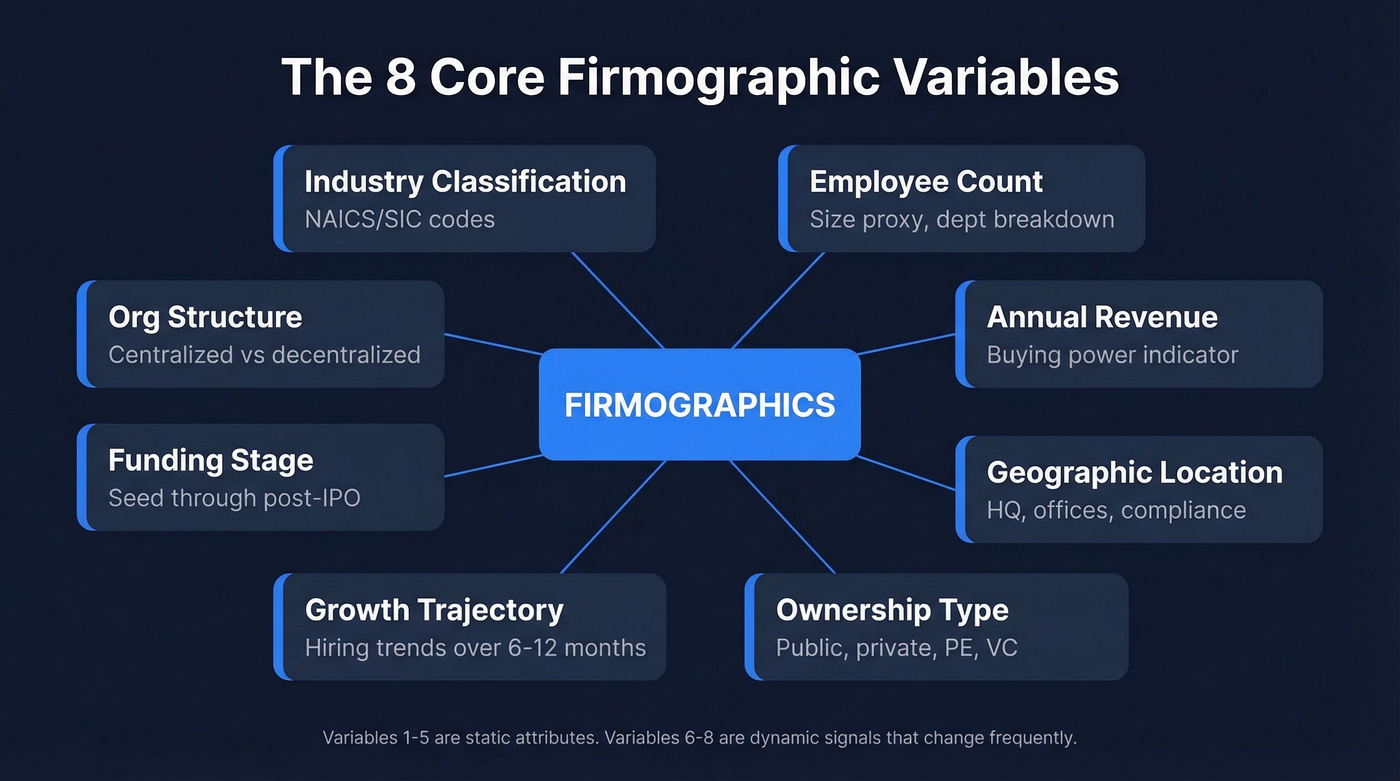
The 8 core variables:
- Industry (NAICS/SIC codes)
- Employee count
- Annual revenue
- Geographic location
- Ownership type
- Growth trajectory
- Funding stage
- Organizational structure
The key insight: Firmographics tell you fit (does this company match your ICP?), but not timing (are they ready to buy?). You need intent signals for that.
Need firmographic data now? Skip to the provider comparison.
The Core Definition
Firmographics are to companies what demographics are to people. Where demographics describe an individual's age, income, and location, firmographics describe an organization's industry, revenue, headcount, and structure. In a B2B context, the term covers any data point that describes a business entity rather than an individual person.
The concept has deeper roots than most marketers realize. Industrial segmentation dates back to the 1930s, but the modern framework comes from Bonoma and Shapiro's 1984 nested segmentation model - they proposed that B2B markets should be segmented in layers, starting with broad firmographic characteristics like industry and company size, then narrowing toward operating variables, purchasing approaches, and finally buyer-specific factors. That layered logic still underpins how many ICP models get built today.
In practice, firmographics are the first filter every B2B team applies. Before you care about a prospect's tech stack, buying committee, or content consumption patterns, you need to know whether the company is the right size, in the right industry, and in a geography you can serve. That's the definition put into action.
Five Key Firmographic Questions
Before building any target account list, answer these:
- What industry does this company operate in?
- How many employees do they have - and is that number growing or shrinking?
- What's their annual revenue range?
- Where are they headquartered, and do they have offices in regions you serve?
- What's their ownership structure - public, private, PE-backed, or VC-funded?
If you can't answer all five with current data, your segmentation has holes.
Why Firmographic Data Matters
Here's a scenario we've seen play out more times than we'd like. Marketing handed sales 500 "ideal fit" accounts. Six months later, pipeline from that list was zero. The accounts looked right on paper - right industry, right size, right geography. But the headcount data was 18 months old, half the companies had been acquired, and nobody checked whether any of them were actually in-market.
Poor data quality costs organizations an estimated $15M annually - not just bounced emails, but misallocated rep time, botched territory plans, and pipeline forecasts built on fiction.
Teams that invest in accurate firmographic targeting see the opposite: 73% larger deal sizes, 5-8x ROI growth, and 25% higher sales productivity. HBR research backs this up too - data-driven sales and marketing teams achieve 10-20% revenue growth on average. Those numbers make sense. Reps who spend time on companies that actually fit the ICP close bigger deals faster than reps spraying outbound at a generic list.
Firmographic data is only as valuable as it is fresh. A company that was 50 employees when you added it to your CRM might be 200 employees now - or might have laid off half its team. The refresh cycle of your data source matters more than the size of its database.
The 8 Core Variables
Not all firmographic variables carry equal weight. Most ICP models lean heavily on industry and employee count, with revenue and geography as close seconds. Modern B2B teams also track dynamic company signals - funding rounds, hiring surges, layoff patterns - alongside core firmographics to keep targeting aligned with what's actually changing.
Here are the eight variables you'll find in most B2B segmentation frameworks.
1. Industry classification. The broadest filter. A company selling marketing automation to healthcare has a fundamentally different GTM motion than one selling to SaaS. Use standardized NAICS and SIC codes for consistency across data sources.
2. Employee count. The most common proxy for company size. For more precision, look at departmental composition - a company with 200 employees but only 3 in marketing tells a different story than one with a 30-person marketing team.
| Segment | Headcount | Typical Label |
|---|---|---|
| Micro | <10 | Solopreneur/startup |
| Small | 10-50 | SMB |
| Medium | 50-250 | Mid-market |
| Large | 250+ | Enterprise |
3. Annual revenue. A better indicator of buying power than headcount, but harder to get right. Private-company revenue is often estimated and can be wildly inaccurate. Cross-reference across sources before building scoring models on revenue data alone.
| Revenue Band | Typical Segment |
|---|---|
| <$1M | Early-stage / micro |
| $1M-$10M | SMB |
| $10M-$50M | Mid-market |
| $50M-$250M | Upper mid-market |
| $250M+ | Enterprise |
4. Geographic location. Determines territory assignment, compliance requirements under GDPR compliant or CCPA, language, and time zones. HQ location matters, but so do office locations for multi-site companies.
5. Ownership type. Public, private, PE-backed, VC-funded, government, nonprofit. Each has different buying behaviors, budget cycles, and procurement processes. A PE-backed company in cost-cutting mode behaves nothing like a Series B startup in growth mode.
6. Growth trajectory. Is the company hiring aggressively, flat, or contracting? Headcount growth over 6-12 months is a useful signal to prioritize accounts that are expanding fast.
7. Funding stage. Seed, Series A through D, bootstrapped, or post-IPO. A Series B SaaS company has different needs and budget than a bootstrapped one at the same headcount.
8. Organizational structure. Centralized vs. decentralized decision-making, number of subsidiaries, divisional vs. functional. This affects deal complexity and who you need in the buying committee.
Stale firmographics break your ICP model. Prospeo refreshes 300M+ profiles every 7 days with 30+ filters - industry, headcount growth, funding stage, revenue, and department size - so your segmentation stays accurate.
Filter by every firmographic variable in this article for $0.01 per lead.
Firmographics vs. Other B2B Data Types
Firmographic data is essential, but it's only one layer.
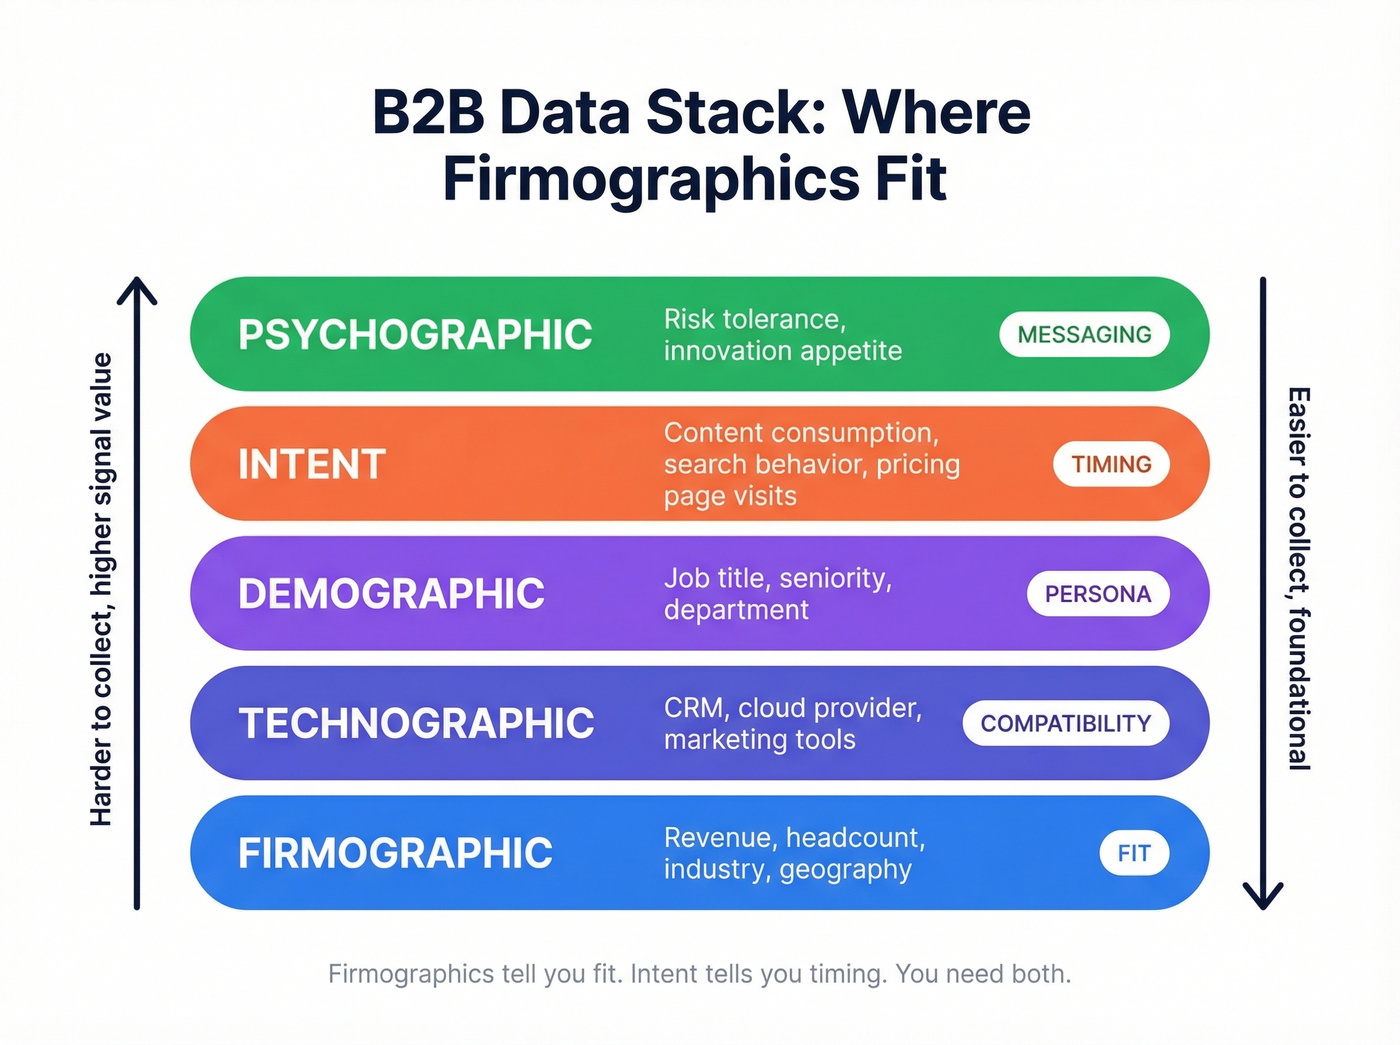
| Data Type | Focus | Examples | Purpose |
|---|---|---|---|
| Firmographic | Company identity | Revenue, headcount, industry | ICP fit, segmentation |
| Technographic | Tech stack | CRM, cloud, CMS, security tools | Competitive displacement, integration fit |
| Demographic | Individual traits | Job title, seniority, department | Persona targeting |
| Intent | Buying signals | Content consumption, search behavior | Timing, prioritization |
| Psychographic | Motivations | Risk tolerance, innovation appetite | Messaging, positioning |
Firmographic data typically comes from government databases, public filings like SEC disclosures, and data vendors. Technographic data flows from software catalogs, job posts, and install tracking. Intent data comes from platforms like Bombora and 6sense.
The critical distinction: firmographics confirm basic fit but rarely indicate buying readiness. A 200-person SaaS company in your target industry might be a perfect ICP match - but if they just signed a 3-year contract with your competitor, firmographics alone won't tell you that.
We've seen teams over-index on firmographic fit and wonder why conversion rates stay flat. The answer is almost always timing. Layer intent signals on top of firmographic fit, and suddenly your prioritization model actually works.
How to Build Your ICP With Firmographics
Analyze Closed-Won Deals
Start with data you already have. Pull 50-100 closed-won deals from the last 12-18 months and look for firmographic clusters. Which industries show up most? What's the median headcount? Revenue range? Geography?
You're looking for your beachhead - the segment where you win most consistently. A useful heuristic: if 30%+ of your customers in a segment came from referrals, that's a strong indicator of product-market fit there.
Once you've identified clusters, define tier thresholds. Not every company that fits your ICP is equally valuable. And validate quarterly - the clusters that mattered six months ago may have shifted.
Score With a 100-Point Rubric
Here's a scoring template we've used with multiple teams. It separates account-level fit from timing signals:
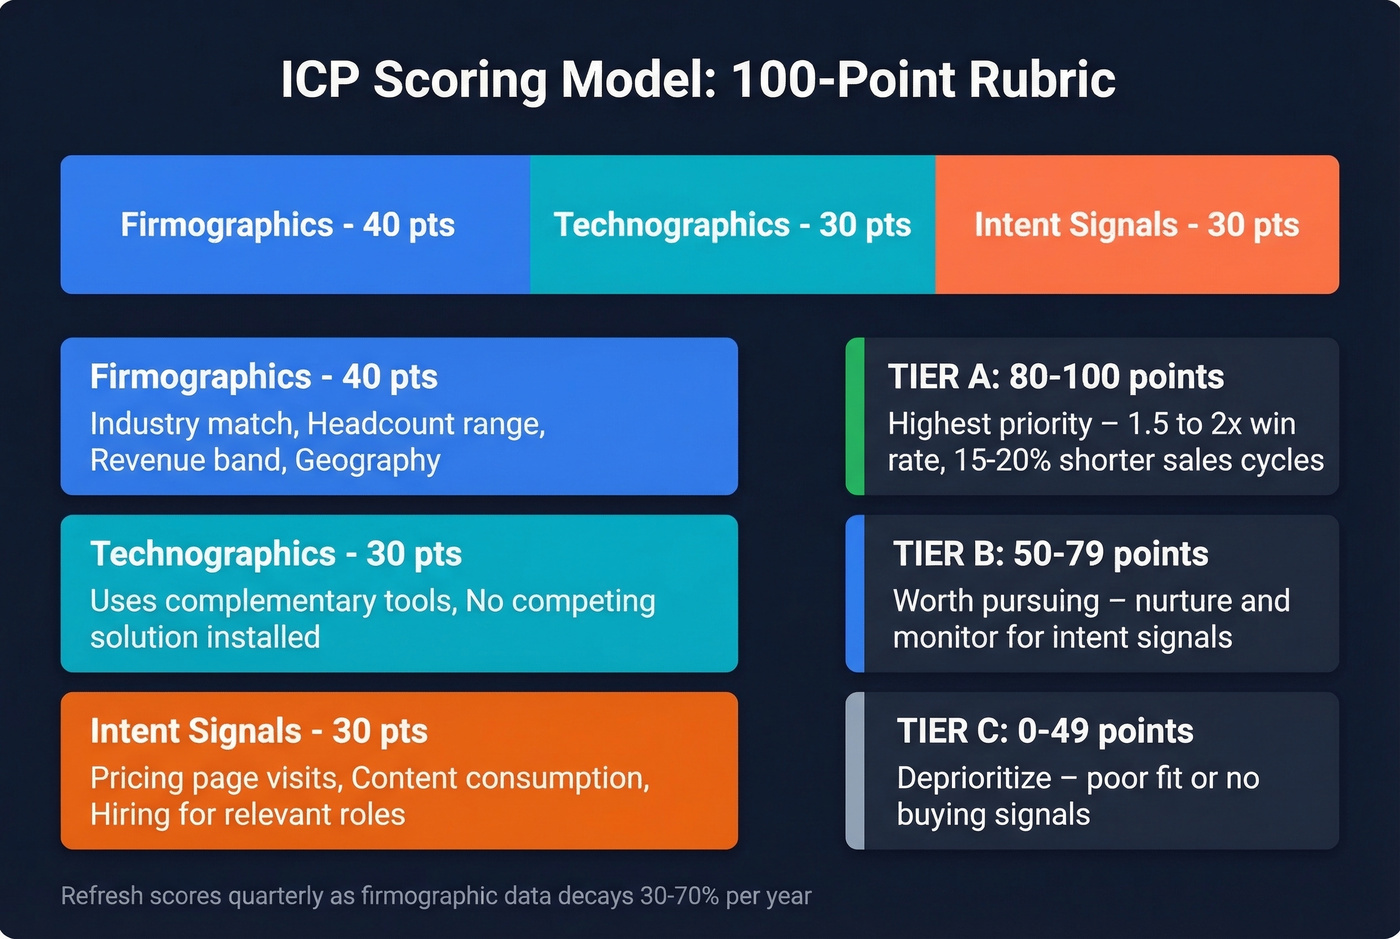
| Category | Weight | Criteria |
|---|---|---|
| Firmographics | 40 pts | Industry match, headcount range, revenue band, geography |
| Technographics | 30 pts | Uses complementary tools, no competing solution installed |
| Intent Signals | 30 pts | Pricing page visits, content consumption, hiring for relevant roles |
Tier thresholds: A = 80-100, B = 50-79, C = 0-49. Top-performing teams see Tier A win rates 1.5-2x higher than Tier B, with 15-20% shorter sales cycles.
Look, if your average deal is under $10K, you probably don't need a $30K data platform. A self-serve tool with accurate firmographic data and a fast refresh cycle will outperform an enterprise suite you're only using at 20% capacity. Spend the savings on reps, not software.
Firmographic Segmentation: A Worked Example
Your SDR just spent three hours building a target account list, and half the company-size data is wrong. Here's how to avoid that.
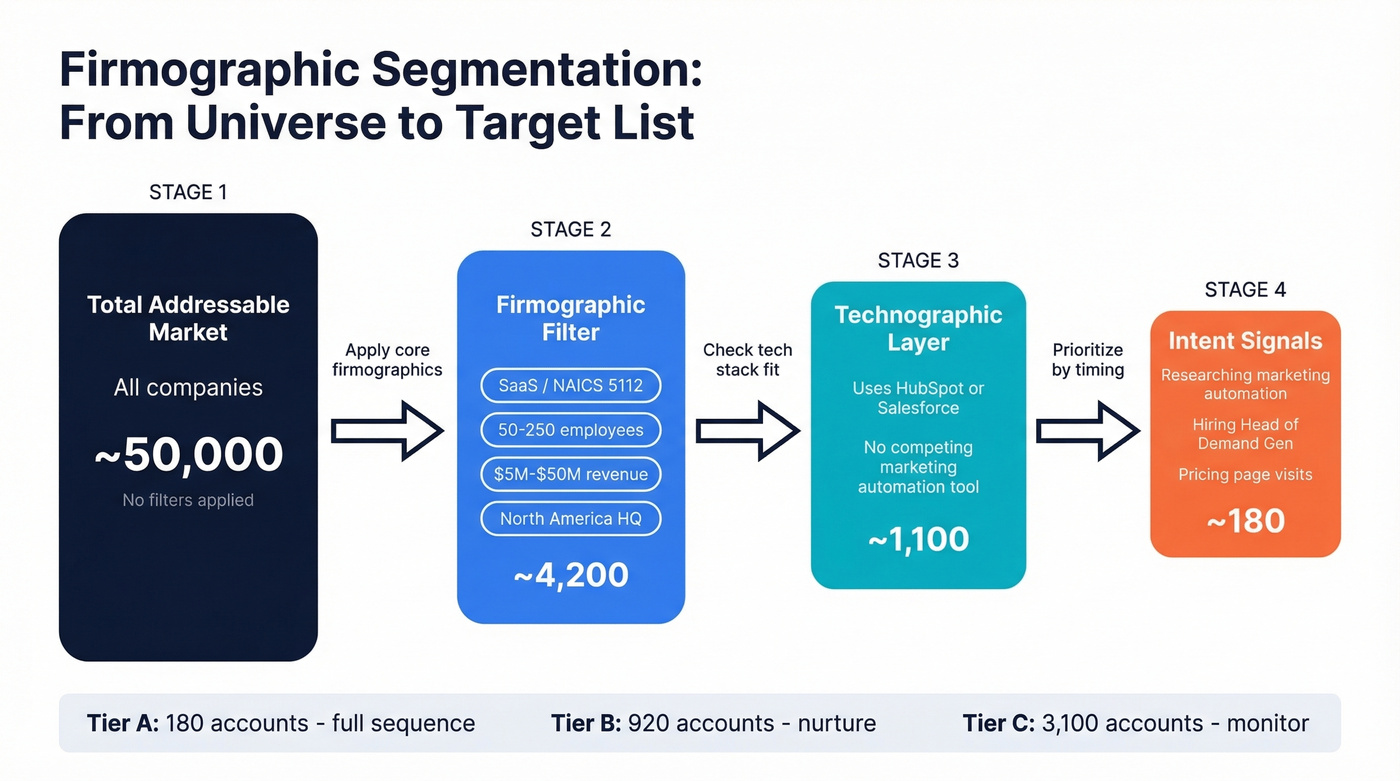
Say you sell marketing automation to mid-market SaaS companies. Start with firmographic filters:
- Industry: SaaS / software, NAICS 5112
- Headcount: 50-250 employees
- Revenue: $5M-$50M
- HQ: North America
That gives you your Tier A universe. Now layer in technographics - do they use HubSpot or Salesforce? Are they running a competing marketing automation tool, or cobbling together point solutions? That moves companies between Tier A and Tier B.
Finally, add intent. Which of these companies are actively researching marketing automation? Who just posted a "Head of Demand Gen" job? Who raised a Series B last month? Those are your Tier A accounts with timing alignment - the ones your SDRs should be calling today, not next quarter.
Without clean data, your SDR just wasted three hours building a list that'll underperform. Data quality isn't a nice-to-have. It's the thing that makes firmographic segmentation work or not.
Where to Get Firmographic Data
Options range from free government databases to enterprise platforms that run $30K-$100K+/year. Here's how the major providers stack up.
Prospeo
Prospeo covers 300M+ professional profiles with 143M+ verified emails and 125M+ verified mobile numbers. The 30+ search filters include industry, headcount growth, revenue, funding stage, and technographics - so you can build the exact ICP segments described above without leaving the platform. It also layers intent data across 15,000 topics via Bombora, combining firmographic fit with in-market signals in a single workflow.
The standout differentiator is the 7-day data refresh cycle. Most of the category runs on roughly a 6-week refresh cycle, which means the headcount and revenue data you're scoring against can already be stale by the time you use it. Email accuracy runs 98%, and the enrichment API returns 50+ data points per contact at a 92% match rate.
Pricing is self-serve and transparent: the free tier gives you 75 emails per month, paid plans run about $0.01 per email. No annual contracts, no sales calls required.
Use this if you want accurate firmographic data with weekly freshness and don't want to negotiate an enterprise contract. Skip this if you need a full ABM orchestration suite built for large-scale program management.

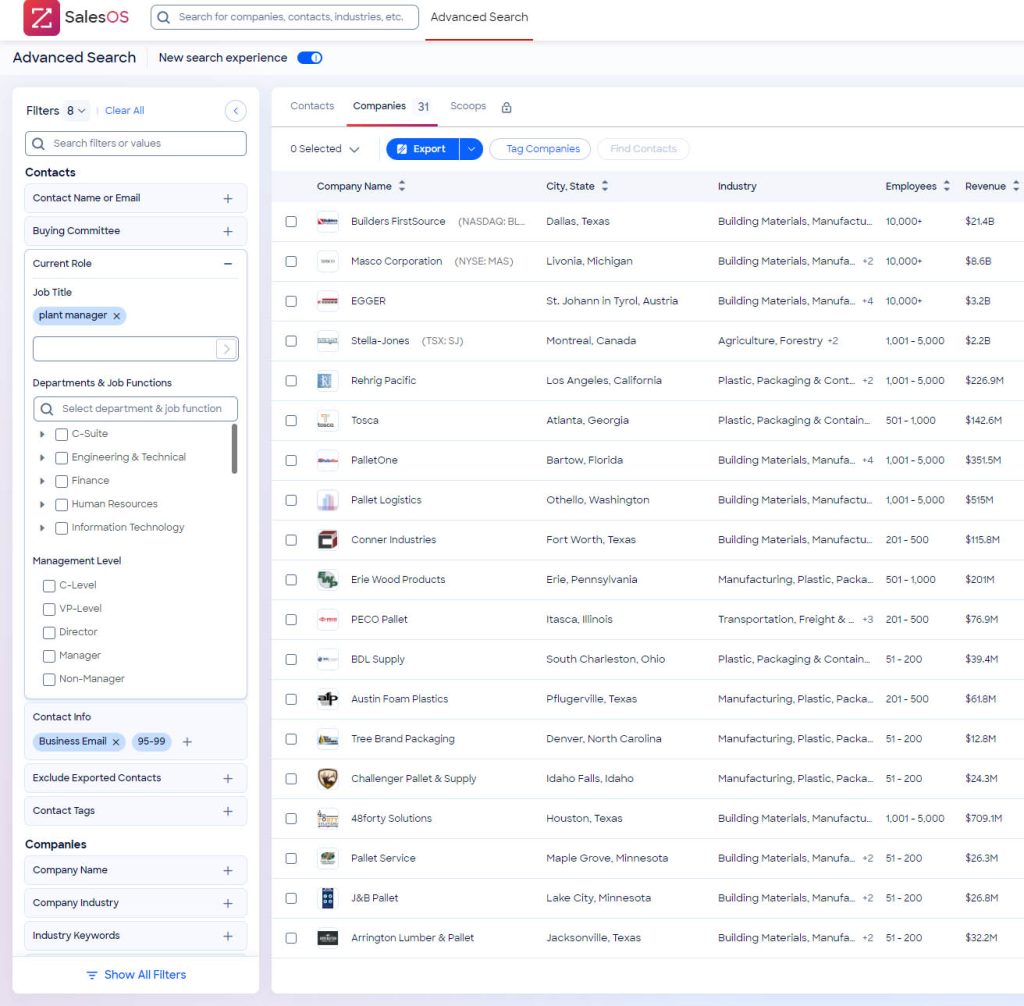
ZoomInfo
ZoomInfo is the incumbent - 110M+ companies, 410M+ contacts, and one of the deepest datasets in the category. AI-driven data prediction helps fill gaps across core firmographic fields, which is valuable when you're trying to standardize messy company records.
ZoomInfo wins on sheer database depth in the US, plus enterprise-grade coverage for large GTM teams. Where it falls short: refresh cycles often run around 6 weeks, and the consensus on r/sales is that pricing is painful. A mid-market contract typically runs $15,000-$40,000/year, and that's before you add intent data or mobile number modules.
Use this if you're running a 50+ person GTM org that'll actually use the full platform. Skip this if you're a Series A company that just needs accurate firmographic data - you'll pay for features you won't touch.
Apollo.io
Apollo covers 275M+ contacts across 73M+ companies and offers something rare in this space: a genuinely useful free tier. Paid plans start at $49/user/month, and the platform includes built-in email sequencing - so you can go from firmographic search to outbound campaign without switching tools.
Use this if you're a small team that needs volume and speed over precision. Skip this if data accuracy is critical to your workflow. Reddit threads consistently mention Apollo carrying a lot of outdated records. For firmographic segmentation, stale headcount and revenue data means your scoring model is working with noise. Good for getting started; plan to graduate when accuracy starts mattering.
Full Provider Comparison
| Provider | Database Size | Strengths | Best For | Starting Price |
|---|---|---|---|---|
| Prospeo | 300M+ profiles | 98% accuracy, 7-day refresh, 30+ filters | Accuracy on a budget | Free; ~$0.01/email |
| ZoomInfo | 110M+ companies | Largest US database, AI predictions | Enterprise GTM teams | ~$15K-$40K/yr |
| Apollo.io | 73M+ companies | Free tier, built-in sequencing | Small teams moving fast | $49/user/mo |
| Cognism | 400M+ contacts | EMEA depth, GDPR compliance | European-focused teams | ~$1K-$3K/mo |
| Clearbit (Breeze) | 44M+ companies | HubSpot native, low setup | HubSpot shops | Included w/ HubSpot |
| Lusha | 100M+ profiles | Simple UI, quick lookups | Individual prospecting | $29.90/mo |
| Crustdata | 60M+ companies | Real-time updates, API-first | Engineering-led data teams | ~$500-$2K/mo |
| 6sense | 1T+ signals/day | ABM orchestration, predictive | Full-stack ABM at scale | ~$30K-$100K+/yr |
Cognism is the go-to for EMEA-heavy teams, with strong GDPR compliance and particular depth in European markets. Custom pricing typically lands at $1,000-$3,000/month. It beats ZoomInfo on European data quality and phone-verified mobile numbers; ZoomInfo still wins on US database depth. If your target market is primarily European, Cognism is the better investment.
Clearbit (now Breeze Intelligence) is the path of least resistance if you're already on HubSpot. It's included with HubSpot Starter+, handles firmographic enrichment natively, and requires minimal setup. It won't match the depth of standalone providers - the 44M company database is significantly smaller - but for HubSpot shops that need basic enrichment without another vendor relationship, it's hard to argue against free.
Lusha is a simple, affordable starting point at $29.90/month with 100M+ profiles and a clean UI. Best for quick individual lookups rather than bulk enrichment.
Crustdata takes an API-first approach with real-time updates. Expect roughly $500-$2,000/month based on API volume - built for engineering teams that want to own the data pipeline.
6sense is an enterprise ABM platform processing 1T+ signals daily. Pricing starts around $30,000/year and scales well past $100K. Overkill if you just need firmographic data; this is for teams running full-stack ABM orchestration with predictive scoring.
This article makes the case: firmographics show fit, but intent shows timing. Prospeo layers both - 30+ firmographic filters plus Bombora intent data across 15,000 topics - so you target companies that fit your ICP and are actively in-market.
Stop guessing fit and timing separately. Get both in one platform.
Common Pitfalls
Data decay is relentless. That 30-70% annual decay rate means a list you built in January is significantly degraded by summer. If your provider refreshes on a 6-week cycle, you're always working with partially stale data. Quarterly audits are the minimum; weekly refresh cycles are the gold standard.
Private-company revenue is unreliable. Most providers estimate revenue for private companies using models, not actual financials. These estimates can be wildly off - we've seen ranges that were 3x too high or 50% too low. Don't build hard scoring thresholds around revenue data unless you've cross-referenced it across multiple sources.
Stale headcount misleads. A company listed at 150 employees might have doubled or halved since the last update. Headcount growth rate is often more useful than static headcount - it tells you direction, not just position.
Firmographics without intent is fit without timing. This is the most common mistake we see. Teams build beautiful ICP models based on firmographic data, then wonder why outbound conversion rates are mediocre. You've identified who could buy, but not who's ready to buy. Layer in intent signals or you're just sending well-targeted emails to people who don't care yet.
Pricing opacity wastes time. Real talk: you shouldn't need a 45-minute demo to find out if a data tool fits your budget. Self-serve platforms with transparent pricing are gaining ground for a reason.
FAQ
What's the difference between firmographics and demographics?
Demographics describe individuals - age, income, education, marital status. Firmographics describe organizations - revenue, headcount, industry, ownership type. They're the B2B equivalent of demographics, applying the same segmentation logic to companies instead of people.
What are the most important firmographic variables?
Industry, employee count, and annual revenue carry the most weight in most ICP models. The full set of eight also includes geographic location, ownership type, growth trajectory, funding stage, and organizational structure.
How often should firmographic data be refreshed?
At minimum, quarterly - B2B data decays 30-70% per year. The best providers refresh weekly on a 7-day cycle; many competitors run on roughly 6-week intervals. Stale data directly erodes pipeline quality and scoring accuracy.
Can firmographics alone predict buying intent?
No. Firmographics identify fit - whether a company matches your ICP - but not timing. Layer intent signals like content consumption, hiring patterns, and funding events on top of firmographic fit for accurate prioritization.
What is firmographic segmentation?
Firmographic segmentation divides a market of businesses into groups based on shared company-level attributes like industry, size, revenue, and location. It lets sales and marketing teams focus only on accounts matching their ICP rather than pursuing every company that vaguely resembles a prospect.