Forecast Accuracy Metrics: Which Ones Matter and Which Ones Lie
Your VP sees 82% forecast accuracy on the dashboard and calls it a win. Meanwhile, stockouts rose 15% last quarter and the warehouse is drowning in safety stock for products nobody ordered. The number isn't wrong - it's measuring the wrong thing at the wrong level.
Most teams pick their forecast accuracy metrics once, never revisit them, and spend years optimizing a score that doesn't reflect operational reality. That's expensive.
What You Need (Quick Version)
Track WMAPE and Bias. WMAPE gives you volume-weighted error that reflects actual business impact - a miss on your top SKU matters more than a miss on a product you sell three units of per month. Bias tells you whether you're systematically over- or under-forecasting, the kind of error that compounds into real inventory and revenue problems. Everything else below is a refinement for specific contexts.
What Is Forecast Accuracy?
Forecast accuracy measures how close predictions land to what actually happened. Error is the raw gap: e = y - ŷ. Accuracy is typically 1 minus some error percentage. Bias is the directional tendency - consistently too high or too low?
Always evaluate on out-of-sample data. A model that fits history perfectly but can't predict next month is useless. Out-of-sample evaluation tells you how well a model actually forecasts; in-sample fit tells you how well it memorized the past.
Core Formulas and When to Use Each
MAE and RMSE
MAE (Mean Absolute Error) = mean(|e|). It's the average size of your misses, ignoring direction. RMSE = √mean(e²), which penalizes large errors more heavily because it squares them first.
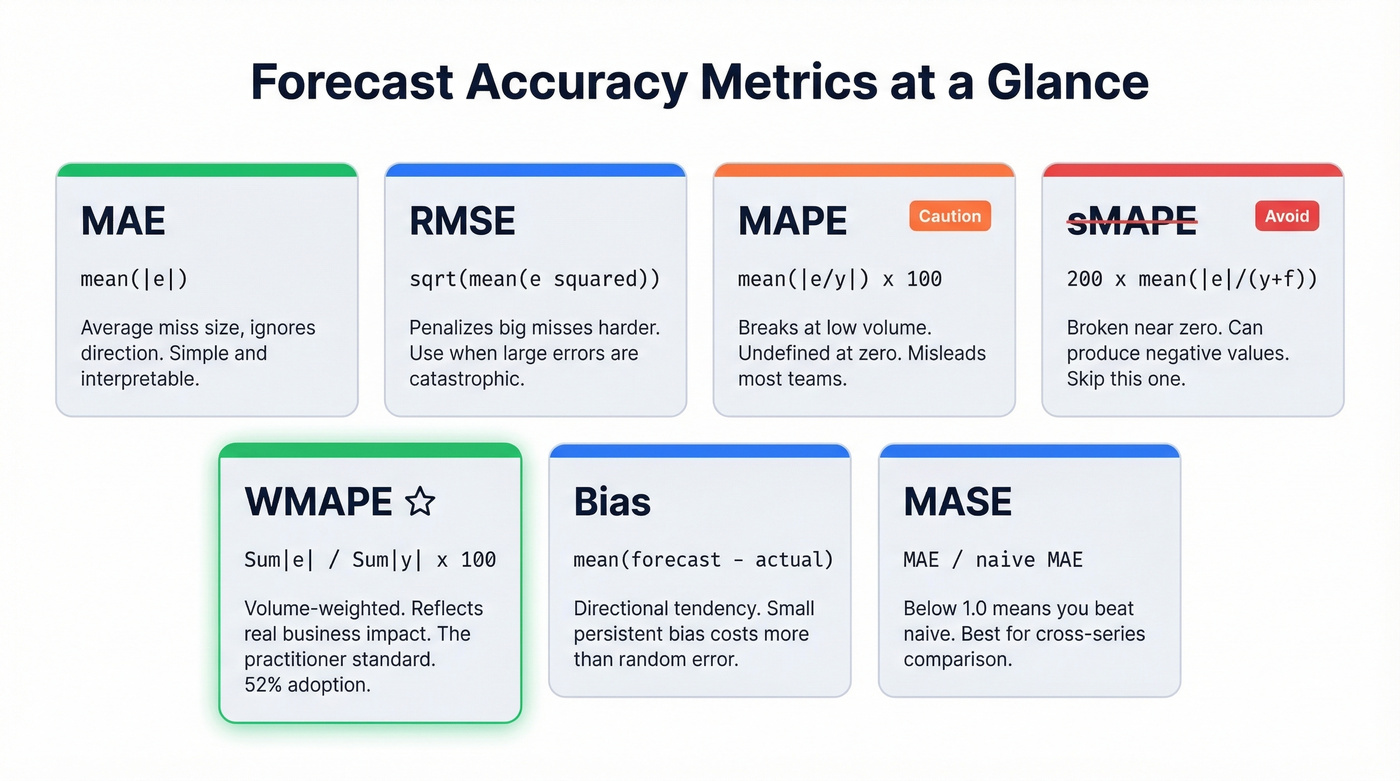
Minimizing MAE pushes your forecast toward the median outcome. Minimizing RMSE pushes toward the mean. If occasional big misses are catastrophic - perishable goods, capacity-constrained manufacturing - RMSE is the better guardrail. For general tracking, MAE is simpler and more interpretable.
MAPE - And Why It Misleads
MAPE = mean(|actual - forecast| / |actual|) × 100%.
When actual demand is zero, MAPE is undefined. When demand is low, a small absolute error produces an absurd percentage: a product selling 2 units with a forecast of 4 registers 100% error for a 2-unit miss, while a product selling 1,000 units with a 50-unit miss registers 5%. That's not a rounding issue. That's a metric lying to you about where the real problems are.
Hyndman's textbook flags another problem: MAPE penalizes negative errors more than positive ones, creating asymmetric distortion most practitioners never notice. If your demand includes any low-volume items, MAPE will mislead you.
sMAPE - Skip This One
sMAPE was designed to address MAPE's issues but introduced worse problems. Hyndman's textbook (citing Hyndman & Koehler, 2006) notes it's still unstable near zero and can even produce negative values - nonsensical for an error metric. Any tool defaulting to sMAPE is using a broken metric. Move on.
WMAPE - The Practitioner Standard
WMAPE = Σ|actual - predicted| / Σ|actual| × 100%
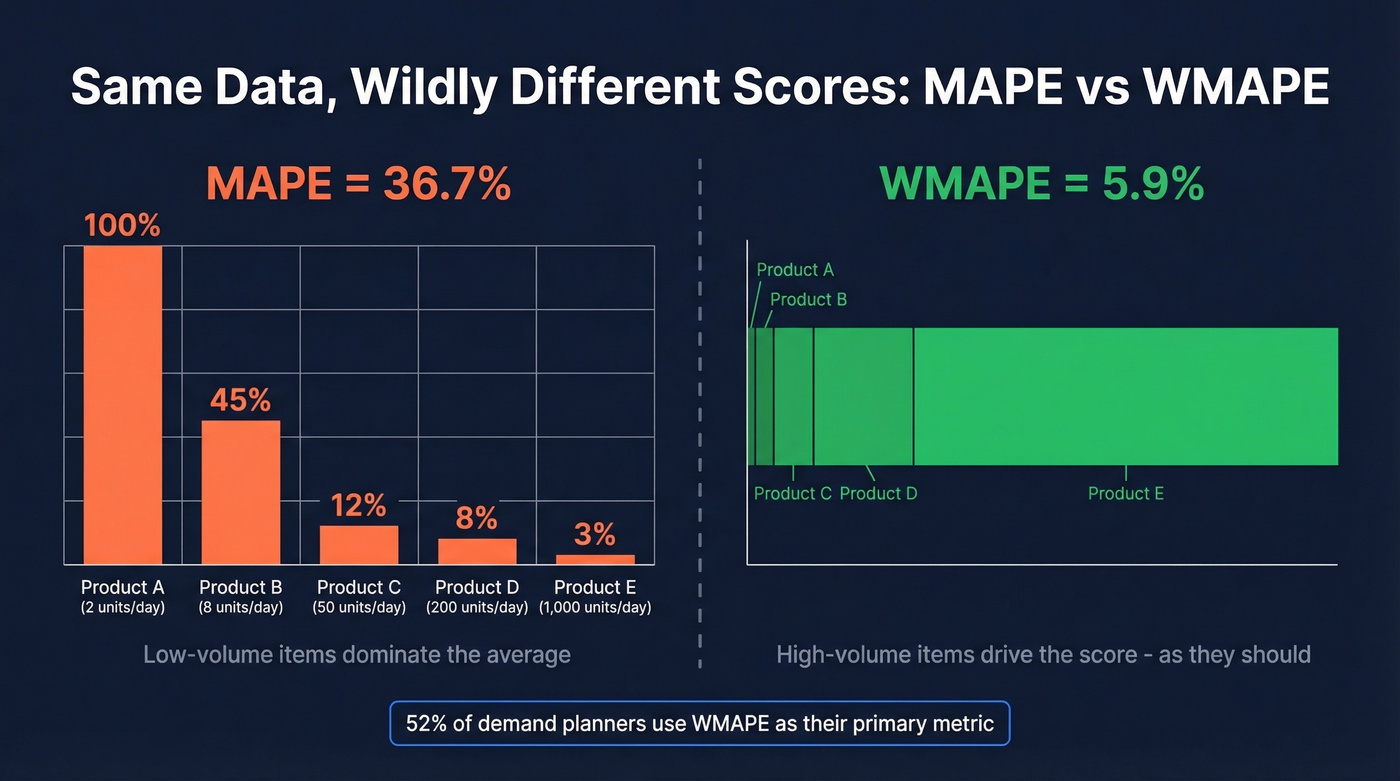
This is the metric that reflects business impact. Instead of averaging percentage errors equally across all items, WMAPE weights by actual volume. High-volume products drive the score.
The divergence is dramatic. On the same dataset, MAPE can show 36.7% error while WAPE shows just 5.9% - a single low-volume day with 100% error inflates MAPE while barely moving the volume-weighted number.
52% of demand planning professionals use WMAPE as their primary metric. It's the standard in CPG, retail, and multi-SKU environments. If you're picking one metric, this is it.
Quick Python calculation:
wmape = np.sum(np.abs(actual - forecast)) / np.sum(np.abs(actual)) * 100
One refinement worth considering: standard WMAPE weights by volume, but you can weight by revenue or margin instead. A 20% miss on a high-margin SKU costs more than a 20% miss on a commodity item at the same volume.
WMAPE is symmetric - it doesn't distinguish over-forecasting (excess inventory) from under-forecasting (lost sales). That's why you pair it with Bias.
Bias / Mean Forecast Error
Bias = mean(forecast - actual).
Positive bias means consistent over-forecasting. Negative means under-forecasting. Here's the thing: even a small persistent bias can cost more than larger random error because bias compounds. Random errors cancel out over time. Bias doesn't - it systematically pushes inventory in the wrong direction, period after period.
Track bias alongside WMAPE using a tracking signal (cumulative forecast error ÷ MAE). When the signal exceeds your threshold, something structural has changed.
MASE - For Cross-Series Comparison
MASE divides your forecast's MAE by the in-sample MAE of a naive benchmark. Below 1.0 means you're beating the naive approach. Above 1.0 means a simple "repeat last period" forecast would've been better.
MASE solves the cross-series comparison problem that plagues percentage metrics. You can meaningfully compare a MASE score for a product selling 50 units/month against one selling 50,000 - something MAPE can't do. Hyndman recommends MASE as the primary alternative to MAPE for this reason.
Metric Comparison Table
| Metric | Formula | Best For | Avoid When | Notes |
|---|---|---|---|---|
| MAE | mean(|e|) | General tracking | Need % context | Scale-dependent |
| RMSE | √mean(e²) | Penalizing big misses | Outlier-prone data | Sensitive to spikes |
| MAPE | mean(|e/y|)×100 | Stable, high-vol items | Low/zero demand | Distorts at low vol |
| sMAPE | 200×mean(|e|/(y+ŷ)) | Nothing - avoid | Always | Broken near zero |
| WMAPE | Σ|e|/Σ|y|×100 | Multi-SKU portfolios | Single-item tracking | 52% adoption |
| Bias | mean(ŷ-y) | Directional error | Need magnitude only | Pair with WMAPE |
| MASE | MAE / naive MAE | Cross-series comparison | No historical data | <1.0 = beats naive |
Probabilistic Metrics: CRPS and Pinball Loss
Point forecasts give you a single number. Probabilistic forecasts give you a distribution - and point metrics can't evaluate distributions properly. We've seen teams where MAE actually rewarded conservative, variance-collapsing forecasts even when the tails were what mattered for inventory decisions.
CRPS is a proper scoring rule for probabilistic forecasts. It compares the forecast distribution (via its CDF) to what actually happened, and lower is better. When your forecast collapses to a point estimate, CRPS reduces to MAE.
Pinball loss evaluates specific quantiles. At α=0.95, it penalizes under-prediction more than over-prediction - useful when you're setting safety stock at the 95th percentile. The asymmetric weighting lets you tune the penalty to match your actual cost structure.
Intermittent Demand
Spare parts, long-tail retail, specialty chemicals - these share a pattern: long stretches of zero demand punctuated by occasional spikes. MAPE is undefined when actuals are zero. MAE and RMSE can reward an always-zero forecast because the median demand is often zero. Statistically optimal, operationally useless.
MAAPE uses an arctangent transformation to damp extreme percentage errors and handles zeroes gracefully. For probabilistic intermittent models, CRPS works well. But for intermittent demand, always pair any forecast metric with inventory outcome metrics - cycle service level, fill rate, stockout frequency. The forecast metric tells you how good the prediction is. The inventory metric tells you whether it matters.
Forecast accuracy starts upstream. If your pipeline is built on unverified contacts and stale data, every revenue forecast inherits that error. Prospeo's 98% email accuracy and 7-day data refresh cycle eliminate the dirty-data bias that compounds into missed forecasts quarter after quarter.
Clean inputs, accurate forecasts. Start with data you can trust.
The Aggregation Trap
Your exec dashboard shows 88% accuracy at the portfolio level. Green across the board. But at the SKU-location level, half your products are over-forecast by 30% and the other half are under-forecast by 25%. The overs and unders cancel out, producing a number that looks great while warehouses are simultaneously overstocked and out of stock.
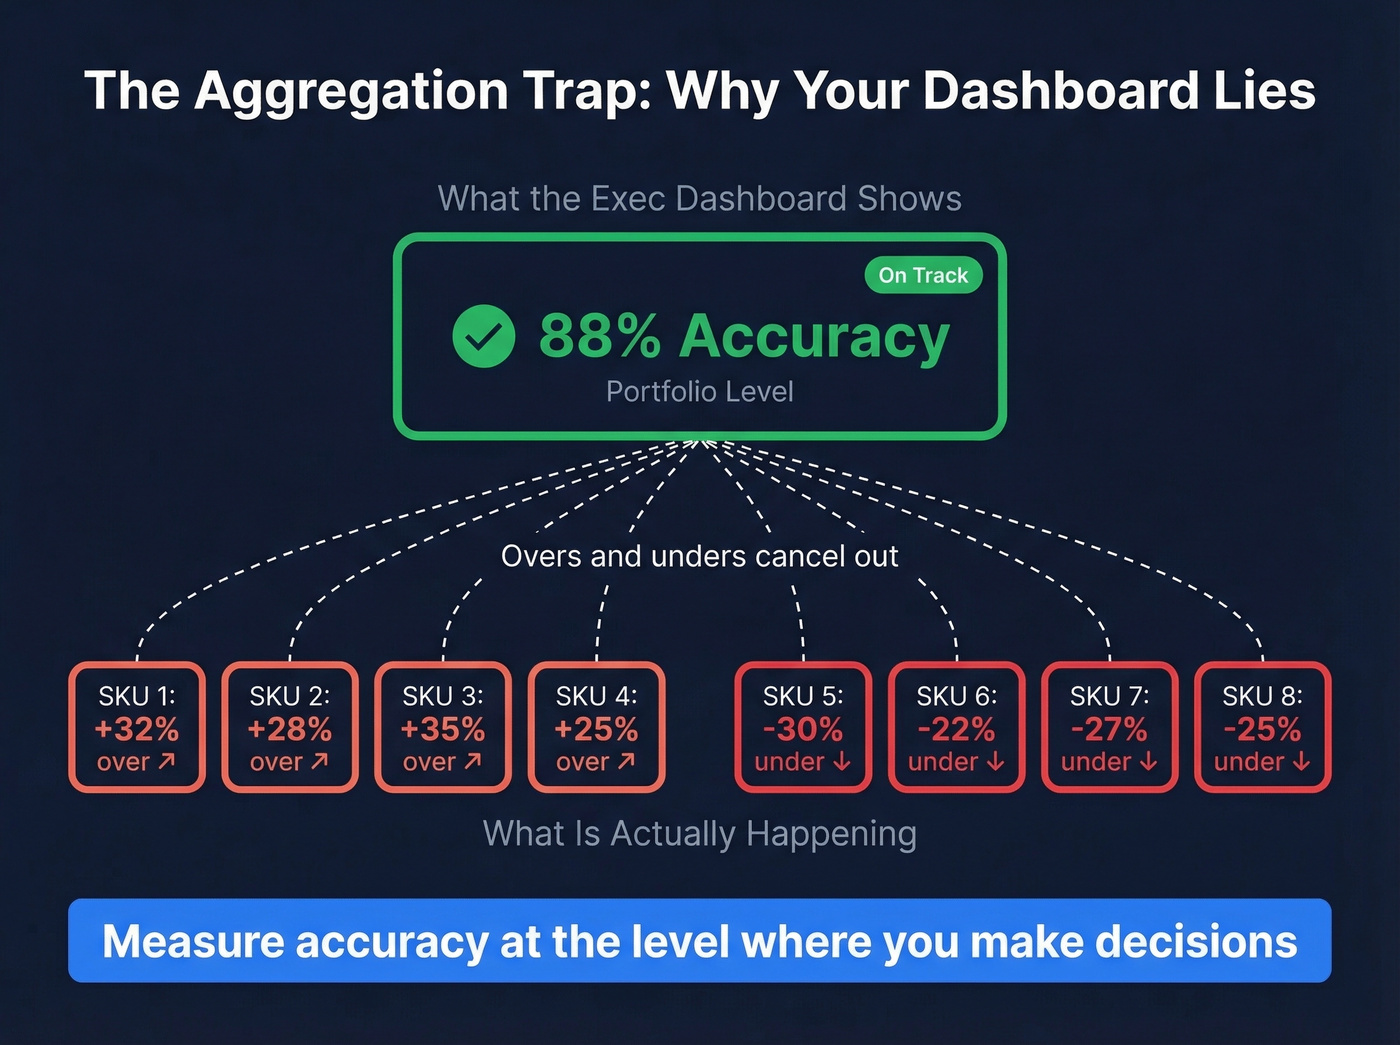
We've watched this exact scenario play out at three different companies - the dashboard was green, the warehouse was on fire.
This is a common complaint on r/supplychain about forecast accuracy reporting. The fix: measure accuracy at the level where you make decisions. If you replenish at the SKU-DC level, measure there. Roll up for reporting, but never let the rollup replace the operational metric.
Benchmarks by Context
A single accuracy target like "85%" is meaningless without context.
| Context | Error Range | Notes |
|---|---|---|
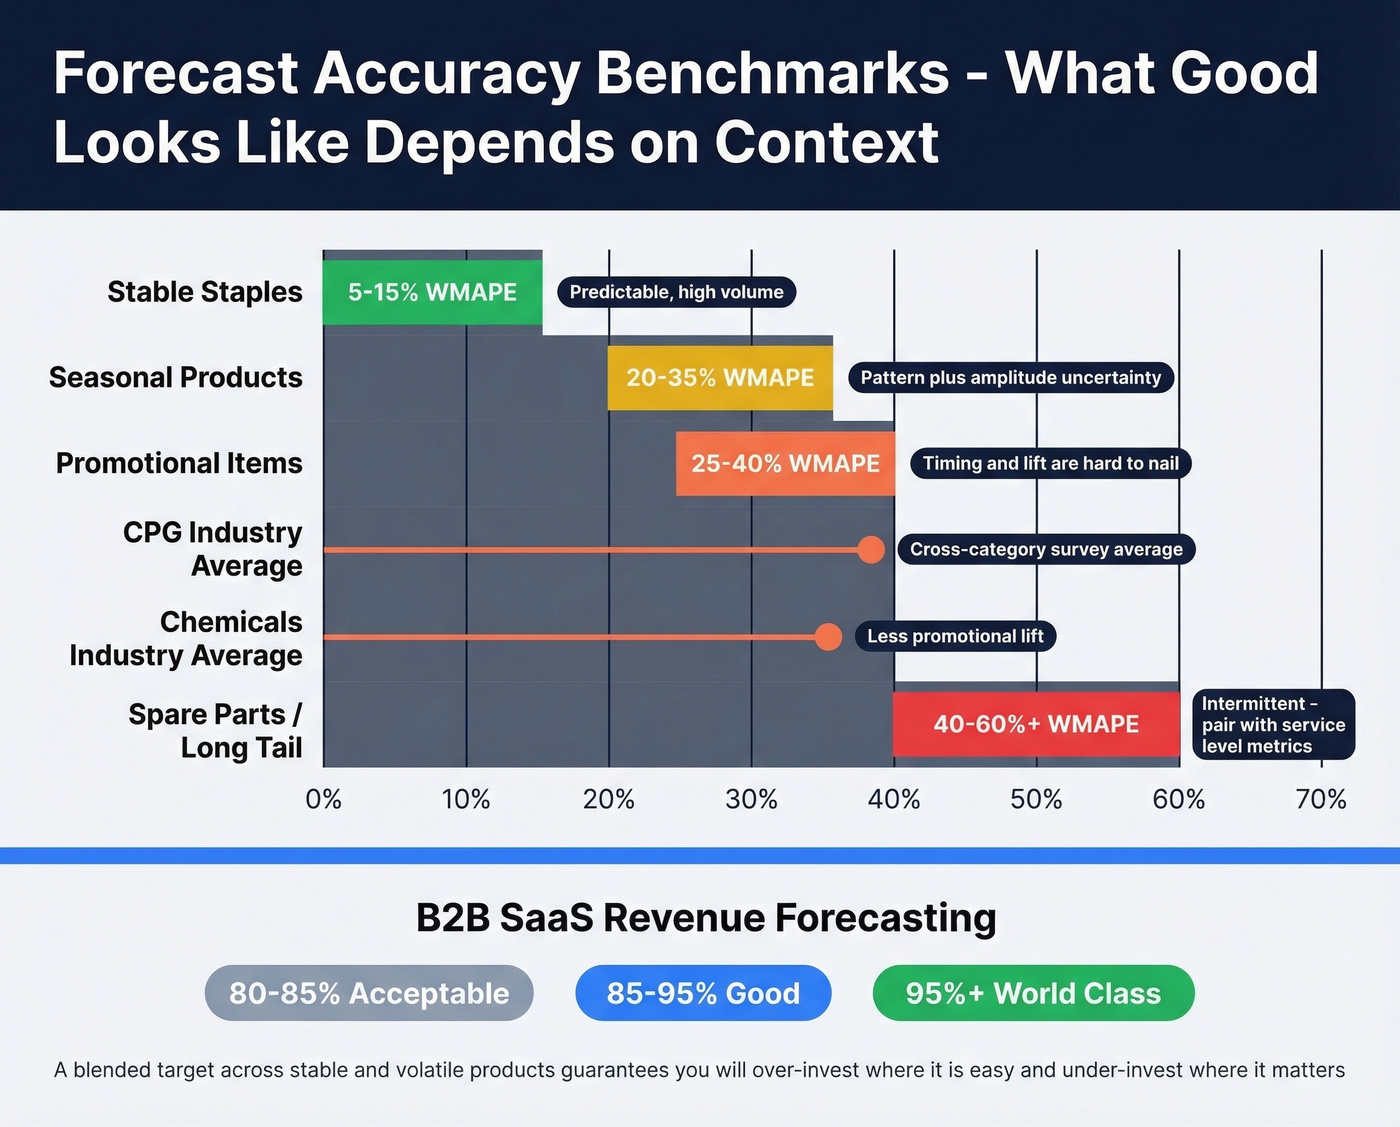
| Stable staples | 5-15% WMAPE | Predictable, high-vol |
| Promotional items | 25-40% WMAPE | Timing/lift uncertainty |
| Seasonal products | 20-35% WMAPE | Pattern + amplitude |
| Spare parts | 40-60%+ WMAPE | Intermittent; use CSL |
| CPG (survey avg) | ~39% error | Cross-category |
| Chemicals (survey avg) | ~36% error | Less promo lift |
For B2B SaaS revenue forecasting, Fullcast's benchmarks frame it differently: 80-85% is acceptable, 85-95% is good, 95%+ is world-class. Their data also shows that even after quotas dropped 13.3%, nearly 77% of sellers still missed quota.
Let's be honest: if your forecast accuracy looks great across the board, you're almost certainly measuring at the wrong level of aggregation. Segment before setting targets - a blended target across stable and volatile products guarantees you'll over-invest where it's easy and under-invest where it matters.
Choosing the Right Metric
If you track only two metrics: WMAPE + Bias. That covers magnitude and direction for the vast majority of contexts.
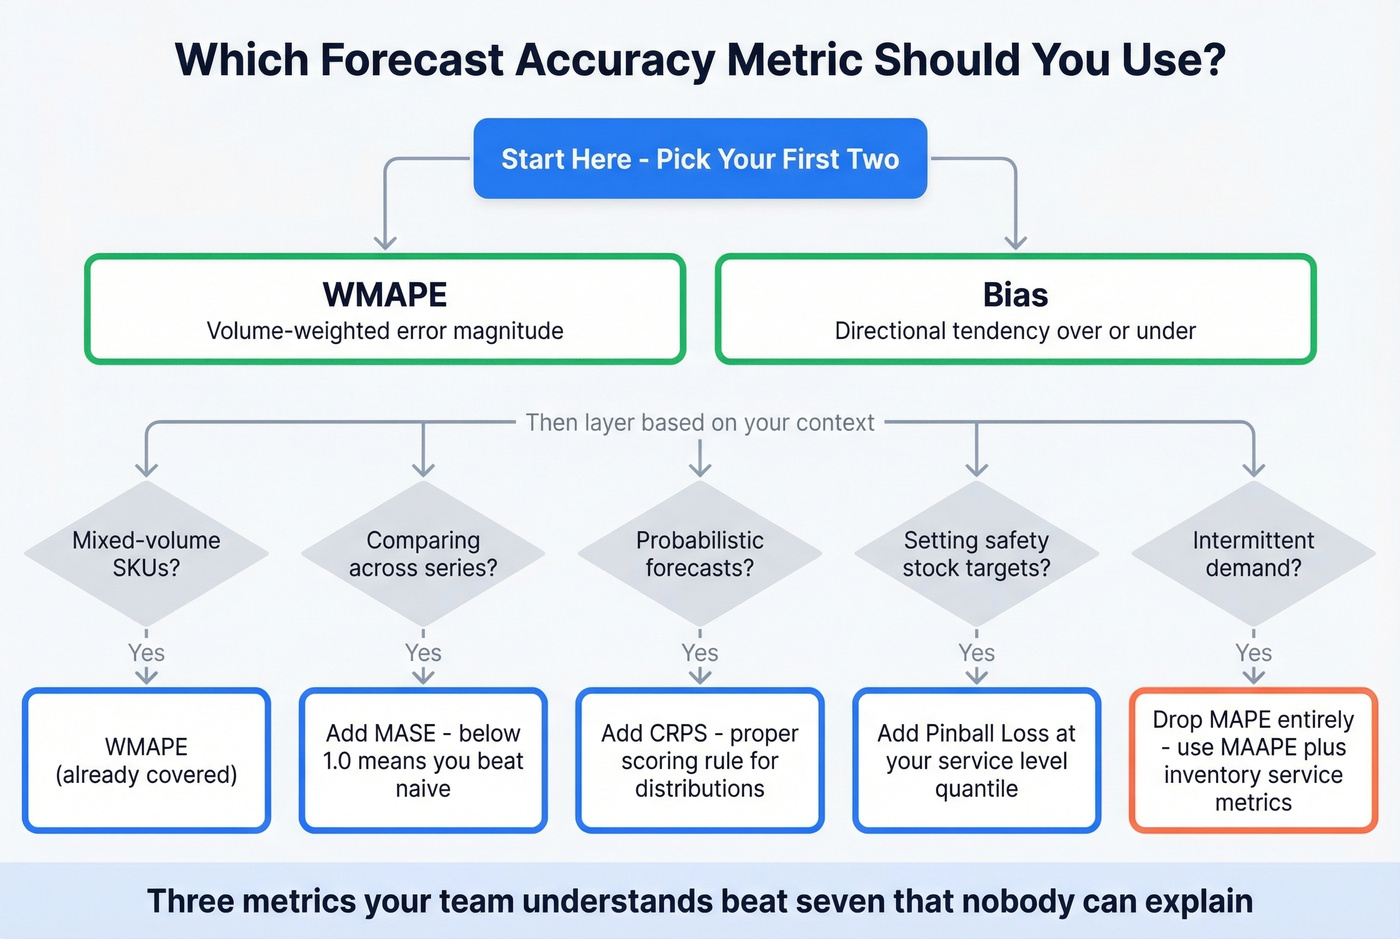
Layer from there based on your situation. For multi-SKU portfolios with mixed volumes, WMAPE is non-negotiable. When you need to compare accuracy across different-scale series, add MASE. If your models output probability distributions, CRPS is the right evaluation tool. For teams setting safety stock at specific service levels, pinball loss at your target quantile gives you the asymmetric penalty structure you need. Intermittent demand? Drop MAPE entirely and use MAAPE or pair MAE with service metrics. Revenue and sales forecasting teams should track accuracy at the deal or segment level alongside bias.
Three well-understood metrics beat seven that nobody on the team can explain to the VP.
Common Mistakes
Forecasting sales instead of unconstrained demand. This is the single worst forecasting practice. If you had stockouts, sales data understates true demand. Forecast demand signals, not constrained shipments.
Chasing accuracy points instead of fixing bias. A team reducing WMAPE from 22% to 20% while ignoring a persistent 8% over-forecast bias is optimizing the wrong thing. Bias reduction delivers more operational value per hour of analyst time.
Building forecasts on stale data. Your forecast is only as good as your inputs. In revenue forecasting, that means CRM data - contact records, deal stages, pipeline values - needs to reflect reality. If your CRM records haven't been verified in months, pipeline forecasts are wrong before you pick a metric. Tools like Prospeo that refresh contact data on a 7-day cycle help keep those inputs current so forecast models aren't working with garbage from day one. If you're evaluating platforms, start with sales forecasting solutions and compare against your pipeline health metrics.
Replanning to hit fixed targets. Constantly adjusting forecasts to match a fixed accuracy target amplifies variability and feeds the bullwhip effect. Plan with ranges, not point targets.
Improving Quarterly Results
Quarterly forecast accuracy deserves its own focus because it's the cadence most leadership teams use for planning and performance reviews. The challenge is that quarterly windows are long enough for multiple demand shifts to occur but short enough that a single bad month can tank the number.
To improve quarterly results, decompose the quarter into monthly or weekly buckets, identify which periods drove the miss, and correct at that granularity. Rolling quarterly reviews - where you evaluate the trailing 13 weeks every month rather than waiting for the quarter to close - give you earlier signals and more chances to course-correct before the number is locked.
Tracking Accuracy in Practice
Archive every forecast version - statistical baseline, planner-adjusted, and sales override. This lets you measure where human adjustments add value versus where they introduce noise. Forecast Pro's implementation guide calls this the foundation of any serious accuracy program.
Build waterfall reports showing actuals alongside archived forecasts at different lead times. A forecast made 12 weeks out should be less accurate than one made 4 weeks out - if it isn't, your short-range process is broken. Align your forecast horizon to your actual lead time. Measuring 1-week-ahead accuracy when procurement lead time is 12 weeks is measuring the wrong thing.
Evaluate out-of-sample, always. And treat data quality as a prerequisite, not an afterthought - the best forecast accuracy metrics in the world can't fix garbage inputs. If your process depends on CRM hygiene, use a data enrichment workflow and keep a clean contact management layer so your pipeline inputs stay current.
You wouldn't track WMAPE on a dataset full of duplicates and dead contacts. Prospeo's 5-step verification removes spam traps, honeypots, and catch-all guesses - so the pipeline data feeding your forecast models reflects real buyers, not noise. Teams using Prospeo book 26% more meetings than ZoomInfo users.
Your forecast is only as accurate as your contact data. Fix the source.
FAQ
What's a good forecast accuracy percentage?
For stable staples, target 90%+ (under 10% WMAPE). Promotional or seasonal items typically land at 60-75%. Intermittent demand at 50% can be excellent. B2B SaaS revenue forecasts target 85-95% as "good" per Fullcast's 2026 benchmarks. Always segment by product type and demand volatility before setting targets.
What's the difference between MAPE and WMAPE?
MAPE averages percentage errors equally, so one low-volume SKU with 200% error dominates the result. WMAPE weights by actual volume - on the same dataset, MAPE can show 36.7% while WMAPE shows 5.9%. For multi-SKU portfolios, WMAPE reflects real business impact; MAPE almost never does.
How do you measure forecast accuracy for intermittent demand?
Standard metrics like MAPE fail because demand is mostly zero. Use MAAPE for a percentage-like measure that handles zeroes, or pair MAE with inventory outcomes like cycle service level and fill rate. Never use a metric that rewards an always-zero forecast - that's statistically optimal but operationally useless.
How does data quality affect forecast accuracy?
Pipeline and revenue forecasts built on CRM records with bounced emails and outdated job titles produce unreliable outputs regardless of model sophistication. Regular data enrichment - refreshing contact records, verifying emails, updating job titles - is a prerequisite, not an afterthought. If your inputs are wrong, no metric or model can save you.