How to Calculate Sales Efficiency: 4 Formulas, Benchmarks, and Common Mistakes
Your board asked for the sales efficiency number and three people calculated three different answers. One used gross ARR, one included marketing spend, and one forgot commissions entirely. That's not a math problem - it's a definitions problem.
We've watched this exact scenario play out at half a dozen SaaS companies. Knowing how to calculate sales efficiency starts with simple arithmetic, but the hard part is agreeing on what goes into it. This article gives you all four formulas, a denominator checklist, current benchmarks, and the mistakes that silently wreck your numbers.
What Is Sales Efficiency?
Sales efficiency measures how much revenue you generate per dollar of sales and marketing spend. It's the resource allocation side of the equation - distinct from sales effectiveness, which measures how well activities convert to outcomes like lead-to-close rate.
The relationship is simple: Productivity = Efficiency x Effectiveness. A team can be efficient (low cost per activity) but ineffective (low conversion), or vice versa. The sales efficiency ratio isolates the spend-to-revenue relationship so you can answer one question: are we getting enough return on our go-to-market investment?
Which Formula Should You Use?
There are four common sales efficiency formulas. Here's the quick decision tree:
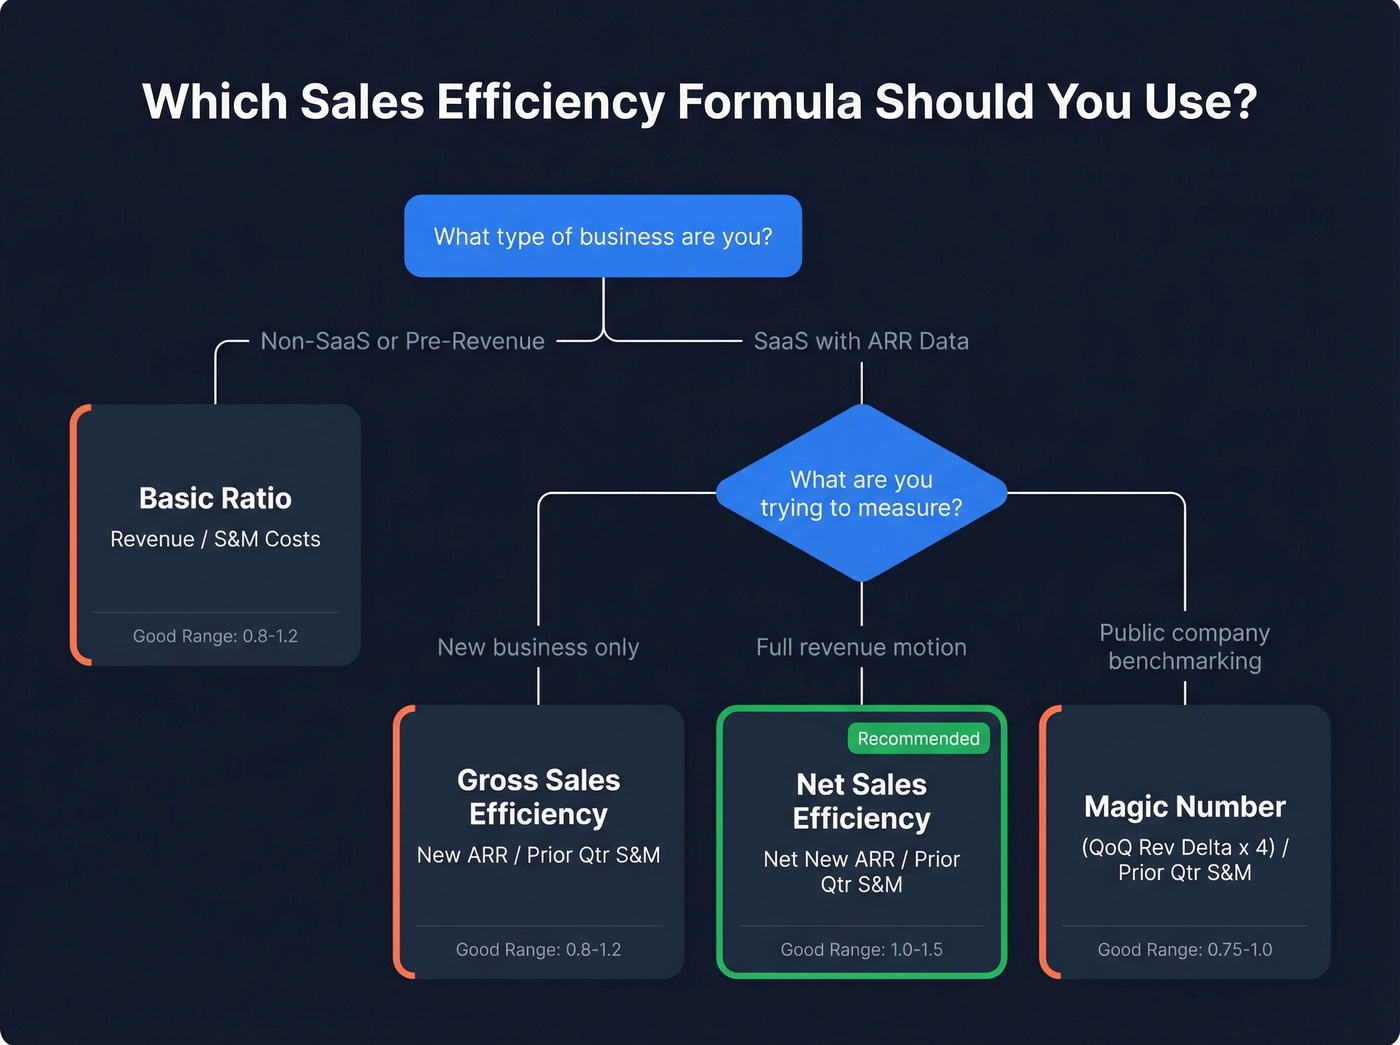
- Private SaaS with clean ARR data - Net Sales Efficiency (Net New ARR / Prior Quarter S&M)
- Benchmarking against public companies - SaaS Magic Number
- Non-SaaS or pre-revenue - Basic Ratio (Revenue / S&M Costs)
- Isolating new business engine - Gross Sales Efficiency
The biggest mistake isn't picking the wrong formula. It's getting the denominator wrong. Keep reading.
Four Sales Efficiency Formulas
| Formula | Numerator | Denominator | Best For | "Good" Range |
|---|---|---|---|---|
| Basic Ratio | Revenue | S&M Costs | Non-SaaS, quick reads | 0.8-1.2 |
| Gross Sales Efficiency | New ARR | Prior Qtr S&M | Isolating acquisition | 0.8-1.2 |
| Net Sales Efficiency | Net New ARR | Prior Qtr S&M | Private SaaS | 1.0-1.5 |
| Magic Number | QoQ Rev Delta x 4 | Prior Qtr S&M | Public company benchmarking | 0.75-1.0 good; >1.0 excellent |
Basic Ratio
Revenue / S&M Costs. This is the bluntest instrument - useful when you're non-SaaS or need a quick directional read. It doesn't distinguish between new, expansion, or recurring revenue, so treat it as a starting point.
Gross Sales Efficiency
New ARR / Prior Quarter S&M. This deliberately ignores churn, which makes it useful for isolating how well your new business engine converts spend into fresh logos. The tradeoff: it can look great while your net numbers are quietly deteriorating.
Net Sales Efficiency
Net New ARR / Prior Quarter S&M. Net New ARR = New ARR + Expansion ARR - Churned ARR. This is the most complete picture for private SaaS companies because it captures the full revenue motion, including the drag of lost customers. If you're only tracking one formula, make it this one.
SaaS Magic Number
(Current Quarter Revenue - Previous Quarter Revenue) x 4 / Prior Quarter S&M. Scale Venture Partners developed this for comparing public SaaS companies where ARR components aren't disclosed. One critical nuance: exclude professional services revenue. Lumpy services deals will distort the number and make your efficiency look artificially volatile.
What Goes in the Denominator
In our experience, the denominator is where most teams go wrong. If yours doesn't include commissions, tools, and benefits, your efficiency number is a fantasy.
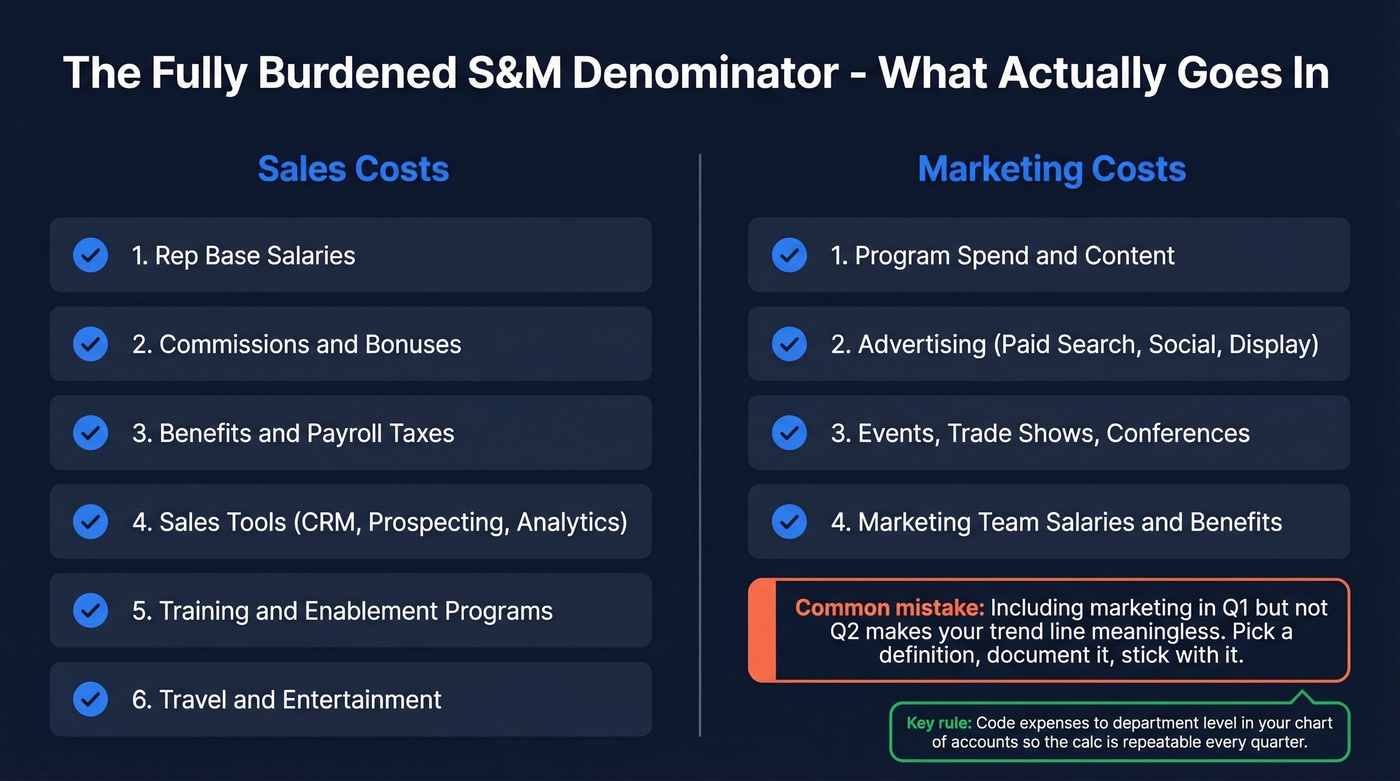
Here's what belongs in "fully burdened S&M spend": rep salaries, commissions, and bonuses, plus benefits and payroll taxes on all S&M headcount. Add sales tools and software - CRM, prospecting platforms, analytics. Include training and enablement programs, travel and entertainment. On the marketing side, fold in program spend, advertising, events, trade shows, and conferences.
The key word is fully burdened. Code expenses to the department level in your chart of accounts so the calculation is repeatable quarter over quarter. The moment you start including marketing in Q1 but not Q2, your trend line becomes meaningless.
On the "should marketing be included?" question: include marketing spend when you want a true go-to-market efficiency metric. If you're deliberately isolating sales-only efficiency, label it clearly and don't compare it to standard benchmarks that assume combined S&M.
Your sales efficiency ratio has a denominator problem - and prospecting tools are part of it. Teams using Prospeo replace multiple data vendors at $0.01/email with 98% accuracy, cutting S&M tool spend while improving pipeline output. Snyk's 50 AEs reduced prospecting time to 4-6 hours/week and grew AE-sourced pipeline 180%.
Shrink the denominator. Grow the numerator. Fix your ratio.
Worked Example
Let's run one dataset through all four formulas to see how the results diverge.
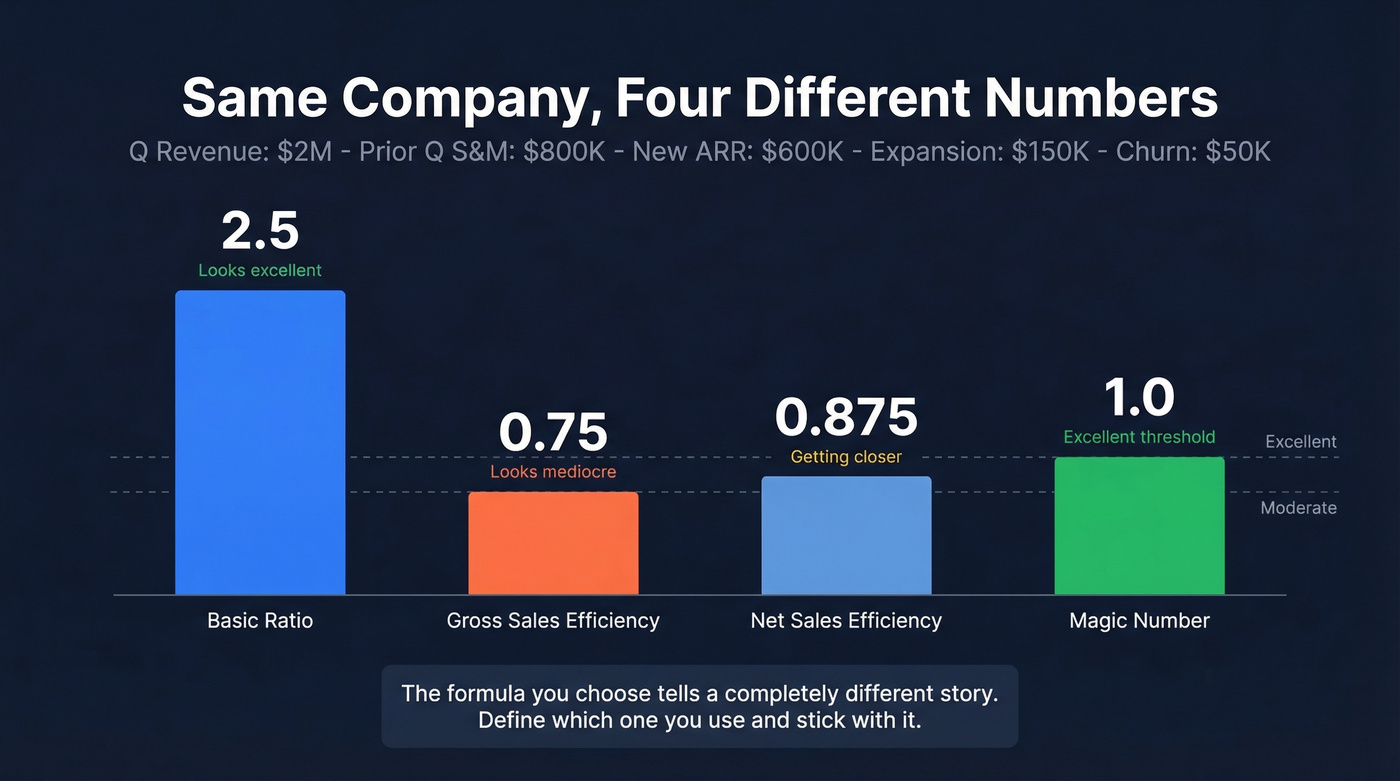
The company: $2M quarterly revenue this quarter, $1.8M last quarter, $800K prior quarter S&M spend, $600K new ARR, $150K expansion ARR, $50K churned ARR.
Basic Ratio: $2,000,000 / $800,000 = 2.5. Looks excellent - but this includes all recurring revenue, not just what the S&M spend actually generated.
Gross Sales Efficiency: $600,000 / $800,000 = 0.75. Now it looks mediocre, because we're only counting new logos.
Net Sales Efficiency: ($600,000 + $150,000 - $50,000) / $800,000 = 0.875. Better. Expansion revenue helps, but churn drags it down.
Magic Number: ($2,000,000 - $1,800,000) x 4 / $800,000 = 1.0. Right at the "excellent" threshold.
Same company, four different stories. This is why defining which formula you're using - and sticking with it - matters more than the number itself.
2026 Benchmarks
| Metric | Median / Benchmark | Notes |
|---|---|---|
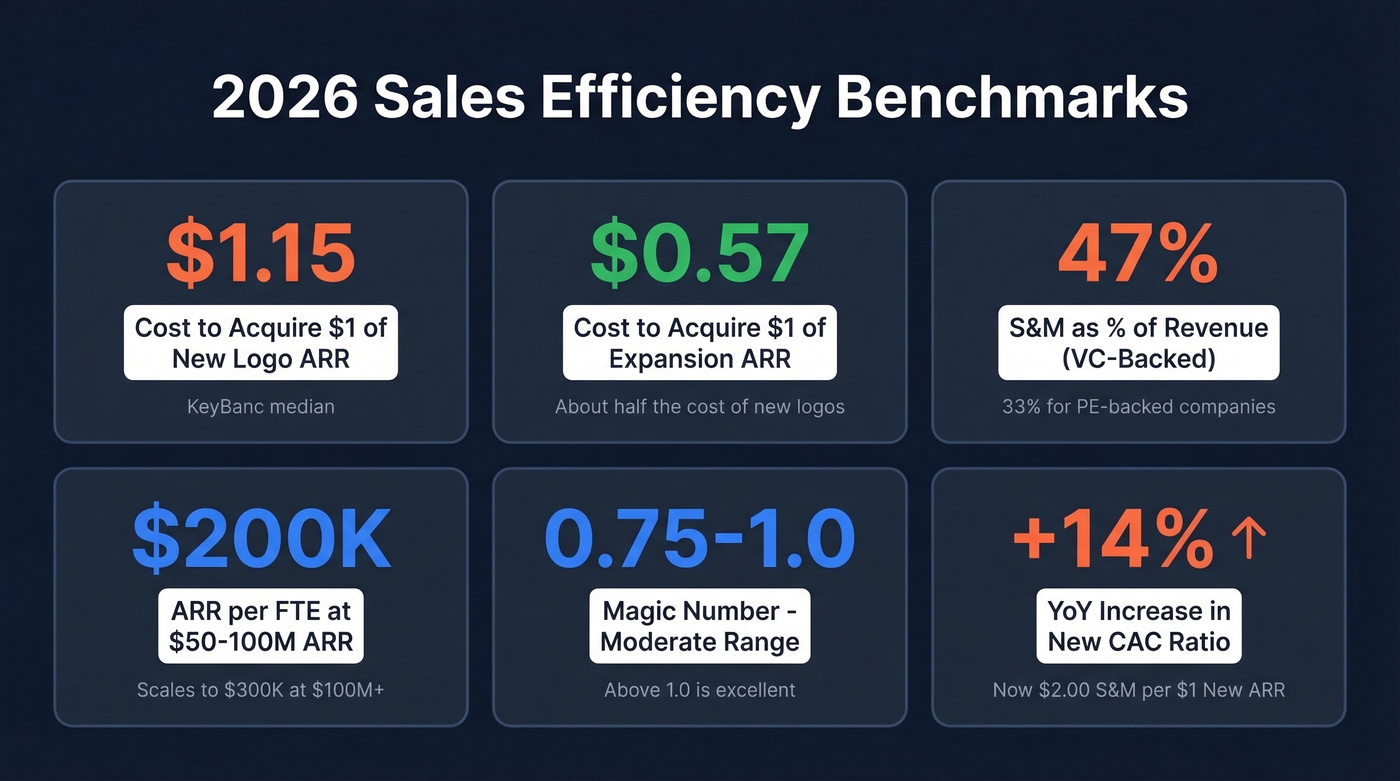
| Magic Number | <0.75 inefficient; 0.75-1.0 moderate; >1.0 excellent | Standard thresholds |
| New CAC Ratio | $2.00 S&M per $1 New Customer ARR | +14% YoY |
| New Logo Cost | $1.15 to acquire $1 of new logo ARR | KeyBanc median |
| Expansion Cost | $0.57 to acquire $1 of expansion ARR | ~Half the cost of new logos |
| S&M as % of Revenue | 47% (VC-backed) / 33% (PE-backed) | Stage and funding type matter |
| ARR per FTE | $200K at $50-100M ARR | Scales to $300K at >$100M |
Here's the thing: a ratio above 3.0 isn't always good. It often means you're underinvesting in growth. If your efficiency is sky-high but your growth rate is 10%, the board should be asking why you aren't spending more aggressively. Context - stage, ACV, sales cycle length - shifts what "good" means dramatically.
Most Series A and B companies obsess over this metric too early. If you haven't hit $10M ARR, your efficiency ratio is going to be ugly, and that's fine. The metric becomes meaningful when you have enough quarters of data to spot trends, not when you're still iterating on ICP and pricing. Optimizing for efficiency before you've found repeatable motion is how you accidentally optimize for slow growth.
Common Mistakes That Wreck Your Numbers
1. Timing lag. Comparing this quarter's revenue to this quarter's spend ignores the fact that 34% of revenue teams have 1-2 quarter sales cycles. You should be comparing revenue to the S&M spend from the quarter that actually generated it - sometimes two quarters back for enterprise deals with 90+ day cycles.
2. Including professional services revenue in the Magic Number. Services revenue is lumpy and non-recurring. It'll make your Magic Number swing wildly quarter to quarter and give you false signals in both directions.
3. Ignoring churn. Look - gross efficiency can look fantastic while net efficiency is quietly tanking. I've seen teams report a 1.2 gross number to the board while net efficiency was sitting at 0.6. If you're only reporting gross numbers, you're hiding the real story.
4. Inconsistent denominator. Some quarters you include marketing, some you don't. Some quarters commissions are in, some they're accrued differently. Pick a definition, document it, and don't change it mid-year. This sounds obvious, but the consensus on r/sales and r/SaaS is that most teams don't actually write down their denominator definition until someone challenges the number.
Five Ways to Improve Your Ratio
1. Shorten Sales Cycles
Opportunities that close within 50 days have a 47% win rate. After that threshold, win rates drop to roughly 20% or lower. Every week you shave off the cycle improves both the numerator (faster revenue recognition) and the denominator (less time-based cost per deal). The fastest lever here is better qualification upfront - kill bad deals early instead of nursing them for three months.
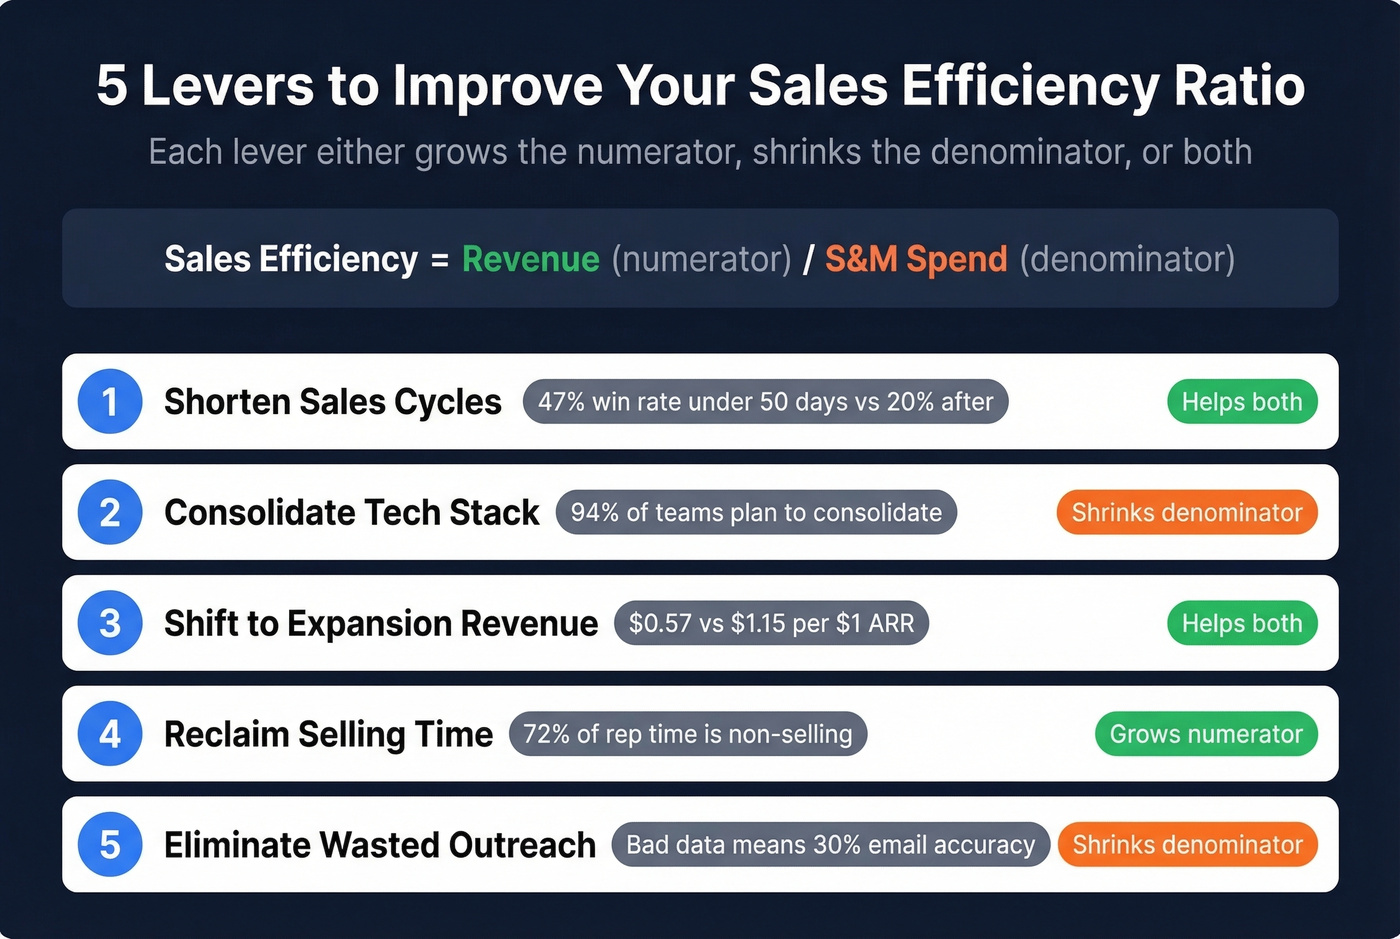
2. Consolidate Your Tech Stack
Sales teams use roughly 10 tools on average, and 94% plan to consolidate. Every redundant tool is S&M spend hitting your denominator without proportional revenue impact. Audit ruthlessly. If two tools overlap by 60%, cut one. The savings compound: fewer licenses, less training time, less context-switching for reps.
3. Shift Investment Toward Expansion
Expansion ARR costs $0.57 to acquire $1 versus $1.15 for new logos. If your expansion ARR already represents 40% of total new ARR (the current median), push it higher. It's the single fastest way to improve net sales efficiency - and it's the lever most teams underweight because "new logos" feels more exciting than upsells.
4. Reclaim Selling Time
Reps spend 72% of their week on non-selling activities. Every hour clawed back from CRM entry, manual research, and internal meetings is an hour that can generate pipeline without adding a dollar to the denominator. This is where automation and better tooling pay for themselves - not by cutting headcount, but by making existing headcount productive.
5. Eliminate Wasted Outreach Spend
Bad prospect data - bounced emails, wrong numbers, outdated contacts - inflates your S&M costs with zero revenue return. In practitioner testing, some enrichment tools show email accuracy as low as 30%, which means you're paying to sequence addresses that'll never reach a human. Every dollar spent on invalid outreach is pure denominator bloat.
This is where data quality directly impacts your efficiency ratio. When Meritt switched to Prospeo, their bounce rate dropped from 35% to under 4%, and pipeline tripled from $100K to $300K per week. Same team size, same outreach volume - dramatically better numerator because the emails actually landed.
Expansion ARR costs half as much as new logos - but only if your reps can actually reach existing accounts. Prospeo's 7-day data refresh keeps your CRM contacts current so expansion outreach doesn't bounce. With 92% enrichment match rates and 50+ data points per contact, your team spends less to generate more.
Stop paying stale-data tax on your sales efficiency number.
FAQ
What's the difference between sales efficiency and the Magic Number?
Sales efficiency is the broad concept - revenue generated per dollar of S&M spend. The Magic Number is one specific formula designed for comparing public SaaS companies using GAAP revenue instead of ARR. Every Magic Number is a sales efficiency metric, but not every efficiency calculation is a Magic Number.
What's a good sales efficiency ratio for SaaS?
Net sales efficiency of 1.0-1.5 is strong for private SaaS. A Magic Number above 0.75 signals moderate efficiency; above 1.0 is excellent. Stage matters - early-stage companies will naturally run lower than scaled companies optimizing unit economics.
How do you improve the ratio without cutting headcount?
Focus on the denominator: consolidate redundant tools, eliminate wasted outreach on bad data, and shift budget toward expansion revenue, which costs roughly half as much as new logo acquisition. You don't need fewer people - you need fewer dollars wasted on activities that don't generate revenue.
How often should you calculate sales efficiency?
Measure quarterly at minimum, using a trailing-quarter denominator to account for sales cycle lag. Monthly snapshots are too noisy for most B2B companies with 60-90 day cycles. Quarterly cadence gives you enough signal to spot trends without overreacting to short-term variance. For board reporting, we recommend showing the trailing four quarters side by side so the trend line tells a story, not just a snapshot.