How to Calculate TAM - The Practitioner's Field Guide
Every founder has stared at a blank spreadsheet, typed "TAM" into cell A1, and immediately wondered where the numbers are supposed to come from. As one product marketer put it on r/startups, TAM work outside sectors with published analyst reports feels "wishy-washy" - like you're inventing a number and hoping nobody asks how you got there.
You're not alone. But the gap between a TAM that gets investors nodding and one that gets your deck closed is method, not magic.
The Short Version
What Is TAM (and Why It Matters)
TAM - total addressable market - is the total revenue opportunity available if you captured 100% of your market. It's a ceiling, not a forecast. Nobody gets 100% share, but the number tells you whether the opportunity is big enough to build a venture-scale business around.
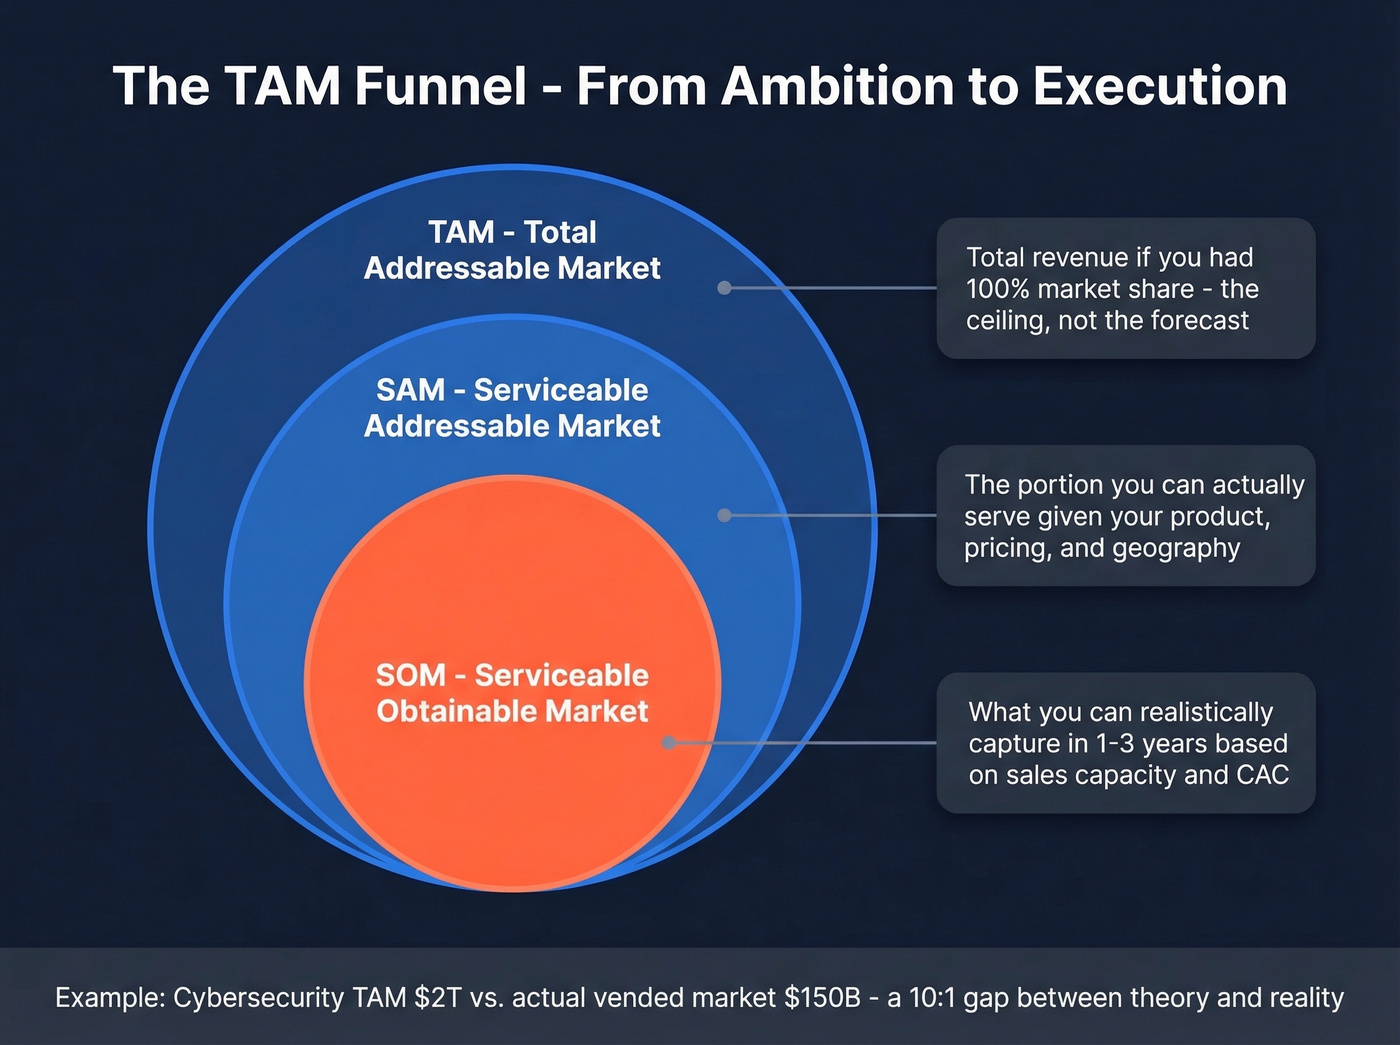
TAM sits at the top of a three-layer funnel. SAM (serviceable addressable market) is the portion you can actually serve given your product, pricing, and geography. SOM (serviceable obtainable market) is the slice you can realistically capture in the next one to three years, grounded in your sales capacity, CAC, and conversion rates. A VC reading your deck uses TAM to gauge ambition, SAM to see where you can win, and SOM to judge near-term execution realism.
Here's why the distinction matters more than people think. McKinsey estimated the global cybersecurity TAM at $1.5 trillion to $2 trillion in 2022 - but the vended market, what companies actually spent on security products, was roughly $150 billion in 2021. That's a 10:1 gap between theoretical opportunity and real spending. Pitch a cybersecurity startup using the $2T number without narrowing to SAM and SOM, and you've told investors nothing useful about your actual business.
Three Proven TAM Calculation Methods
Top-Down Method
Top-down starts with a big industry number from an analyst report and narrows it by segment, geography, or customer type. You take a global CRM market figure, filter to North America, then filter to mid-market companies. The math is simple: industry size x your segment's share = TAM estimate.
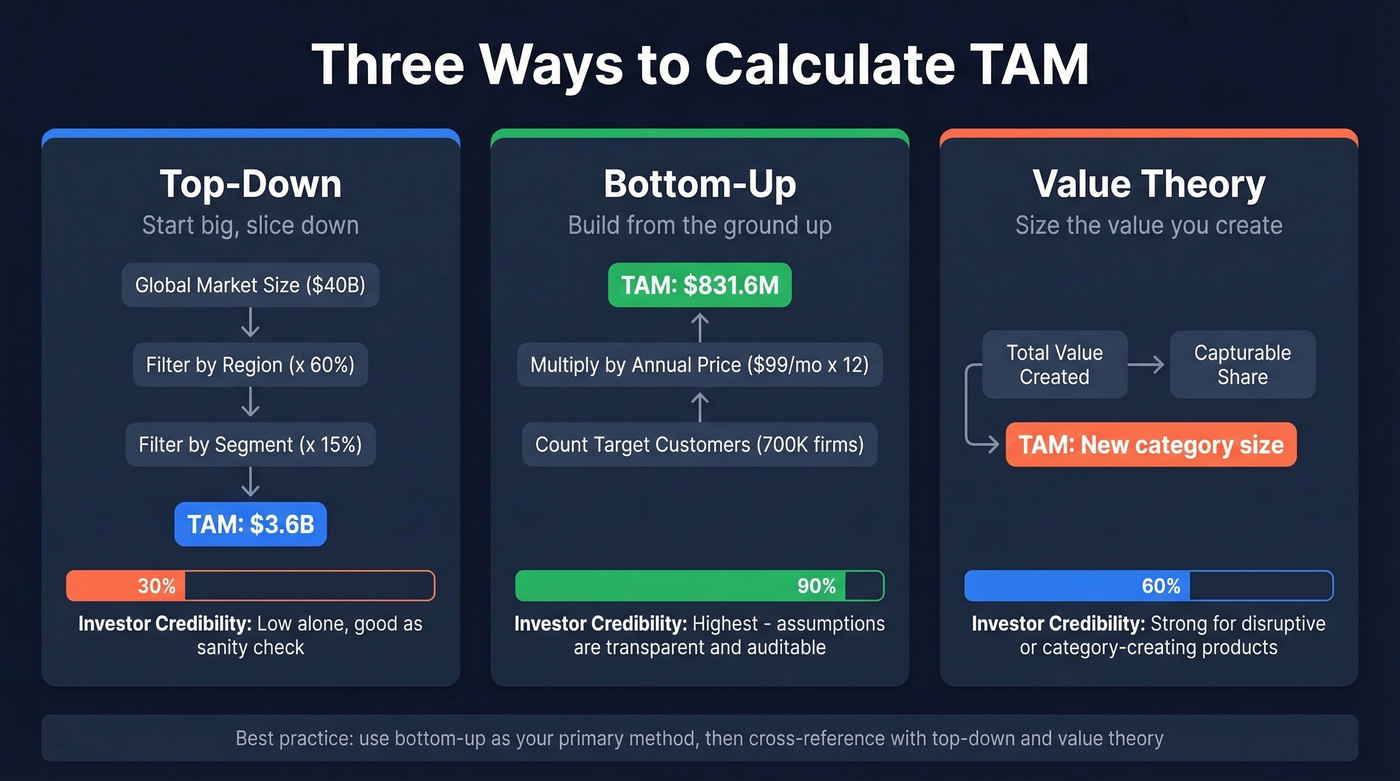
The problem? You're inheriting someone else's assumptions. Analyst reports from Gartner, IDC, or Forrester typically cost $2,000+ per report, and they often blend categories in ways that don't match your product. A "project management software" report might include enterprise suites you'd never compete with. Used alone, top-down is the least investor-credible method - but it's a useful sanity check when paired with bottom-up numbers.
Worked example: A report estimates the global HR tech market at $40B. You only sell in North America (assume 60% of spend) to companies with 50-500 employees (assume 15% of the segment). Top-down TAM: $40B x 0.60 x 0.15 = $3.6B. Useful as a cross-reference. Not convincing on its own.
Bottom-Up Approach
This is the method investors trust. Instead of starting with a macro number and slicing it down, you build from the ground up: how many potential customers exist, what you'd charge each one, and what that totals annually.
Let's walk through a construction SaaS example. The U.S. construction industry has roughly 700,000 firms and about 8 million employees. If you're selling a per-firm license at $99/month, your TAM is 700,000 x $99 x 12 = $831.6 million. But if your product is priced per employee at $5/month, the math shifts: 8,000,000 x $5 x 12 = $480 million. Same industry, same product category - but your unit definition just changed TAM by $350 million.
That's the power and the danger of bottom-up. Your assumptions are transparent, which is exactly why investors prefer it. They can challenge your customer count, your pricing, your segment filters - and that's a productive conversation rather than a staring contest over a Gartner number.
The formula: target customers x annual price per customer = TAM. Apply constraints for SAM by filtering for geography, company size, and tech readiness. SOM narrows further to your realistic sales capacity over 12-36 months.
Structure your bottom-up model in a spreadsheet: Column A for customer segments, Column B for account counts, Column C for ACV, Column D for segment TAM. Layer SAM and SOM filters as additional rows beneath each segment. This forces you to show your work at every step, and it's exactly what investors want to audit.
Value Theory Method
Value theory asks a different question: what's the total value your product creates, and how much of that value can you capture? This method shines for disruptive products that don't fit neatly into existing market categories.
The classic example is Uber. When NYU professor Aswath Damodaran estimated Uber's TAM at $100 billion - global taxi and limo revenue - he was sizing the market Uber was entering. But Uber wasn't just replacing taxis. It pulled demand from walking, public transit, biking, and personal car trips. The TAM wasn't "taxis." It was "urban transportation." By 2022, Uber's gross bookings exceeded $26.4 billion per quarter, blowing past what a taxi-only framing would've predicted.
Use value theory when your product creates a new category or fundamentally changes buyer behavior. If you're selling a better version of an existing tool, bottom-up is simpler and more defensible.
Bottom-up TAM requires an accurate count of addressable accounts - not estimates from macro data. Prospeo's 300M+ profiles with 30+ filters let you count exact companies by size, tech stack, funding stage, and hiring signals. Build your TAM on real numbers, not assumptions.
Size your market from actual account data, not spreadsheet guesses.
Where to Find Reliable TAM Data
The biggest bottleneck in market sizing isn't the formula - it's finding reliable inputs.
| Source | What It Gives You | Best For | Cost |
|---|---|---|---|
| NAICS codes | Industry classification | Grouping industries | Free |
| BLS | Employment, wages, jobs | User counts, budgets | Free |
| U.S. Census | Business counts, demographics | Regional segmentation | Free |
| County Business Patterns | Establishment counts by size | Local/regional TAM | Free |
| IBISWorld | Industry revenue, growth rates | Sector-level sizing | $1K-$5K/report |
| OECD / World Bank / Eurostat | International economic data | Global TAM sizing | Free |
| Gartner / Forrester / IDC | Market size reports | Top-down benchmarks | $2K+ per report |
| PitchBook / Crunchbase | Funding, company data | Competitor sizing | Free-$20K+/yr |

For B2B companies, the hardest part of bottom-up sizing is counting potential customers accurately. Government datasets give you industry-level aggregates, but they won't tell you how many Series B SaaS companies with 50-200 employees use Salesforce and are hiring SDRs. That's where a B2B database with firmographic filters becomes essential - you can count addressable accounts directly instead of estimating from macro data. Prospeo's 30+ search filters let you build a precise account count rather than guessing from Census tables.
Some founders estimate TAM by analyzing the top 20 competitors' revenue and extrapolating total market size. Useful cross-check, though it tends to undercount markets with fragmented or emerging players. We've found that founders who blend two or three data sources produce far more credible numbers than those who rely on a single analyst report. Triangulation isn't optional - it's what separates a credible pitch from a hand-wave.
Real-World TAM Examples
WeWork: The Cascading Funnel Done Right
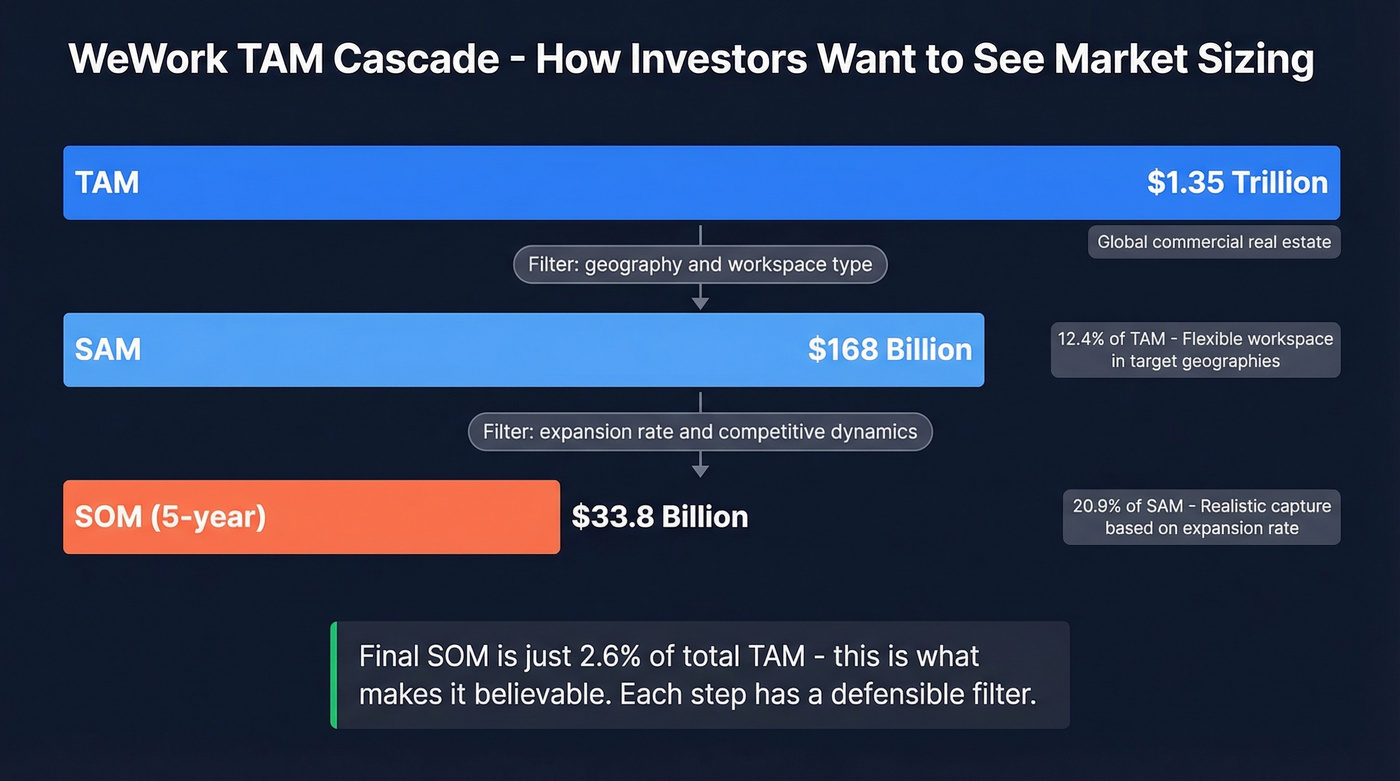
Toptal's analysis modeled WeWork's market opportunity with striking clarity:
| Layer | Value | Filter Applied |
|---|---|---|
| TAM | $1.35 trillion | Global commercial real estate |
| SAM | $168 billion (12.4% of TAM) | Flexible workspace in target geographies |
| SOM (5-year) | $33.8 billion (20.9% of SAM) | Realistic capture based on expansion rate |
That cascading narrowing is exactly what investors want to see. Each step has a defensible filter, and the final number - just 2.6% of total TAM - feels grounded rather than aspirational. If your TAM slide doesn't show this kind of progressive narrowing, fix it before your next pitch.
Uber: When the Market Doesn't Exist Yet
Damodaran's $100 billion estimate assumed the future would look like the past. Bill Gurley argued the opposite - that Uber was expanding the market, not just taking share from cabs. Reality looked closer to Gurley's view. By 2022, Uber's gross bookings exceeded $26.4 billion per quarter, driven by demand that never would've existed in a taxi-only world.
The lesson: if your product changes behavior, your total addressable market isn't the existing category. It's the new one you're creating.
Zoom: Markets Aren't Static
Pre-COVID, Zoom's estimated TAM was $43 billion, based on corporate video conferencing spend. Reasonable, defensible, and - as it turned out - wildly conservative. By 2021, Zoom's annual revenue surged past $4 billion as remote work expanded the addressable market far beyond corporate meeting rooms into education, healthcare, social gatherings, and government. Zoom didn't just capture share of a $43B market. The market itself grew. This is the strongest argument for revisiting your TAM regularly, and the best companies actively expand their own addressable market through product decisions.
How Investors Actually Evaluate Your TAM
Let's be honest: most founders spend too much time making their TAM number bigger when they should spend that time making it more believable. We've reviewed a lot of TAM slides, and the ones that land aren't the ones with the largest numbers - they're the ones where every assumption is visible and defensible.
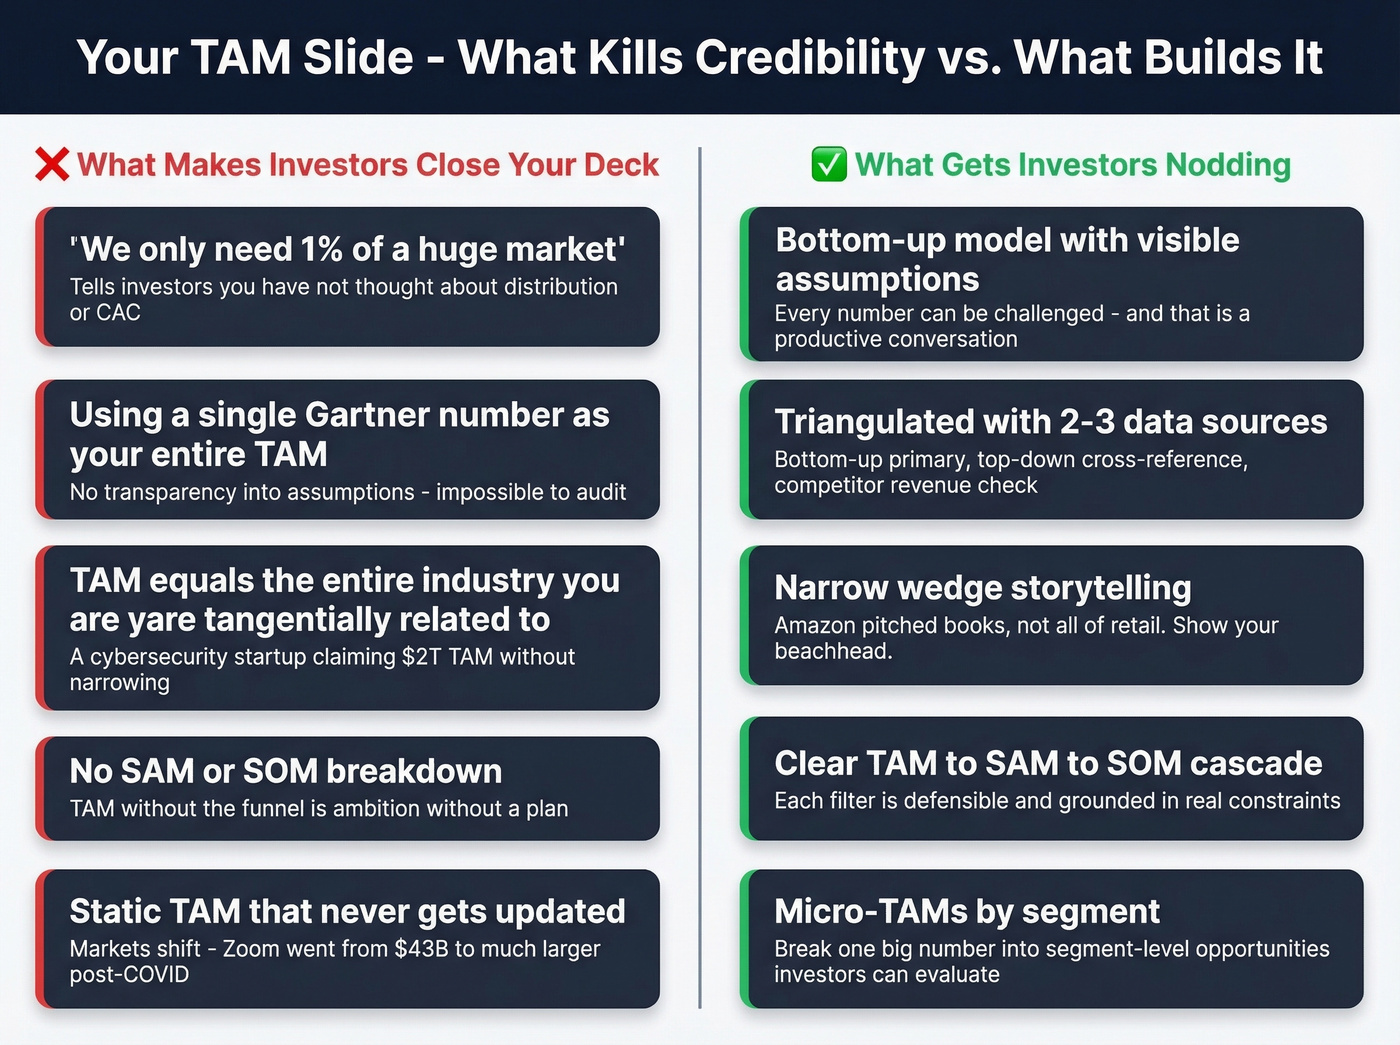
TAM slides are among the most frequently mis-executed in pitch decks. The classic credibility killer is "we only need 1% of a huge market." That sentence tells an investor you haven't thought about distribution, CAC, or competitive dynamics. If capturing 1% were easy, everyone would do it.
What works instead: narrow wedge storytelling. Amazon didn't pitch "all of retail." They pitched books. Zoom didn't pitch "all communication." They pitched video conferencing for tech companies. Show investors you understand your SOM - the near-term slice grounded in your actual pipeline, conversion rates, and sales capacity - and they'll trust your TAM ambition.
Stop obsessing over TAM precision. Investors are pattern-matching for intellectual honesty, not auditing your spreadsheet.
The Micro-TAM Advantage
One tactic we don't see enough founders use: break your TAM into micro-TAMs by segment. Instead of one $5B number, show TAM by industry vertical x company size. If your product's win rate in healthcare companies with 100-500 employees is 3x your win rate in fintech, that micro-TAM analysis tells investors where you'll actually land - and it gives your sales team a prioritized target list instead of a vague mandate to "go sell."
For products with annual contracts under $15K, this kind of segmentation matters even more. You need volume, and volume requires knowing exactly which ponds to fish in.
Mistakes That Kill TAM Credibility
Using a single data source. One Gartner report isn't a TAM analysis. Triangulate bottom-up counts against top-down benchmarks and competitor revenue data.
Leaving your ICP vague. "All businesses" isn't a target market. Define your ideal customer by industry, headcount, geography, tech stack, and budget. Skip this step and your TAM is fiction. If you need a structure, start with an ideal customer template and scoring rubric.
Treating TAM as a one-time exercise. Markets expand (Uber) and shrink (encyclopedias after Wikipedia). Revisit your sizing at least quarterly.
Confusing legacy TAM with disruptive TAM. If your product creates a new category, sizing the old category understates your opportunity. Think directionally, not just historically.
The "we only need 1%" framing. Replace it with a bottoms-up SOM showing exactly how you'd capture your first $5M in revenue. That's the slide that gets follow-up meetings.
Ignoring pricing model shifts. A market that was $50B under perpetual licenses might be $30B under SaaS - or $80B if SaaS expands the buyer base. Account for this.
Never updating after launch. Post-launch data - actual conversion rates, ACV, churn - should replace your pre-launch hypotheses. Evidence beats estimates every time, and investors notice when your Series A deck still uses the same TAM assumptions from your seed round.
Your TAM model is only as good as the data behind it. Instead of paying $5K for an analyst report, use Prospeo to filter 300M+ profiles by industry, headcount, revenue, and technographics - then export a precise account list at $0.01 per verified contact.
Turn your TAM spreadsheet into a prospecting list in one step.
FAQ
How do you calculate TAM?
Use the bottom-up approach: count your total target customers, multiply by annual contract value, and sum across segments. Validate with a top-down sanity check using industry reports from Gartner or BLS data. For disruptive products creating new demand, value theory estimates total value created rather than existing spend.
What's a good TAM size for venture capital?
Most VCs look for $1B+ TAM to justify fund economics. But a credible $500M number with airtight bottom-up assumptions beats a hand-wavy $50B figure every time. Investors prefer a defensible, narrow market you can dominate over an inflated number with no supporting logic.
What's the difference between TAM, SAM, and SOM?
TAM is total market revenue assuming 100% share. SAM is the portion you can serve given your product, pricing, and geography. SOM is the slice you can realistically capture in one to three years based on sales capacity, conversion rates, and competitive dynamics.
Which TAM method works best for B2B SaaS?
Bottom-up is the gold standard. Count target accounts using firmographic data filtered by industry, headcount, revenue, and tech stack, then multiply by your ACV. A B2B database with granular filters lets you count addressable accounts directly rather than estimating from macro data.
How is TAM calculated for a new market with no existing data?
Value theory is your best starting point. Estimate the total economic value your product unlocks - time saved, cost reduced, revenue generated - across all potential users, then apply a reasonable capture rate. Cross-reference with adjacent market data and early customer willingness-to-pay signals to ground the estimate.