How to Measure CRM Success When 50-70% of Projects Fail
It's QBR week. Your VP asks if the CRM is helping close more deals. You pull up a dashboard with 14 metrics, half of which haven't moved since last quarter, and you don't have a good answer.
A Gartner survey found roughly 50-70% of CRM projects produce negative outcomes. In a $126B market where 91% of companies run a CRM, that's billions in shelfware. And yet every CRM vendor publishes a measurement guide that ends with "use our CRM" - none of them address why the failure rate is so high in the first place.
Here's the thing: knowing how to measure CRM success starts with agreeing on what "success" looks like before you open a single dashboard. Whether you're on Salesforce, HubSpot, or a lightweight CRM, the framework is the same. We're focusing on sales pipeline metrics here because that's where most teams struggle first. Marketing and service metrics matter, but they're meaningless if reps aren't using the system.
What You Need Before Tracking Anything
Before tracking any CRM metric, audit three things:
- Adoption rate - are reps actually using it daily?
- Data health - are your records fresh, deduplicated, and logically consistent?
- Baselines - do you have pre-CRM numbers to compare against?
If you only track three metrics this quarter, make them adoption rate, win rate, and pipeline velocity. Everything else is a refinement.
Why Most CRM Measurement Fails
Three gaps kill CRM measurement before it starts.
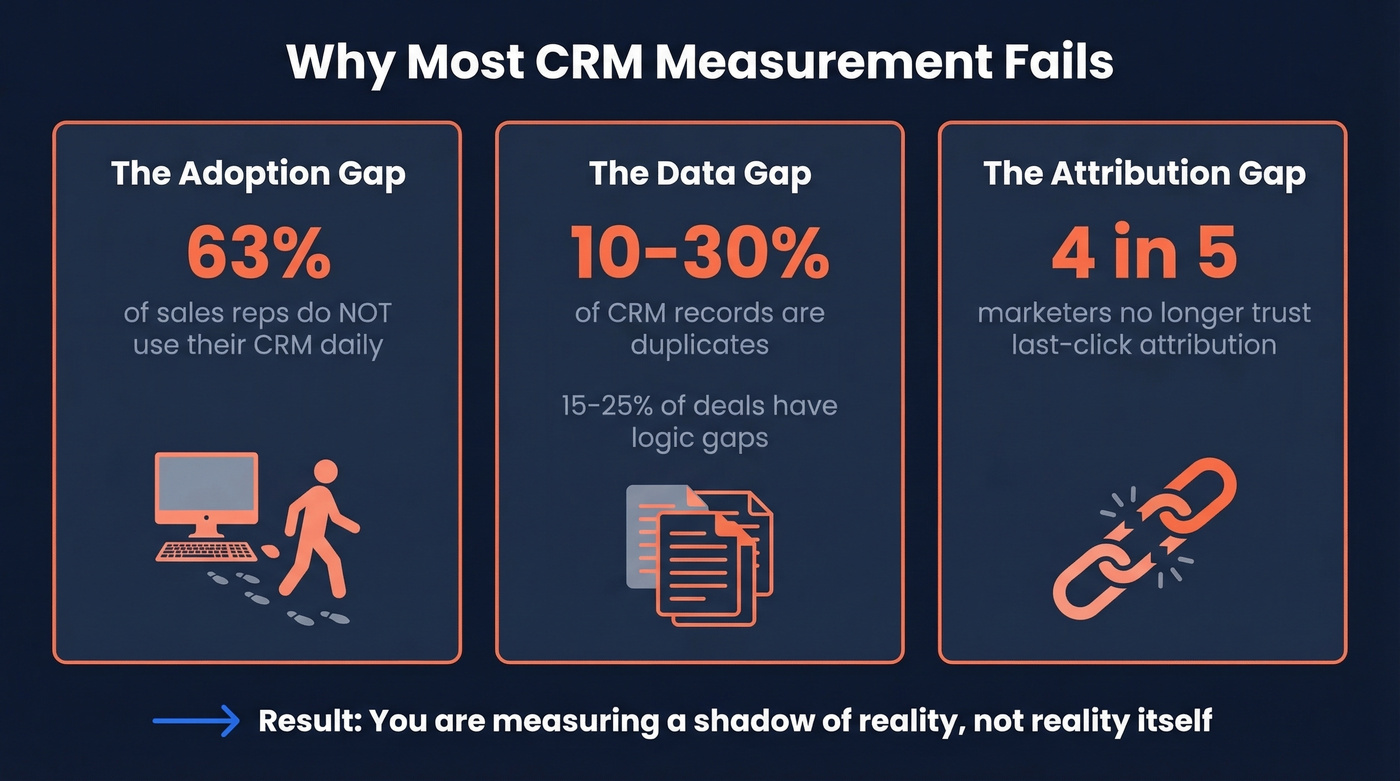
The Adoption Gap
Less than 37% of sales reps use their CRM daily. Think about that for a second - if two-thirds of your team isn't logging activity, every report you pull is built on incomplete data. You're measuring a shadow of reality, not reality itself.
The Data Gap
The average B2B CRM carries a 10-30% duplicate rate. Add in stale records and fields that contradict each other - roughly 15-25% of active deal records contain logic gaps like "Closed Won" with no revenue attached - and your "single source of truth" is fiction.
The Attribution Gap
Only 1 in 5 marketers still trust last-click attribution, and nearly three-quarters have moved away from it entirely. Fragmented buyer journeys and privacy signal loss mean you can't just credit the CRM for a revenue lift. Use first-party data, cohort comparisons, or hold-out groups to prove CRM lift - not dashboards that tell you what you want to hear.
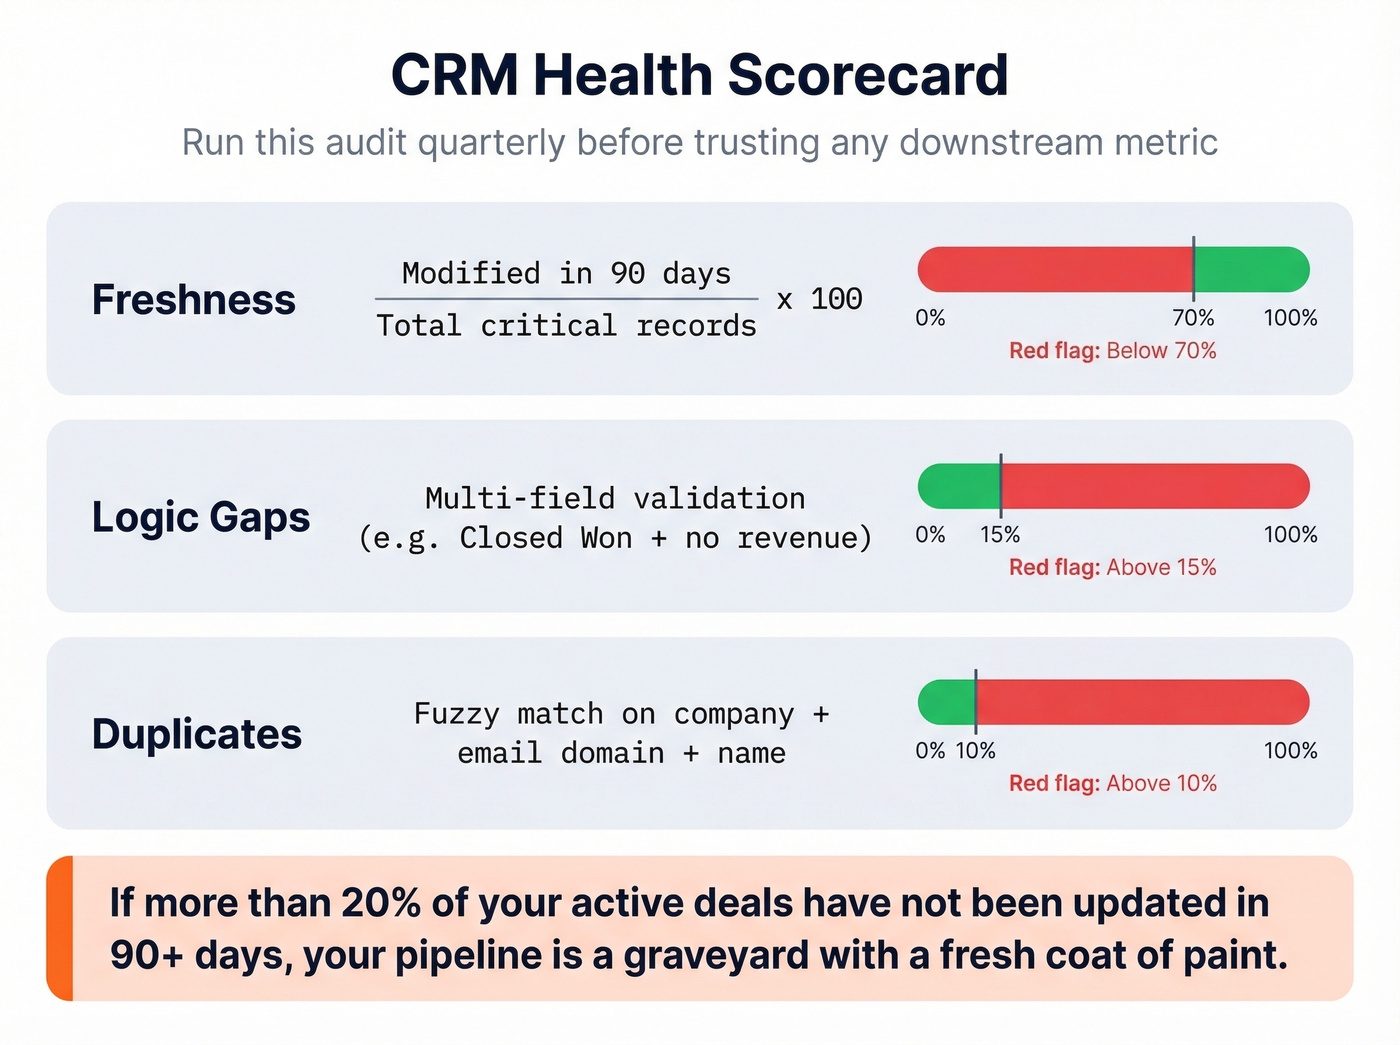
The CRM Health Scorecard
Before you measure outcomes, measure the instrument. We've used this three-dimension scoring model to audit CRM data integrity across dozens of pipeline reviews, and it catches problems that outcome metrics never surface.
| Dimension | Formula / Check | Red Flag |
|---|---|---|
| Freshness | Modified in 90d / total critical records x 100 | Below 70% |
| Logic gaps | Multi-field validation (e.g., "Closed Won" + no revenue) | Above 15% |
| Duplicates | Fuzzy match on company + email domain + name | Above 10% |
If more than 20% of your "active" deals haven't been updated in 90+ days, your pipeline is a graveyard with a fresh coat of paint. Run this scorecard quarterly before trusting any downstream metric.
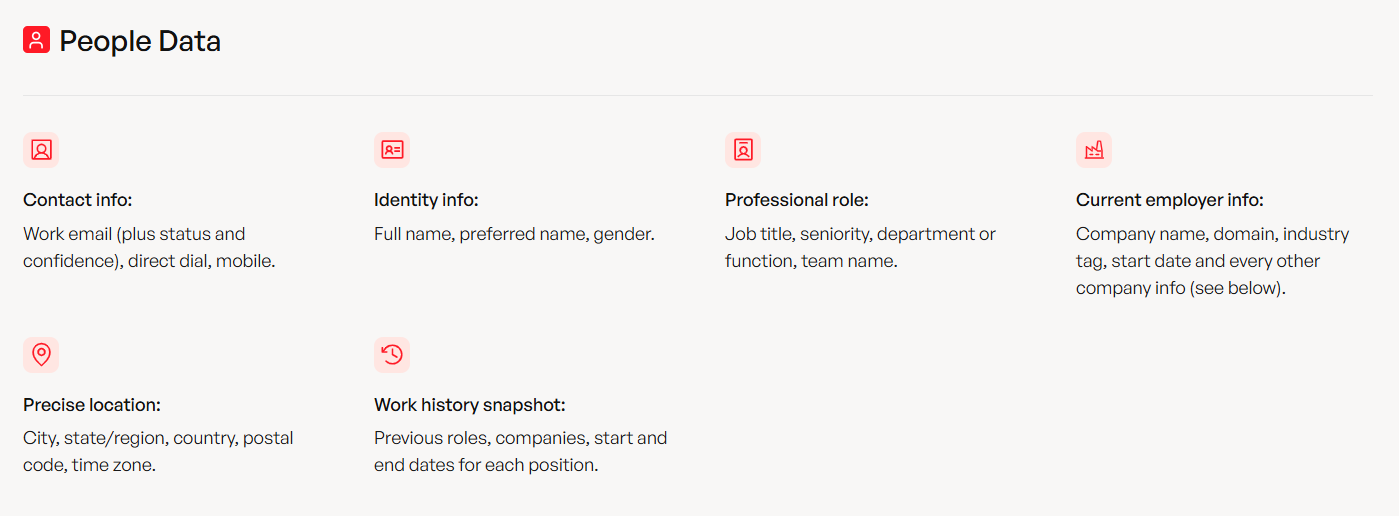
When your health audit reveals stale or incomplete records, enrich before re-measuring. Prospeo's CRM enrichment returns 50+ data points per contact with an 83% match rate, refreshing records every 7 days versus the 6-week industry average. Clean data in, clean metrics out.
Your CRM health scorecard is useless if 30% of your records are stale or duplicated. Prospeo's CRM enrichment returns 50+ data points per contact at an 83% match rate - refreshed every 7 days, not the 6-week industry average. One team dropped their bounce rate from 35% to under 4% and tripled pipeline.
Fix your data layer before you measure another metric.
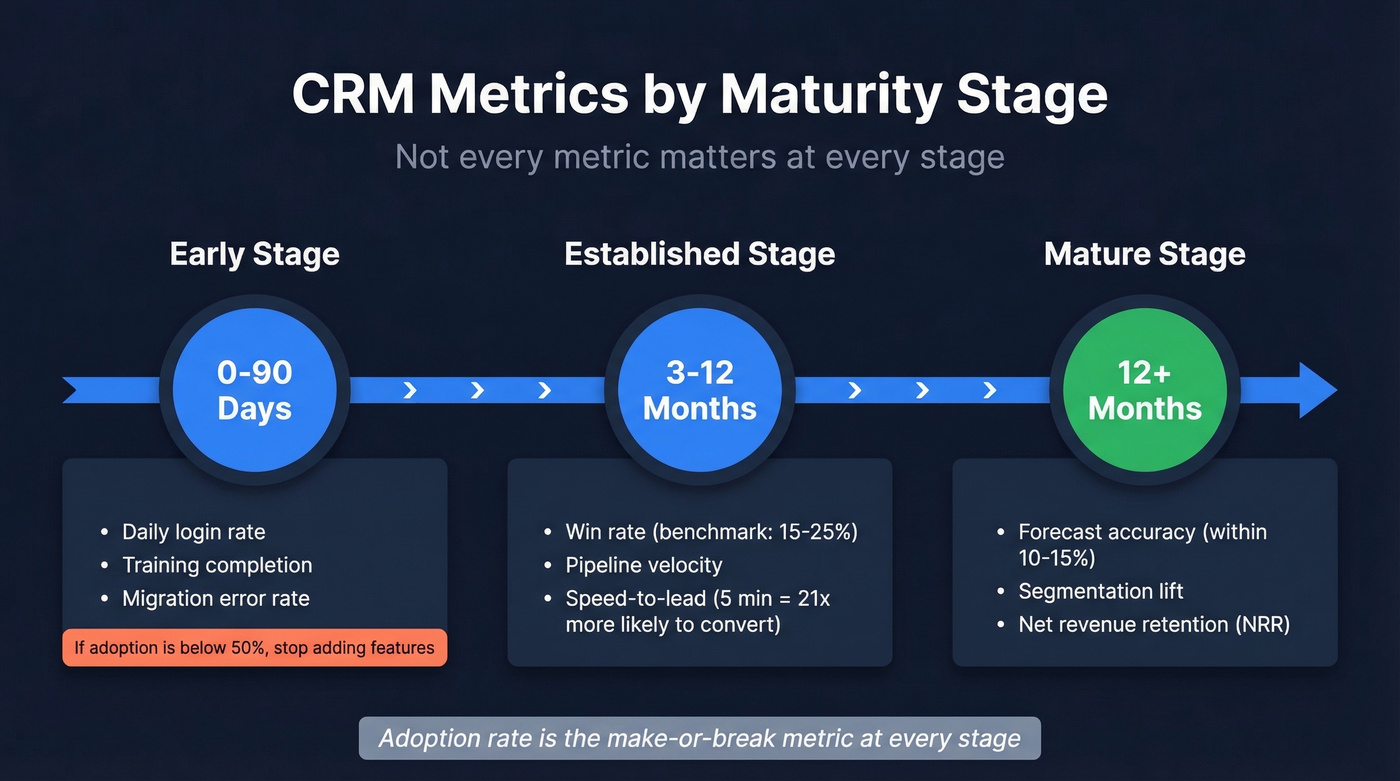
Measuring CRM Success at Each Maturity Stage
Not every metric matters at every stage. Tracking forecast accuracy in month two is like grading a pilot on fuel efficiency during their first flight lesson.
| Stage | Timeline | Priority Metrics |
|---|---|---|
| Early | First 90 days | Adoption, training completion, migration accuracy |
| Established | 3-12 months | Win rate, pipeline velocity, speed-to-lead |
| Mature | 12+ months | Forecast accuracy, segmentation lift, NRR |
Early Stage (First 90 Days)
Your only job is getting people to use the system and making sure the data that went in is clean. Track daily login rate, training completion, and migration error rate.
If adoption is below 50%, stop adding features. Fix the change management problem first.
Established Stage (3-12 Months)
Now you can measure sales outcomes. SaaS win rates generally fall in the 15-25% range - if yours is below 10%, the CRM isn't the problem. Your qualification criteria are. (If you're tightening qualification, a structured framework like MEDDIC helps.)
Pipeline velocity tells you how fast deals move through stages. Speed-to-lead matters more than most teams realize: Dr. James Oldroyd's research showed that contacting a lead within 5 minutes makes them 21x more likely to enter the sales process versus waiting 30 minutes. That's not a rounding error - it's the difference between a pipeline that moves and one that stalls.
Mature Stage (12+ Months)
At this point you're optimizing. Forecast accuracy should land within 10-15% of actual results. Net revenue retention tells you if the CRM is helping retain and expand, not just acquire. RevOps practitioners consistently cite adoption rate as the make-or-break metric that predicts whether a CRM implementation survives past year one, but by now, you should be well past that hurdle.
How to Calculate CRM ROI
ROI = (Gain - Cost) / Cost x 100
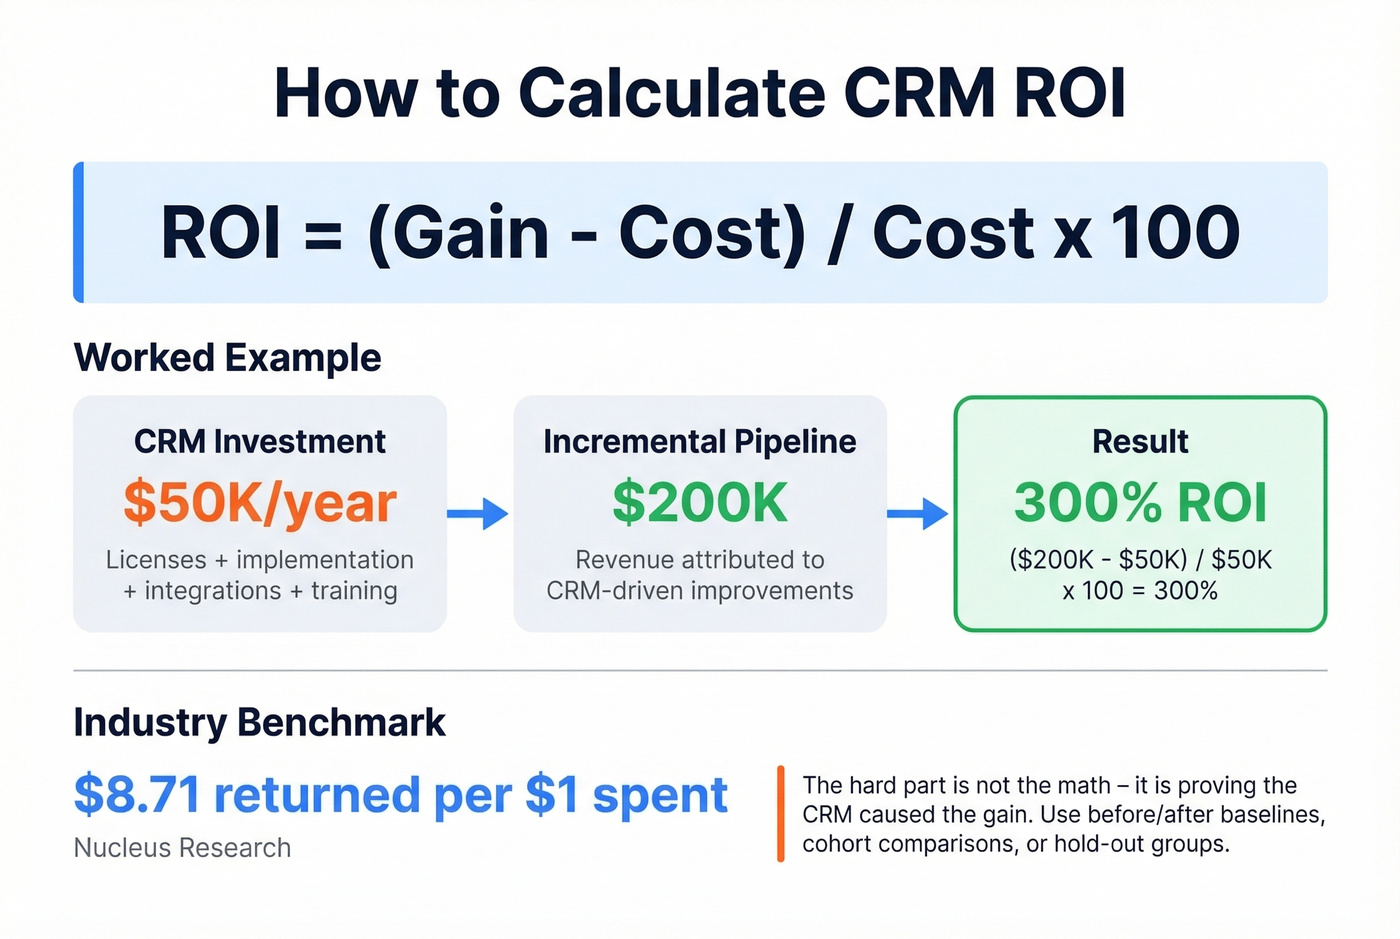
A mid-market CRM deployment runs $30-80K/year when you factor in licenses, implementation, integrations, and training. Nucleus Research puts the average CRM return at $8.71 per $1 spent, but your mileage depends entirely on adoption and data quality.
Here's a worked example: a team spending $50K/year on CRM that attributes $200K in incremental pipeline to CRM-driven improvements gets ($200K - $50K) / $50K x 100 = 300% ROI.
The hard part isn't the math - it's proving the CRM caused the gain. Hiring three new reps, launching a new product, and implementing a CRM in the same quarter makes isolation nearly impossible. Use before/after baselines, cohort comparisons, incrementality testing, or hold-out groups if you want a number your CFO won't poke holes in.
Let's be honest: most teams with deal sizes under $10K don't need CRM ROI calculations at all. They need to verify that reps are actually logging calls and that the contact data they're dialing is accurate. Conversion rates tank when reps dial dead numbers or send emails that bounce. Fix the data layer first, then worry about attribution models. One team we've worked with saw their bounce rate drop from 35% to under 4% just by enriching their CRM records - pipeline tripled in the same period.
CRM Measurement Mistakes to Avoid
Five anti-patterns we see repeatedly:
- Metric overload. Bernard Marr nailed it: most businesses are "data rich, but insight poor." If your dashboard has more than 6-8 KPIs, nobody's reading it. Skip the vanity metrics and focus on what drives decisions.
- Lagging-only indicators. Revenue closed tells you nothing about what's breaking upstream. Pair it with speed-to-lead and stage conversion rates.
- No baselines. You can't measure improvement without a starting point. Snapshot key numbers before any CRM change.
- Set-and-forget dashboards. A dashboard built during implementation and never updated becomes wallpaper. Prune quarterly.
- Vanity metrics. Total contacts means nothing if 10-30% are duplicates. Stop celebrating volume - measure accuracy.
The consensus on r/salesforce and r/sales echoes this: teams that obsess over dashboard aesthetics instead of data hygiene end up with beautiful reports built on garbage inputs.
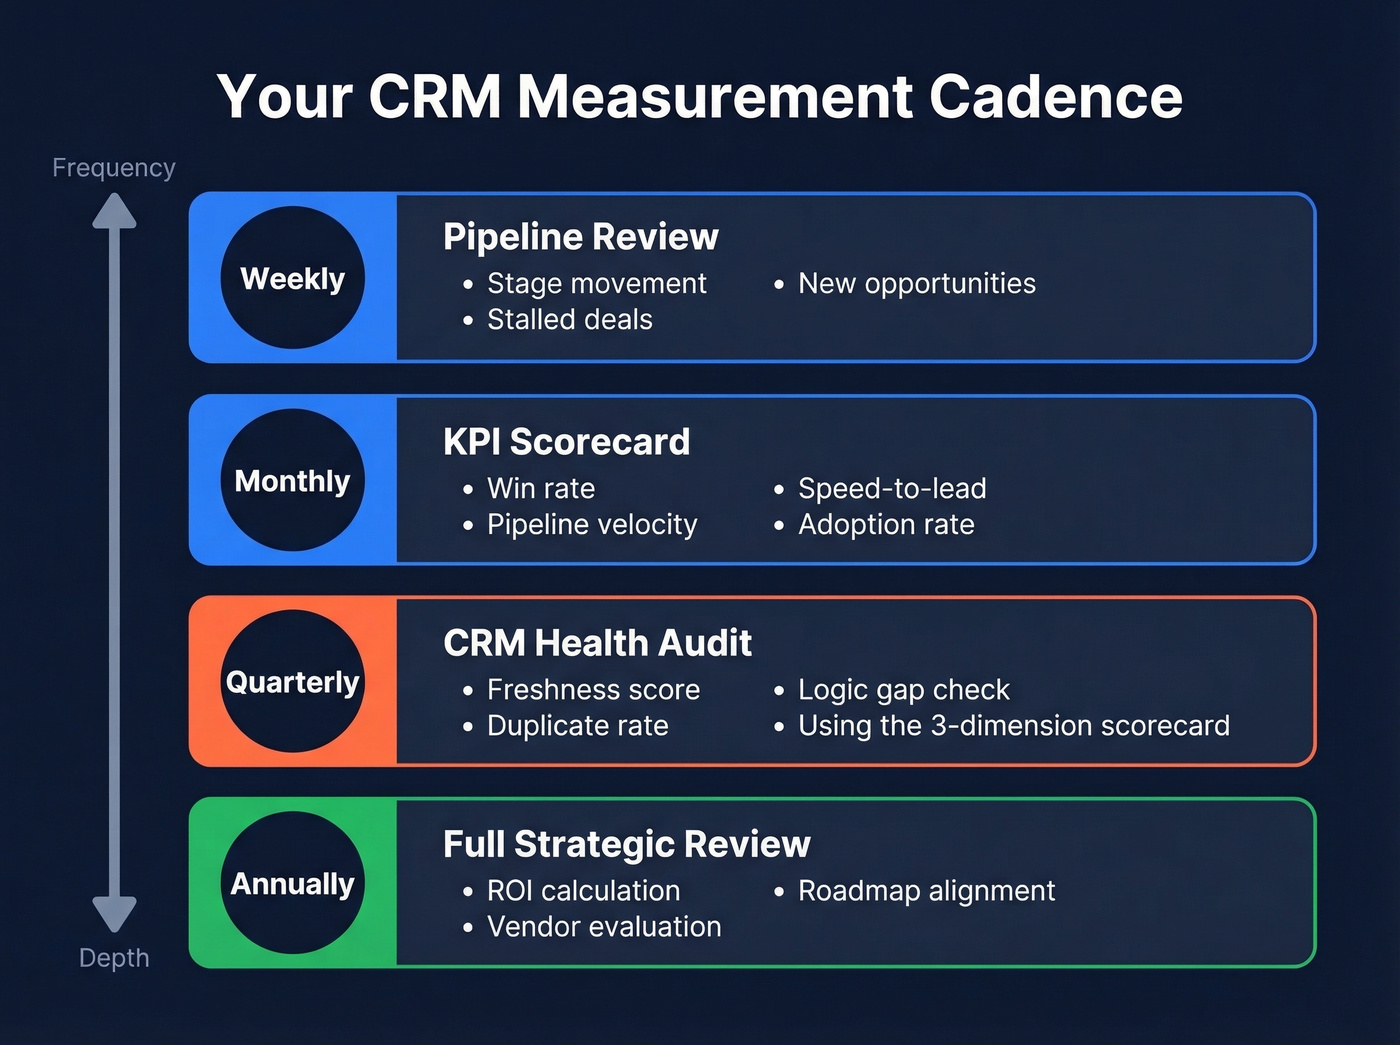
Your Measurement Cadence
- Weekly: Pipeline review - stage movement, stalled deals, new opportunities
- Monthly: KPI scorecard - win rate, pipeline velocity, speed-to-lead, adoption
- Quarterly: CRM health audit using the scorecard above
- Annually: Full ROI calculation + roadmap alignment (tie this back to your sales operations metrics)
Speed-to-lead collapses when reps dial dead numbers or email addresses that bounce. Prospeo delivers 98% verified emails and 125M+ direct dials so your CRM actually connects reps to real buyers - at $0.01 per email, no contracts required.
Stop measuring a CRM full of bad data. Clean it first.
FAQ
How do you measure CRM success if adoption is low?
Start with adoption rate - it's the gatekeeper metric. If fewer than 37% of reps use the CRM daily, every downstream KPI is built on incomplete data. Pause outcome tracking, run change management workshops, and re-measure adoption after 30 days.
How long before you can calculate CRM ROI?
Most teams need 6-12 months of clean, consistent data before ROI calculations are meaningful. In the first 90 days, focus on adoption and data migration accuracy. Attempting ROI math earlier usually produces misleading numbers that erode trust in the whole measurement effort.
How do you improve CRM data quality for better metrics?
Run a health audit covering freshness, duplicates, and logic gaps quarterly. Then enrich stale records with verified contact data. Automated enrichment tools that refresh on a weekly cycle - rather than the typical 6-week cadence - keep your scorecard honest between audits.
What's the single most important CRM metric?
Adoption rate. Without consistent usage from your sales team, no other metric - win rate, pipeline velocity, forecast accuracy - reflects reality. RevOps leaders consistently rank it as the strongest predictor of long-term CRM implementation success.