Incremental Sales Definition, Formula, and How to Actually Measure Them
A Skai survey offered respondents ten possible definitions of "incremental sales" - and the top two each got just 48% agreement. That's a coin flip on a concept guiding millions in budget decisions.
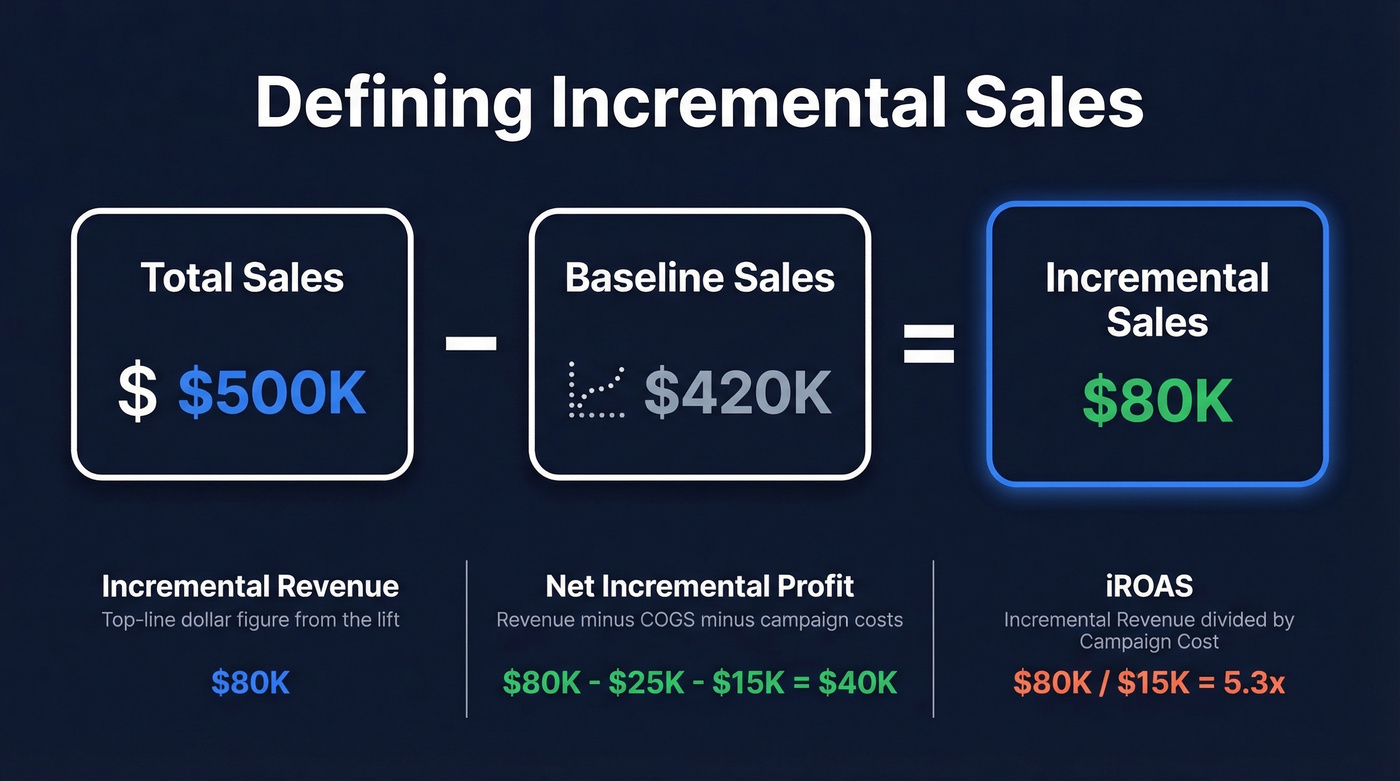
Getting the incremental sales definition right matters because 36% of marketers say proving incrementality is their single biggest measurement challenge. Your dashboard says a campaign drove $500K in revenue, but after stripping out sales that would've happened anyway, the true incremental contribution is $80K. The gap between attributed and incremental is where budgets go to die.
The One-Sentence Definition
Incremental sales are the additional sales directly caused by a specific campaign or action, above what would've happened without it.
The Formula:
[Incremental Sales = Total Sales - Baseline Sales](https://www.pipedrive.com/en/blog/incremental-sales)
The formula is simple. The hard part - the part most guides gloss over - is establishing a reliable baseline. A bad baseline makes the formula useless. If you already know the concept, skip to the testing methods section.
What Are Incremental Sales?
Incremental sales represent the causal lift a specific marketing activity generates above what your business would've sold anyway. That "would've sold anyway" figure is your baseline - the natural run rate absent any intervention.
Formula:
Incremental Sales = Total Sales - Baseline SalesNet Incremental Profit:
Incremental Sales Revenue - COGS - Campaign CostsiROAS (Incremental ROAS):
Incremental Revenue / Campaign Cost
Don't confuse three related but different concepts. Incremental sales is the unit or dollar volume above baseline. Incremental revenue is the top-line dollar figure. Net incremental profit subtracts your cost of goods and campaign spend - the number your CFO actually cares about.
iROAS (Incremental ROAS) separates sophisticated teams from everyone else. Standard ROAS counts all attributed revenue, including organic sales. iROAS strips those out. For context, benchmarks across retail media range from 253% to 1,609% iROAS depending on category - if your number falls outside that range, your baseline probably needs work.
Why Incrementality Matters in 2026
Three forces are converging to make incrementality the measurement standard.
The money at stake is enormous. U.S. retail media ad spend exceeded $62B in 2025, with 84.2% concentrated on Amazon and Walmart alone. Now 71% of advertisers rank incrementality as their most important KPI for retail media. When budgets are that large, "we think it's working" doesn't cut it.
Trust in attribution is cratering. Only 42% of respondents trust their first- or last-touch attribution models. Privacy changes, cookie deprecation, and iOS restrictions have gutted multi-touch attribution's ability to track user journeys. MTA is dying. Everyone knows it.
The channels keep multiplying. 85% of CPG brands now spend across four or more retail media networks. Without incrementality testing, you're flying blind across every one of them.
Here's the thing: most teams don't have a measurement problem - they have a courage problem. They know attribution is broken but keep using it because the numbers look better. Incrementality forces honesty, and honesty is uncomfortable when it reveals your "best" channel is mostly cannibalizing organic demand.
The Formula in Action
Example 1 - Historical Baseline: Your e-commerce store averages $200K/month over six months. You run a campaign in July; total revenue hits $265K. Incremental sales = $265K - $200K = $65K. Campaign cost was $15K, so iROAS = $65K / $15K = 4.3x. After subtracting $20K in COGS on incremental units, net incremental profit = $30K.
Example 2 - Test/Control (More Rigorous): You split 20,000 customers into two equal groups. The control group sees no campaign; the treatment group gets your ads. Control converts at 2.0%; treatment at 2.8%. The 0.8-point delta applied to your full 500K addressable audience yields 4,000 incremental conversions. At $50 AOV, that's $200K in incremental revenue. Campaign cost was $40K, so iROAS = 5.0x.
The test/control method is harder to execute but dramatically more trustworthy. Historical baselines assume the past predicts the future, which breaks during seasonality shifts, competitive moves, or market disruptions. We've seen teams graduate from historical baselines to holdout tests and discover their "top-performing" campaigns are materially less incremental than dashboards suggest.
Establishing a Reliable Baseline
The baseline is where most teams fail. Three methods, ranked by rigor.
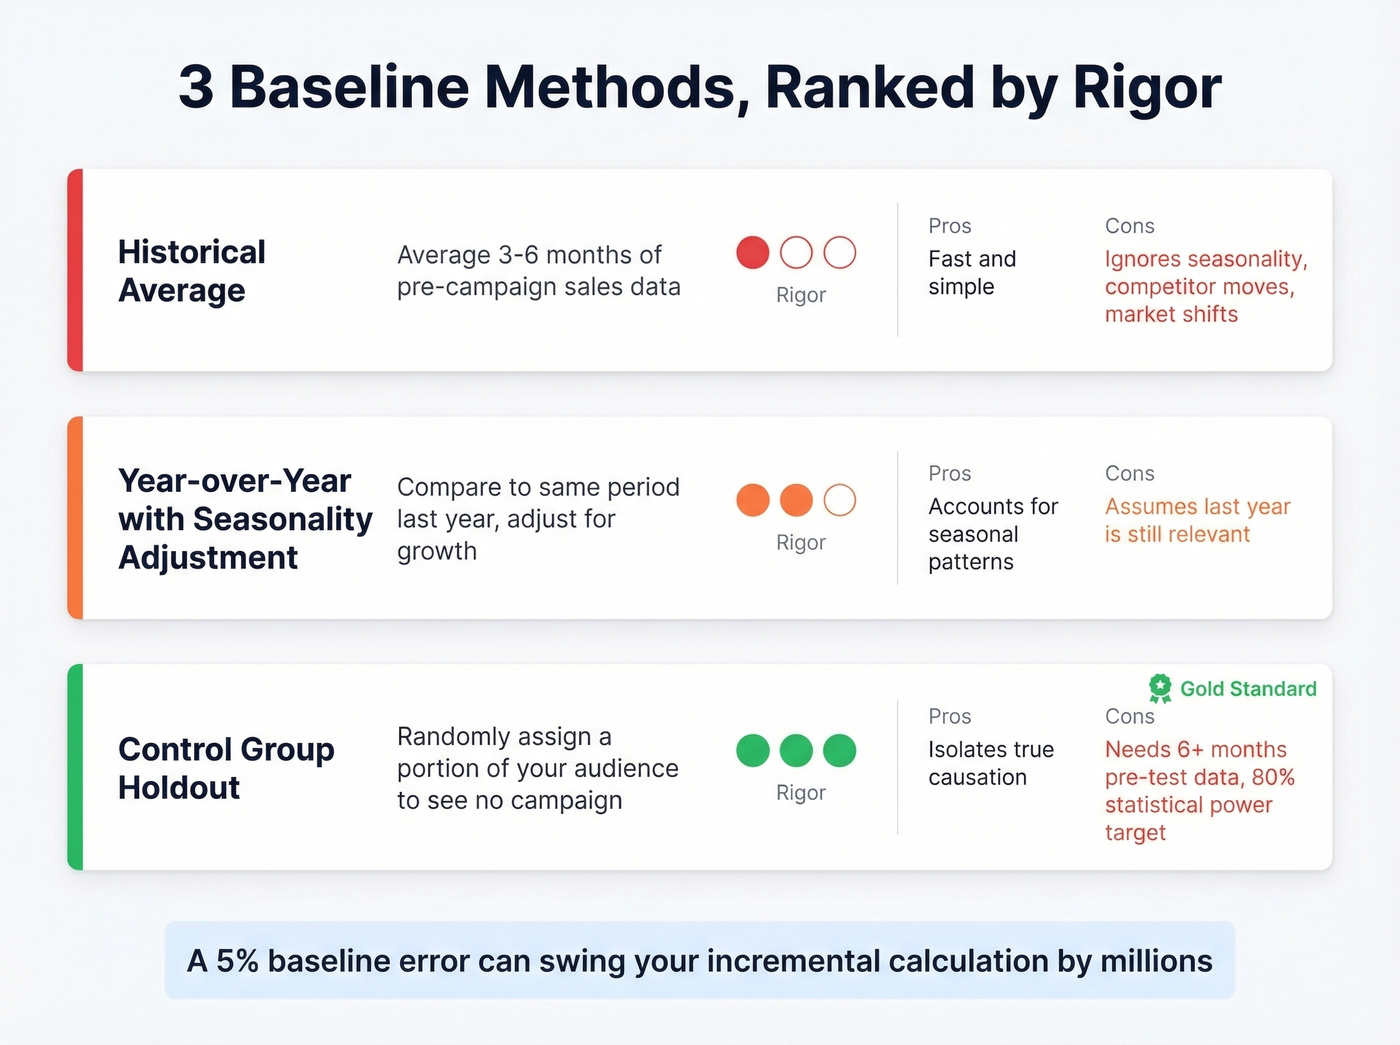
Historical average is the starting point: take 3-6 months of pre-campaign sales data and average it. Fast, simple, and the weakest option. It ignores seasonality, competitor activity, and market shifts. Be aware of confounding factors even within your own business - staff turnover, product changes, pricing adjustments, and measurability lag can all distort a historical baseline. Most guides stop here. Don't.
Year-over-year comparison with seasonality adjustment compares the campaign period to the same period last year, adjusted for organic growth. Better, but still assumes last year's conditions are relevant.
Control group holdout is the gold standard. Randomly assign a portion of your audience or geography to receive no campaign exposure. Their behavior during the test period is your baseline - the only method that isolates causation. Geo tests need at least 6 months of pre-test history for baseline modeling and should target 80% statistical power.
A 5% error in your baseline can swing your incremental sales calculation by millions. I've watched a team celebrate a "3x iROAS" result that evaporated to 0.8x once someone corrected for a seasonal spike baked into the baseline. That was a painful meeting.
Bad baselines kill incremental sales analysis. Bad data kills the campaigns themselves. Prospeo delivers 98% verified email accuracy on a 7-day refresh cycle, so every dollar you spend on outbound actually reaches real buyers - giving you clean conversion data to measure true lift.
Fix your data before you try to fix your measurement.
9 Testing Methods
This section separates a real incrementality practice from a back-of-napkin guess.
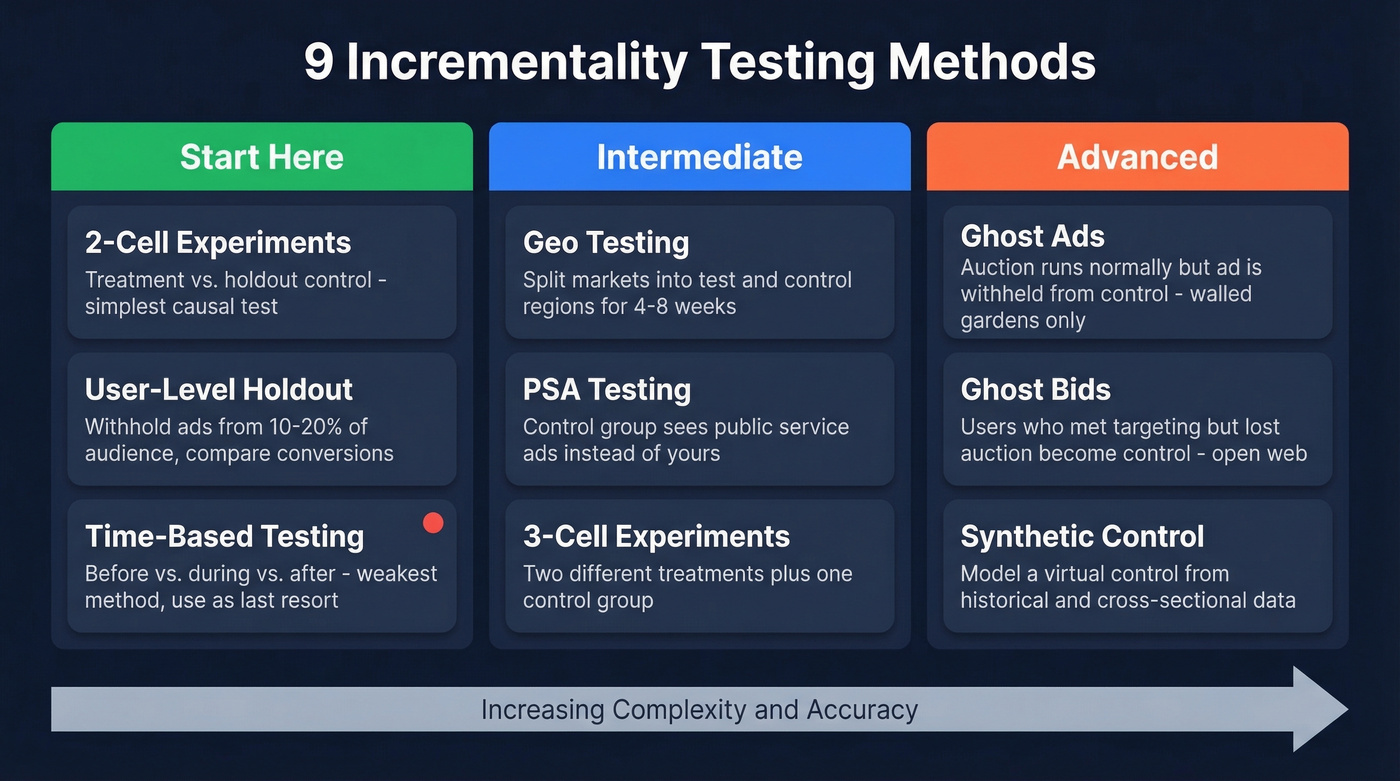
Start Here
2-cell experiments pit a treatment group against a holdout control. The simplest experiment structure for measuring causal impact - begin here if you're new to incrementality.
User-level holdout randomly withholds ads from 10-20% of your target audience and compares conversion rates. This is the gold standard for digital channels, but it requires platform support or a DSP that can manage holdouts.
Time-based testing compares before, during, and after campaign periods. The weakest method because it can't control for external factors. Use only when nothing else is feasible.
Intermediate
| Method | How it works | Best for |
|---|---|---|
| Geo testing | Split markets into test/control regions for 4-8 weeks | Offline + online channels |
| PSA testing | Control sees public service ads instead of yours | When holdouts aren't feasible |
| 3-cell experiments | Two treatments + one control | Comparing creative strategies |
A grocery chain ran a geo test on non-brand paid search across 12 markets and found 0% incremental lift. Zero. They reallocated the entire budget to CTV.
Advanced
Ghost ads let the auction run normally but withhold the ad from the control group, logging a "ghost" impression. Available in walled gardens like Meta and Google. Highly accurate because the control group matches the treatment group's targeting criteria exactly.
Ghost bids are the open-web version - using users who met targeting criteria but weren't won in the auction as the control. More complex but works outside walled gardens.
Synthetic control groups model a "virtual" control from historical and cross-sectional data. Increasingly standard for modern geo experiments because they solve imperfect market matches and small sample sizes.
The Uber anecdote is worth knowing. They paused Meta ads for months and saw no measurable negative impact on conversions, reallocating roughly $35M annually. That's the power of actually measuring incrementality instead of trusting attribution dashboards.
Incrementality vs. Attribution vs. MMM
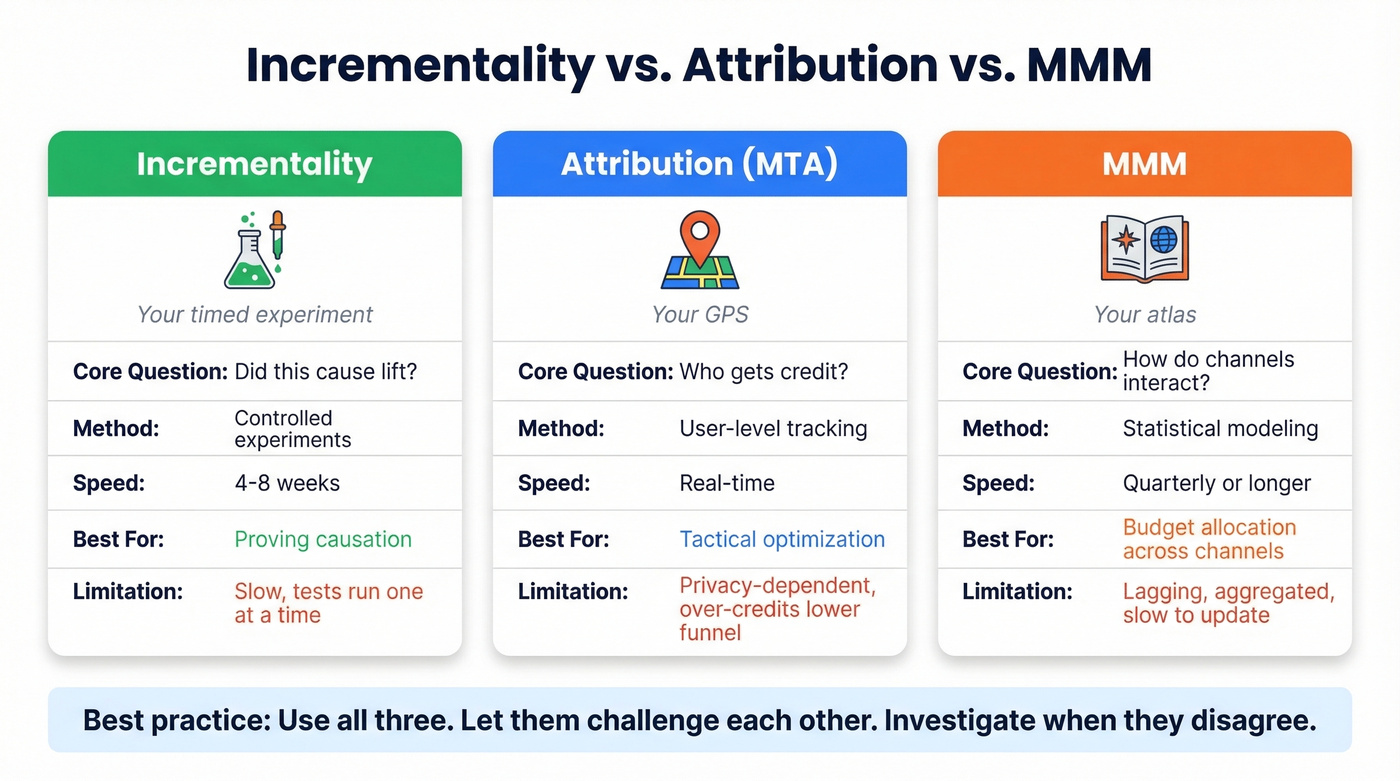
These three approaches answer different questions. The best analogy: MMM is your atlas, MTA is your GPS, and incrementality is a timed experiment.
| Incrementality | Attribution (MTA) | MMM | |
|---|---|---|---|
| Core question | Did this cause lift? | Who gets credit? | How do channels interact? |
| Method | Experiments | User tracking | Statistical modeling |
| Speed | 4-8 weeks | Real-time | Quarterly+ |
| Best for | Proving causation | Tactical optimization | Budget allocation |
| Limitation | Slow, serial | Privacy-dependent | Lagging, aggregated |
Let's be honest about the state of things: 84% of teams say they can prove ROI, but only 38% track every channel. The consensus on r/analytics mirrors this - attribution and incrementality produce wildly different results, and teams relying on attribution alone consistently over-credit lower-funnel channels.
The right answer isn't picking one. It's triangulated measurement - use all three, let them challenge each other, and investigate when they disagree.
What the Formula Misses
Two effects silently wreck incremental sales calculations.
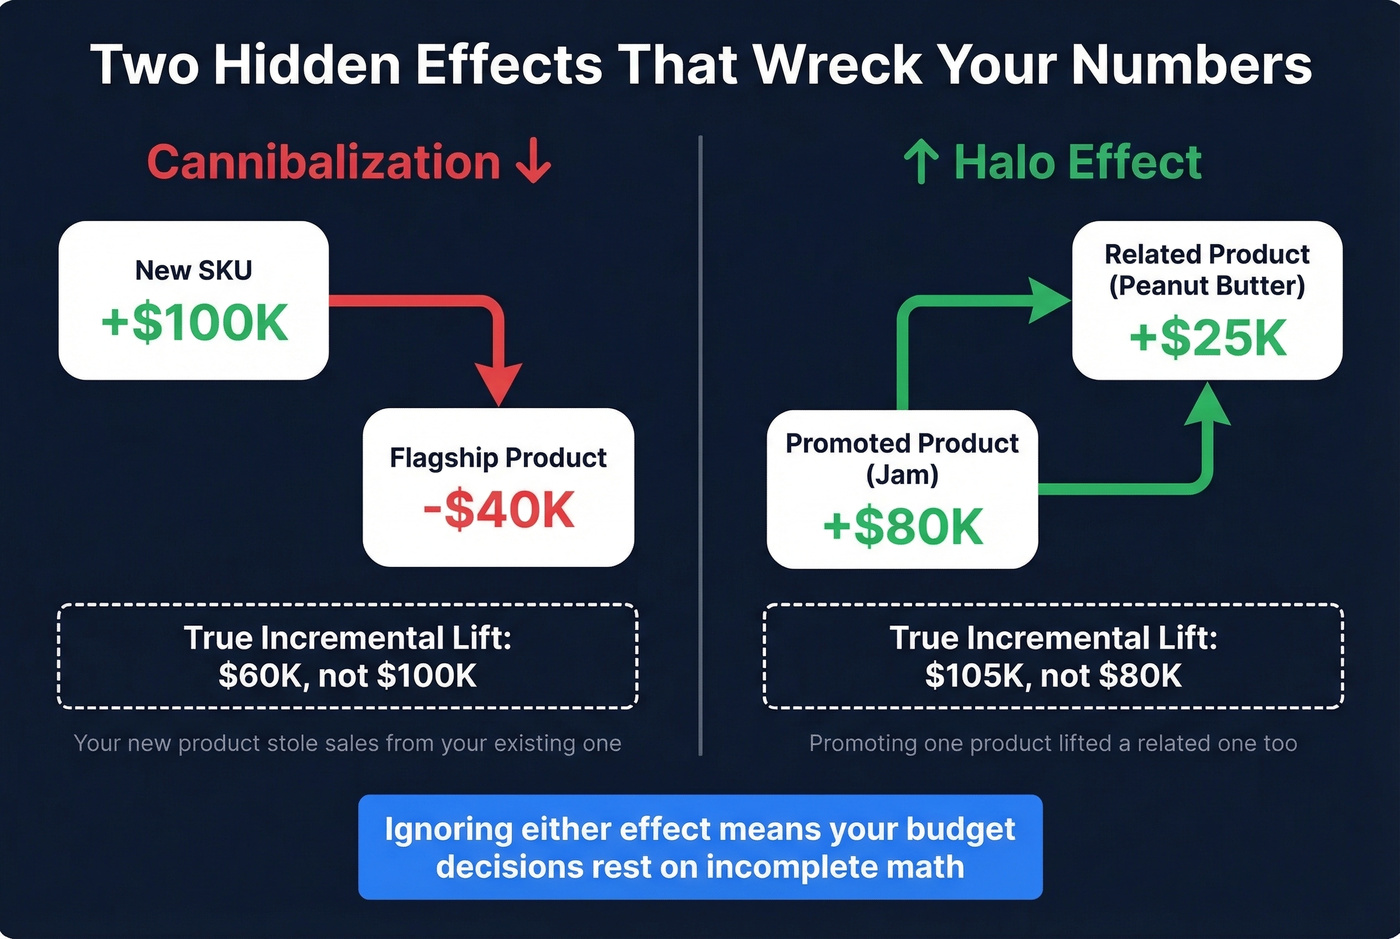
Cannibalization happens when a new product or promotion steals sales from existing products. If your new SKU generates $100K but your flagship drops $40K, true incremental lift is $60K, not $100K.
Halo effects work in reverse - promoting one product lifts related products. A jam launch increases peanut butter sales. Ignoring halo effects means you're underestimating incremental impact. Both effects need measurement, or your budget decisions rest on incomplete math.
Mistakes That Ruin Tests
We've seen teams invest weeks in test design only to invalidate their own results. Skip this section at your peril.
Tainted control groups are the #1 failure mode. Retargeting pixels, cross-channel exposure, or lookalike audiences leak into your control. Reddit threads consistently flag this as the most common problem. If the control isn't truly isolated, your lift measurement is garbage.
Insufficient sample size or duration kills statistical power. Three days with 100 people won't yield meaningful results. Design for 80% power and run geo tests for 4-8 weeks minimum.
Shifting goalposts after seeing results is a recipe for confirmation bias. Pre-commit your analysis plan before the test starts. Write it down. Share it with stakeholders. Lock it.
Wrong KPIs mislead. A campaign can look efficient on CPC and still generate zero incremental sales. Measure incremental profit or iROAS, not vanity metrics.
Giving up too early wastes learning. Ritual's first TikTok incrementality test showed zero lift. After iterating on creative and targeting, a subsequent test showed 8% lift. A failed test isn't a failed channel - it's a data point.
How to Drive More Incremental Sales
Launch new products or SKUs. New offerings create demand that didn't exist before - the purest form of additive revenue. Watch for cannibalization of existing products.
Upsell and cross-sell existing customers. Expanding wallet share with current buyers is incremental by definition, since the baseline is their existing purchase pattern. (If you want the tactical difference, see upsell and cross-sell.)
Run time-limited promotions. Urgency pulls forward purchases and captures fence-sitters. Measure carefully - some "incremental" promo sales are just demand borrowed from next month.
Expand into new channels. Every untapped channel represents potential incremental reach. Test with holdouts so you can prove the channel is additive, not redistributing existing conversions.
Use better prospect data for outbound. Outbound campaigns only generate real incremental lift if the contacts are accurate. When 20% of your emails bounce, you're measuring data noise, not campaign performance. Prospeo's 98% email accuracy and 7-day data refresh cycle mean the outbound lift you measure is actual lift, not inflated by dead addresses. If you're tightening list quality, start with data enrichment and a clean lead enrichment workflow.
Your iROAS calculation is only as good as the pipeline feeding it. Teams using Prospeo book 26% more meetings than ZoomInfo users and 35% more than Apollo - at $0.01 per email. That's incremental pipeline you can actually attribute with confidence.
Measure real lift from outbound that actually connects.
FAQ
What's the difference between incremental and total sales?
Total sales is everything sold during a period. Incremental sales is only the portion directly caused by a specific campaign, above the baseline of what would've sold anyway. If total revenue is $300K and your baseline is $220K, the incremental figure is $80K.
How long should an incrementality test run?
Geo tests typically need 4-8 weeks of in-market exposure plus at least 6 months of pre-test data for baseline modeling. Design for 80% statistical power to detect your minimum expected lift - anything shorter risks false negatives.
What is iROAS and how does it differ from ROAS?
iROAS equals incremental revenue divided by campaign cost. Standard ROAS counts all attributed revenue including organic sales; iROAS strips those out. Retail media benchmarks range from 253% to 1,609% iROAS depending on category.
How can outbound teams measure incremental lift accurately?
Start with a holdout test: withhold outbound sequences from 10-15% of a matched prospect list and compare conversion rates after 4-6 weeks. Accurate contact data is critical - tools like Prospeo reduce bounce-driven noise so your measured lift reflects real campaign impact, not data quality variance.